The following line graph shows the yearly sales figures for a manufacturing company. (a) What were the sales in
(i) 2002 (ii) 2006?
(b) What were the sales in
(i) 2003 (ii) 2005?
(c) Compute the difference between the sales in 2002 and 2006.
(d) In which year was there the greatest difference between the sales as compared to its previous year?
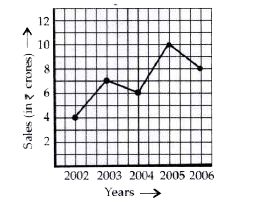
Step by step video & image solution for The following line graph shows the yearly sales figures for a manufacturing company. (a) What were the sales in (i) 2002 (ii) 2006? (b) What were the sales in (i) 2003 (ii) 2005? (c) Compute the difference between the sales in 2002 and 2006. (d) In which year was there the greatest difference between the sales as compared to its previous year? by Maths experts to help you in doubts & scoring excellent marks in Class 8 exams.
Updated on:21/07/2023Topper's Solved these Questions
- INTRODUCTION TO GRAPHS Book:MTG IIT JEE FOUNDATIONChapter:INTRODUCTION TO GRAPHS Exercise:NCERT SECTIONS (15.2)
Explore 6 Videos
- INTRODUCTION TO GRAPHS Book:MTG IIT JEE FOUNDATIONChapter:INTRODUCTION TO GRAPHS Exercise:NCERT SECTIONS (15.3)
Explore 4 Videos
- INTRODUCTION TO GRAPHS Book:MTG IIT JEE FOUNDATIONChapter:INTRODUCTION TO GRAPHS Exercise:SOLVED EXAMPLES
Explore 25 Videos
- FOOTSTEPS TOWARDS JEE MAINBook:MTG IIT JEE FOUNDATIONChapter:FOOTSTEPS TOWARDS JEE MAINExercise:Section B (Numerical Value Type Questions)
Explore 9 Videos
- LINEAR EQUATIONS IN ONE VARIABLEBook:MTG IIT JEE FOUNDATIONChapter:LINEAR EQUATIONS IN ONE VARIABLEExercise:Olympiad/HOTS Corner
Explore 15 Videos
Similar Questions
The line graph given below shows the yearly sales figures for a manufacturing company during the last five years.
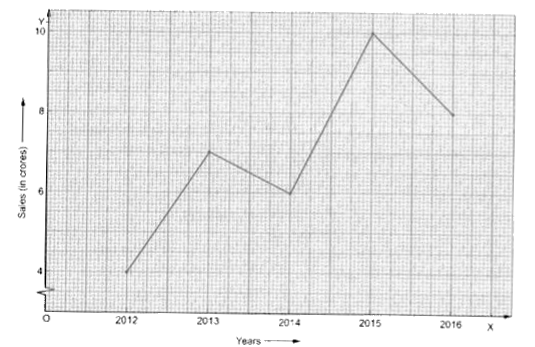
Study the above graph carefully and answer the questions given below :
(i) What are the sales in (a)2013 (b)2015 (c)2016 ?
(ii) Compute the difference between the sales in 2012 and 2016 ?
(iii) In which year was there the greatest difference between the sales as compared to its previous year?
View SolutionThe line chart given below represents the sales (in 00) of trousers and shirts for five months .
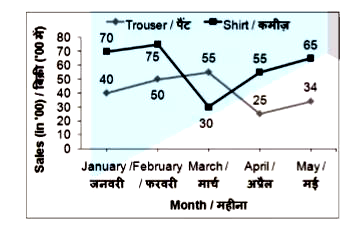
What is the difference between sales of shirts for months January and March?
View Solution
Knowledge Check
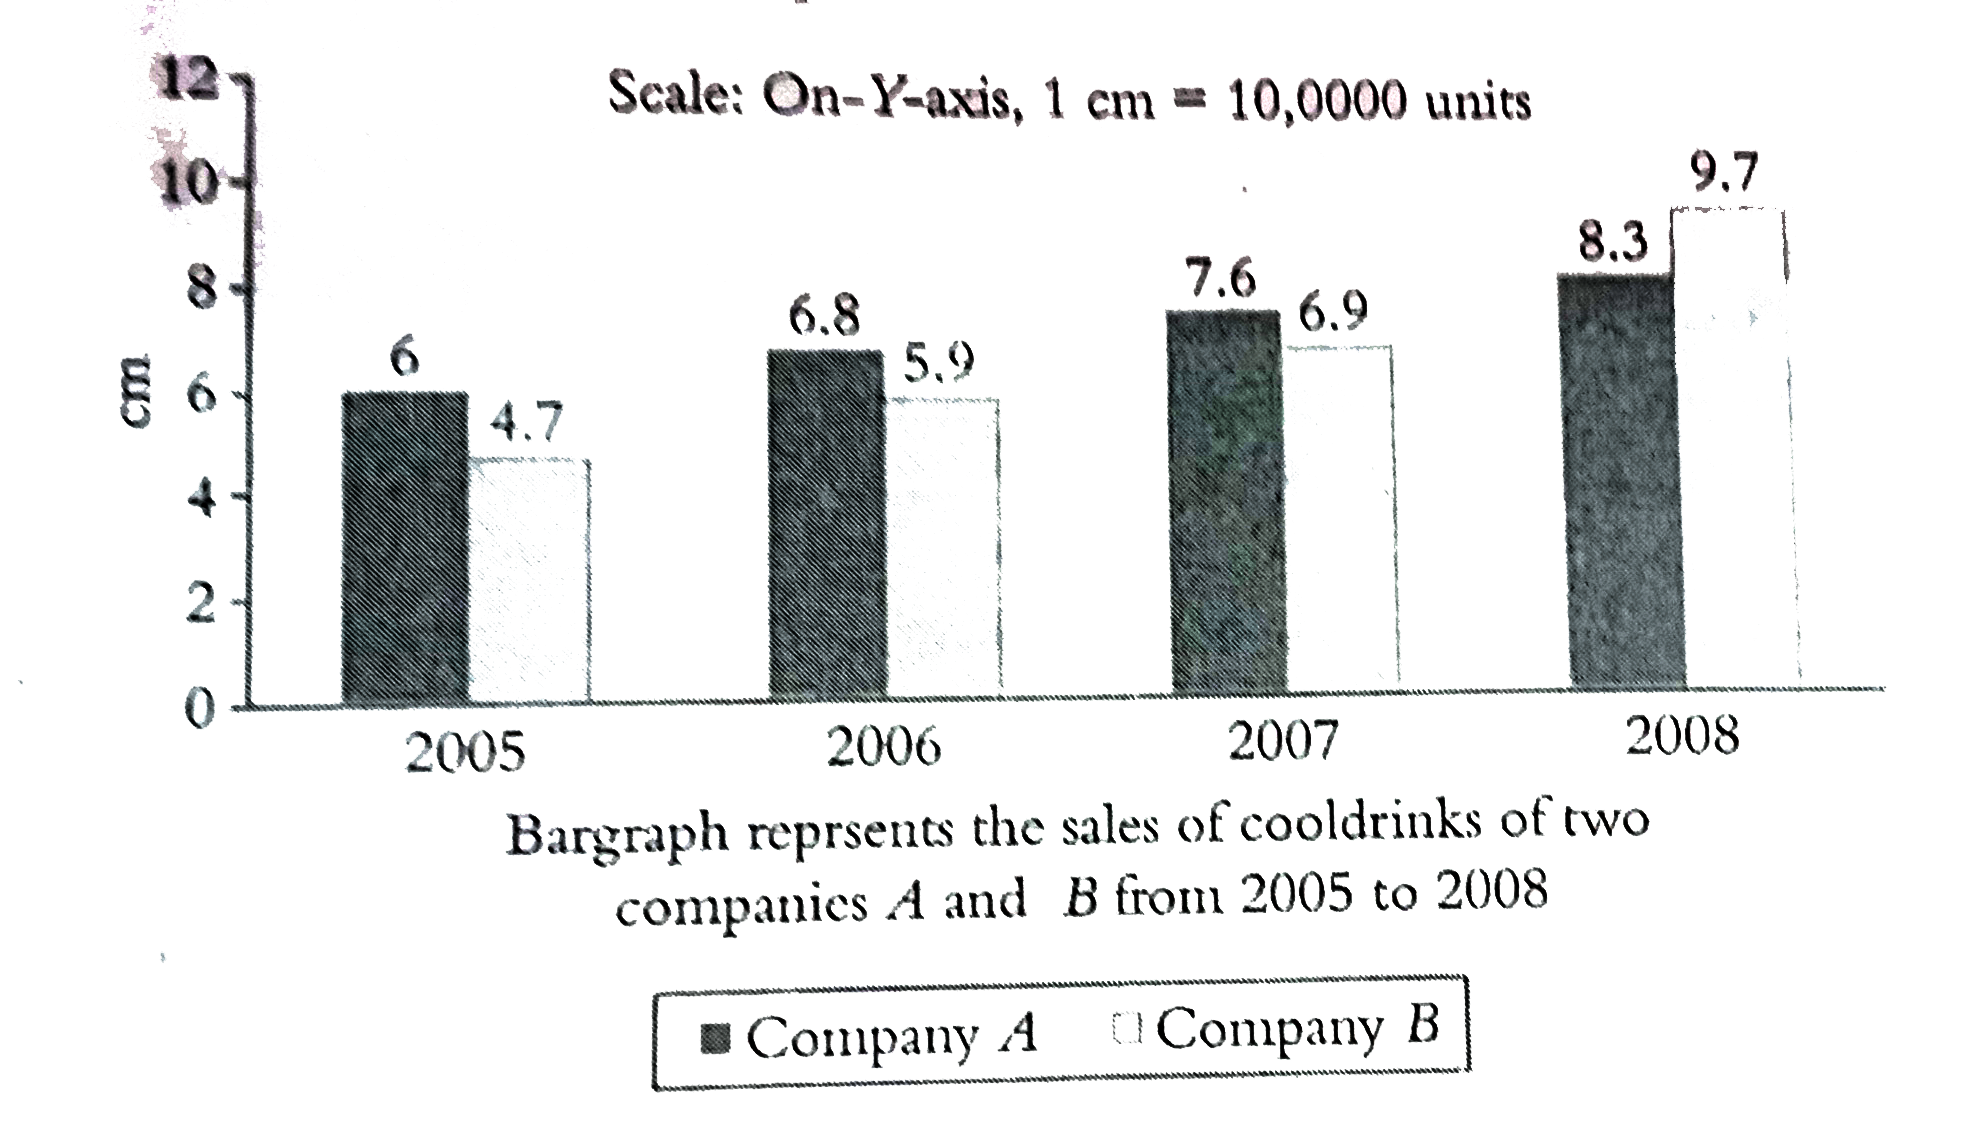
In which year is the difference between the sales of A and the sales of B the highest ?A2008B2005C2006D2007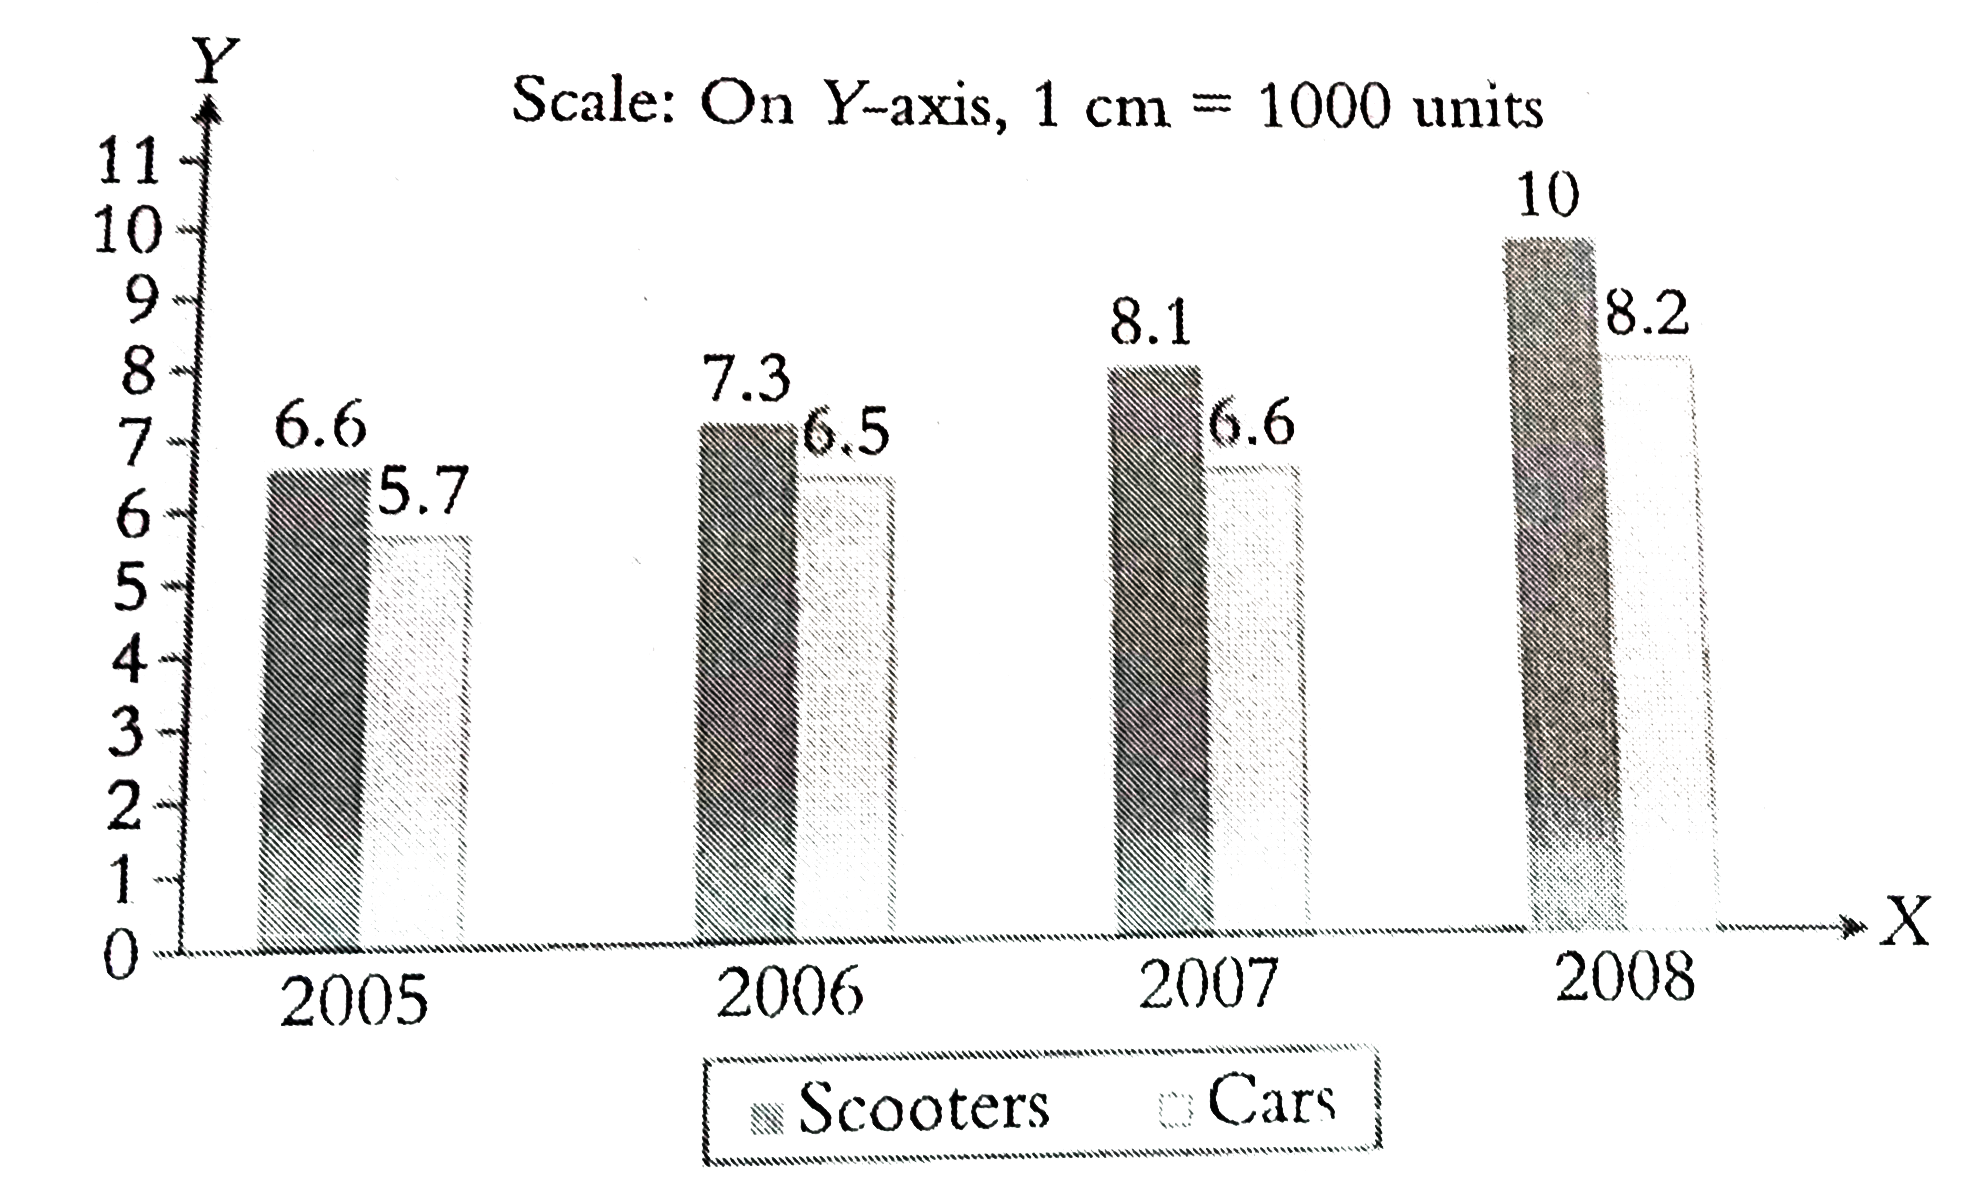
In which year is the difference between the sales of the scooters and the sales of cars the least ?A2005B2006C2007D2008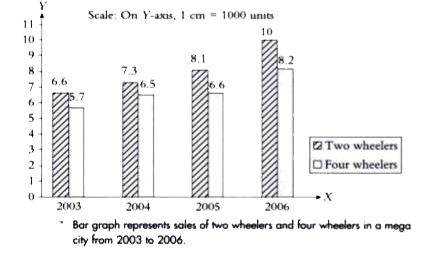
In which year the difference between sales of two wheelers and four wheelers is less?A2003B2004C2005D2006
The line graph shows the Sales per employee of a certain company. Study the diagram and answer the following questions.
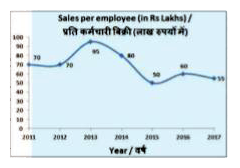
In which year were the Sales per employee greater than that of the previous year?
View Solution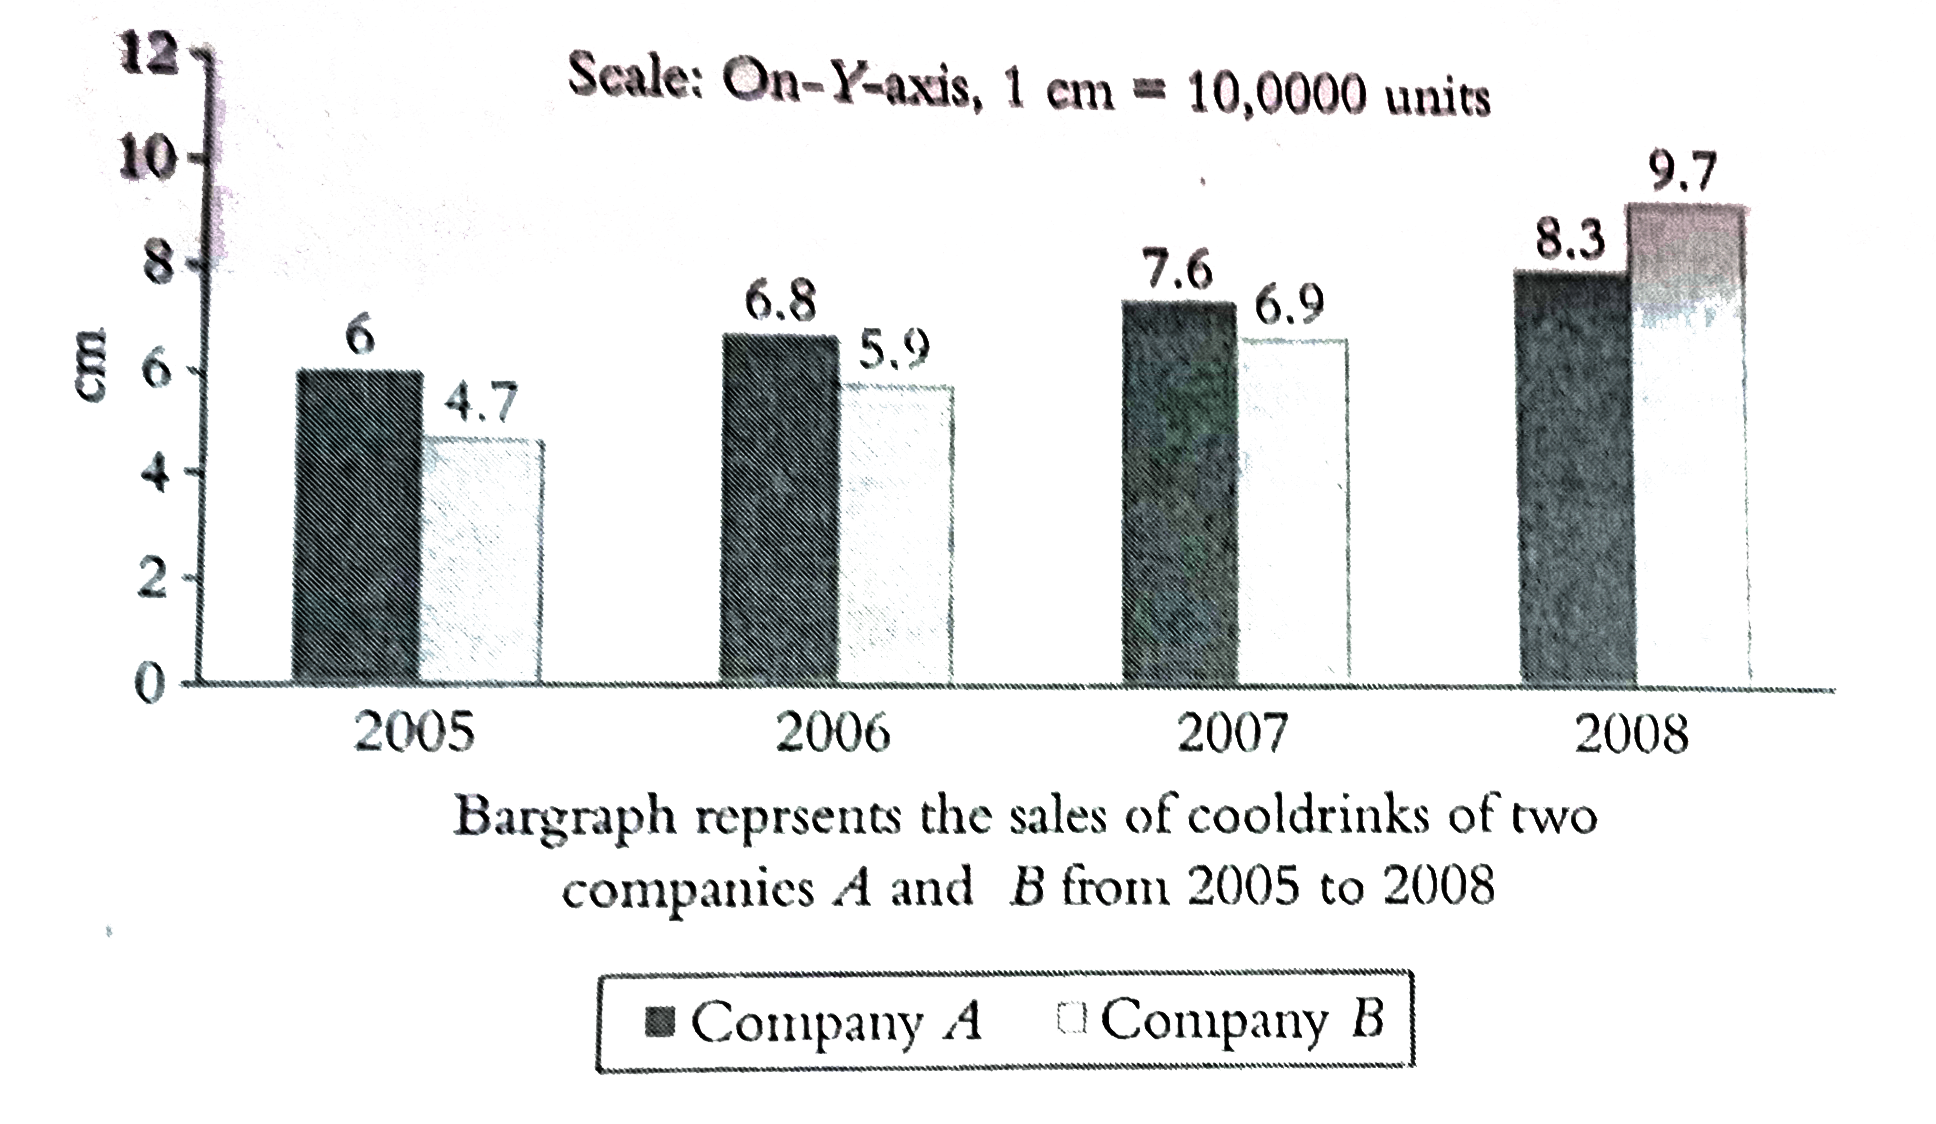
Find the minimum difference between the sales of A and sales of B in any year in the given period.
View SolutionStudy the following table and the answer the questions based on it : (in lakhs of Rs.)
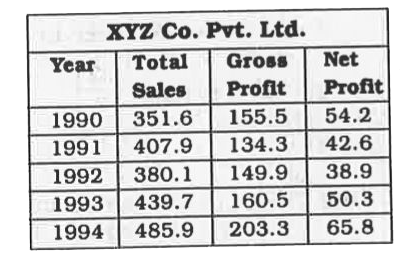
In which year the difference between the total sales and the gross profit is the least ?
View SolutionThe line graph shows the number of vacancies for sales officers in a certain company. Study the diagram and answer the following questions.
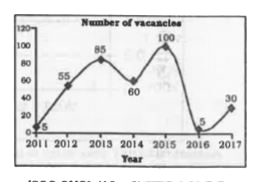
What was the difference in the number of vacancies between the years 2015 and 2012?
View SolutionThe line chart given blow represents the sales (in 00) of trousers ans shirts for five months.
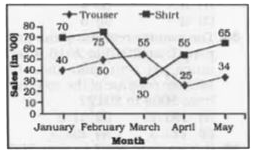
What is the difference between sales of shirts for months January and April?
View Solution
