The line graph given below shows the yearly sales figures for a manufacturing company during the last five years.
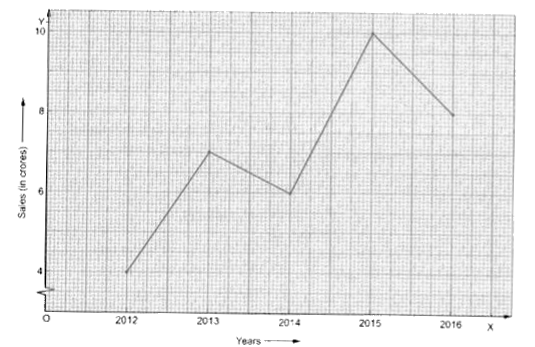
Study the above graph carefully and answer the questions given below :
(i) What are the sales in (a)2013 (b)2015 (c)2016 ?
(ii) Compute the difference between the sales in 2012 and 2016 ?
(iii) In which year was there the greatest difference between the sales as compared to its previous year?
The correct Answer is:(i)(a)Rs7 crore (b)Rs10 crore (c)Rs8 crore (ii)4 crore (iii)2015
Step by step video, text & image solution for The line graph given below shows the yearly sales figures for a manufacturing company during the last five years. Study the above graph carefully and answer the questions given below : (i) What are the sales in (a) 2013 (b) 2015 (c ) 2016 ? (ii) Compute the difference between the sales in 2012 and 2016 ? (iii) In which year was there the greatest difference between the sales as compared to its previous year? by Maths experts to help you in doubts & scoring excellent marks in Class 8 exams.
Updated on:21/07/2023Topper's Solved these Questions
- LINE GRAPHS AND LINEAR GRAPHSBook:RS AGGARWALChapter:LINE GRAPHS AND LINEAR GRAPHSExercise:Exercise 23
Explore 25 Videos
- INTRODUCTION TO COORDINATE GEOMETRYBook:RS AGGARWALChapter:INTRODUCTION TO COORDINATE GEOMETRYExercise:EXERCISE B (OBJECTIVE QUESTIONS)
Explore 7 Videos
- LINEAR EQUATIONSBook:RS AGGARWALChapter:LINEAR EQUATIONSExercise:TEST PAPER-8 (D) (Write .T. for true and .F. for false for each of the following:)
Explore 1 Video
Similar Questions
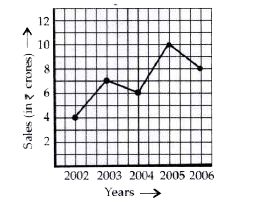
The following line graph shows the yearly sales figures for a manufacturing company.(a) What were the sales in (i) 2002 (ii) 2006?(b) What were the sales in (i) 2003 (ii) 2005?(c) Compute the difference between the sales in 2002 and 2006.(d) In which year was there the greatest difference between the sales as compared to its previous year?

View SolutionThe following line graph shows the yearly sales figures for a manufacturing company. (a) What were the sales in
(i) 2002 (ii) 2006?
(b) What were the sales in
(i) 2003 (ii) 2005?
(c) Compute the difference between the sales in 2002 and 2006.
(d) In which year was there the greatest difference between the sales as compared to its previous year?
View Solution
Knowledge Check
Study the following graph carefully and answer the question given below-----
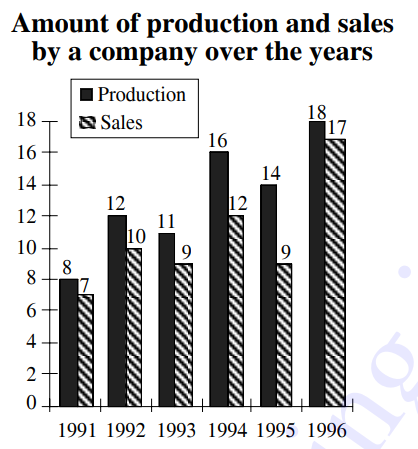
What was the difference between the sales of 1992 and 1995 ?A10 lakh tonnesB50 thousand tonnesC1 lakh tonnesD75 thousand tonnesStudy the following graph carefully and answer the question given below-----
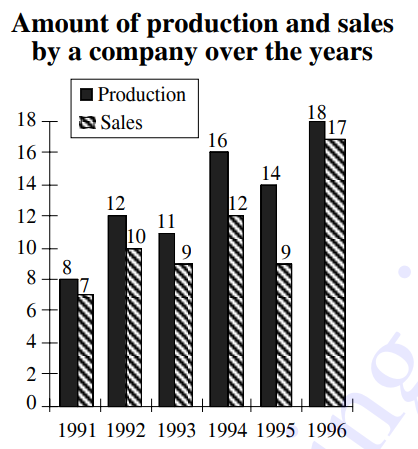
What was the percentage drop in sales from 1992 to 1993 ?A1B10C20D15Study the graph and answer the questions.
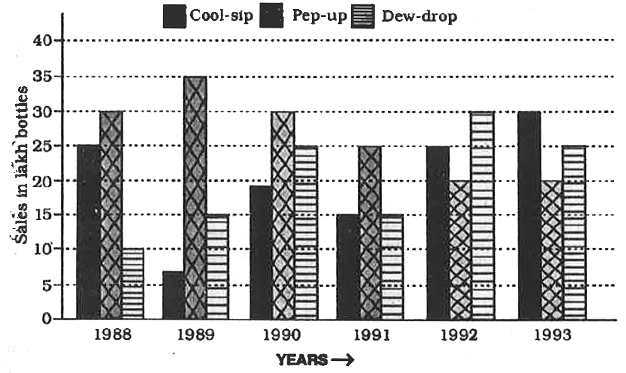
In which year sale of Drew-drop is maximum ?A1998B1992C1989D1993
Study the graph and answer the questions.
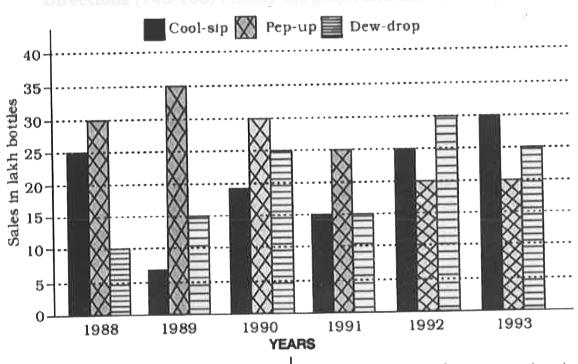
In which year sale of Dew -drop is maximum ?
View SolutionStudy the graph and answer the questions.
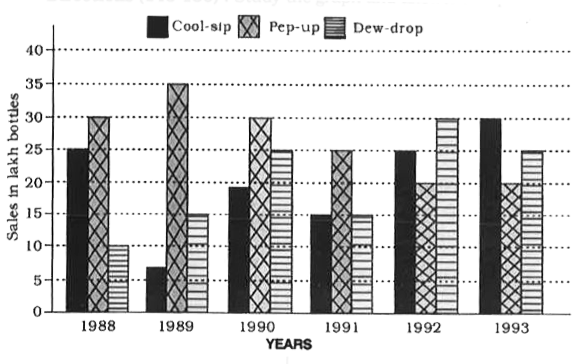
In which year the sale of coolsip is minimum?
View SolutionFollowing graph shows the income of a company in six different years. Study the graph , carefully and answer the questions that follow.
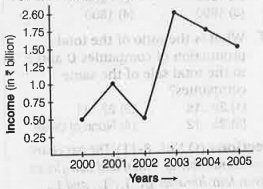
In which year income of the company is the highest?
View SolutionStudy the graph and answer the questions.
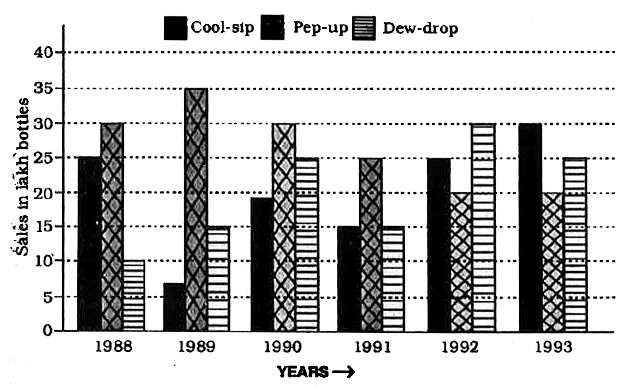
In which year the sale of cool-sip is minimum ?
View SolutionThe line chart given below shows the sales (in crores) of a company for the years 2009 to 2016
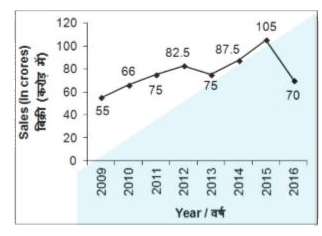
What is the average sale of the company from year 2009 to 2015?
View Solution

