Draw the graph of y=sinxcos2xSolution in Bengali
Video Solution
Text Solution
We have y=f(x)=sinxcos2x
Clearly, the domain of f(x) is R.
Also the period of f(x) is R.
Let us first draw the graph of y=f(x) for 0≤x≤2π
f(x)=0∴sinx=0 or cos2x=0
∴x=0,π,2π or x=π/2,3π/2
f(x)>0, for x∈(0,π) and f(x)<0, for x∈(π,2π)
Now f′(x)=cosxcos2x+sinx(−2sinxcosx)
=cosx(cos2x−2sin2x)
f′(x)=0∴cosx=0 or tan2x=1/2
∴x=π2,3π2 or x=tan−11√2,π−tan−11√2,π+tan−11√2,2π−tan−11√2
Now we can draw the graph of y=f(x) for x∈(0,π)
For x∈(π,2π), we reflect the graph of y=f(x) for x∈(0,π) in the x-axis as f(π−x)=−f(π+x)
f(tan−11√2)=f(π−tan−11√2)=23√3
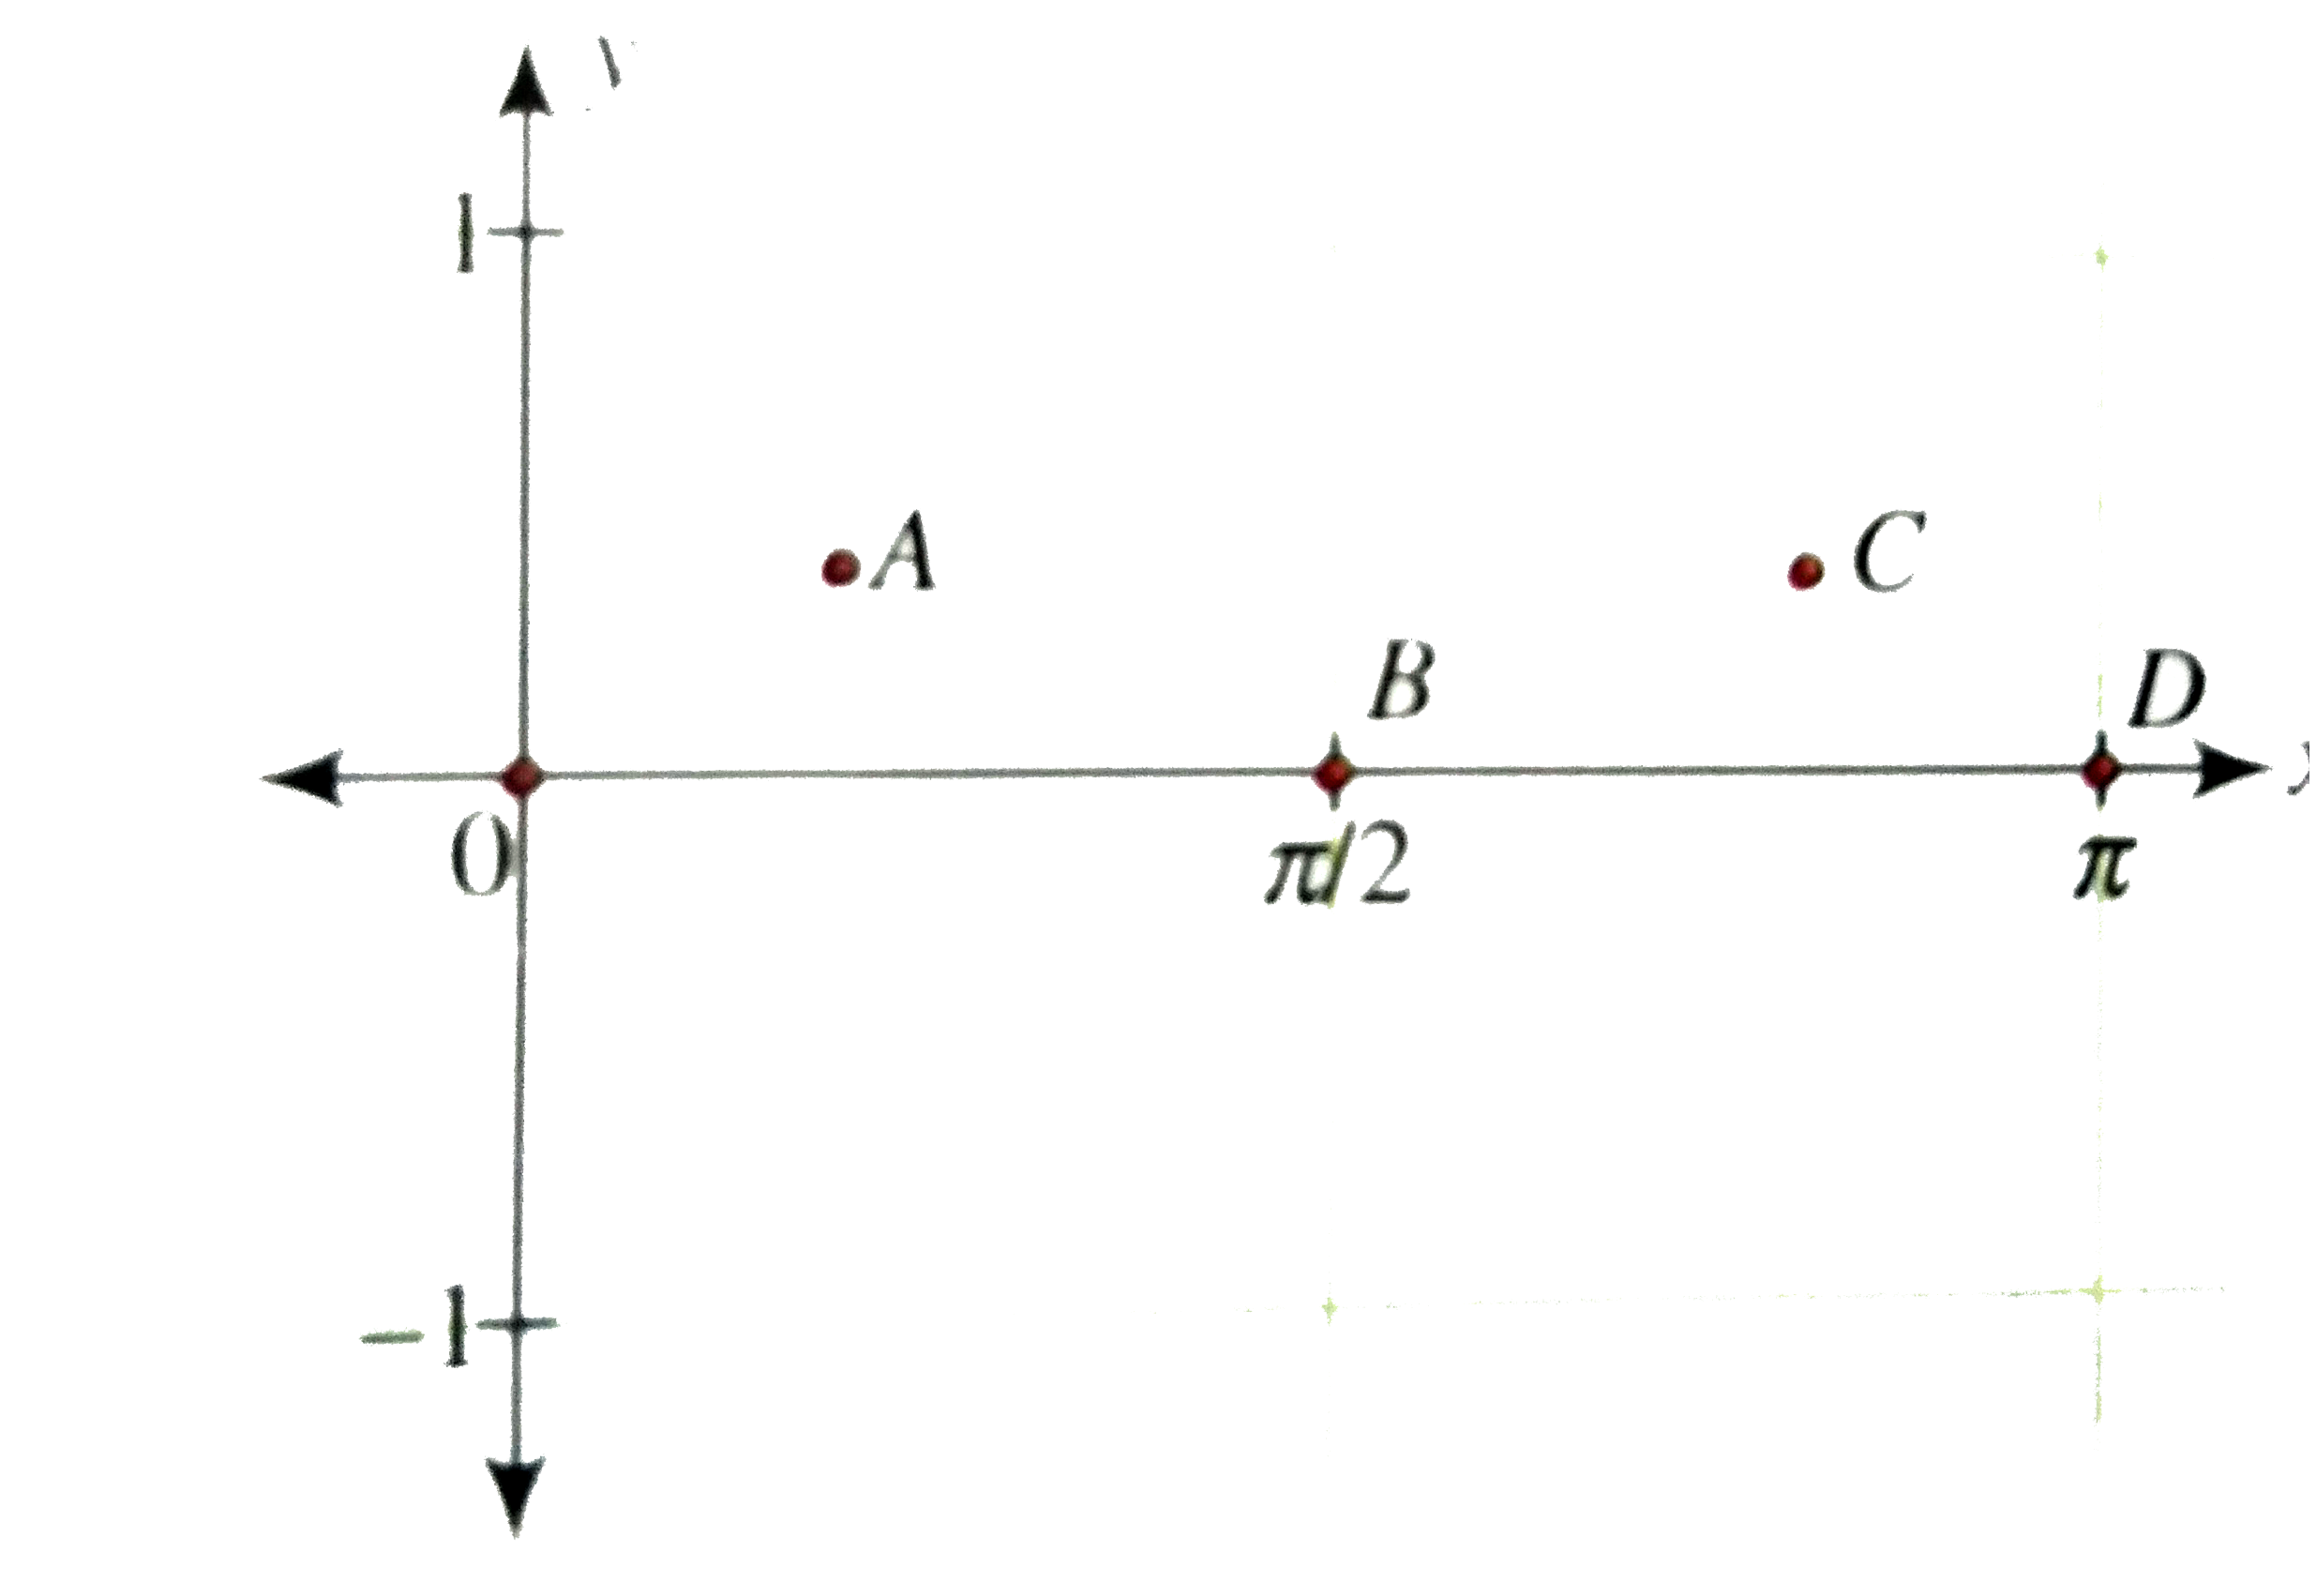
From the above discussion, we have, following important points on graph paper.

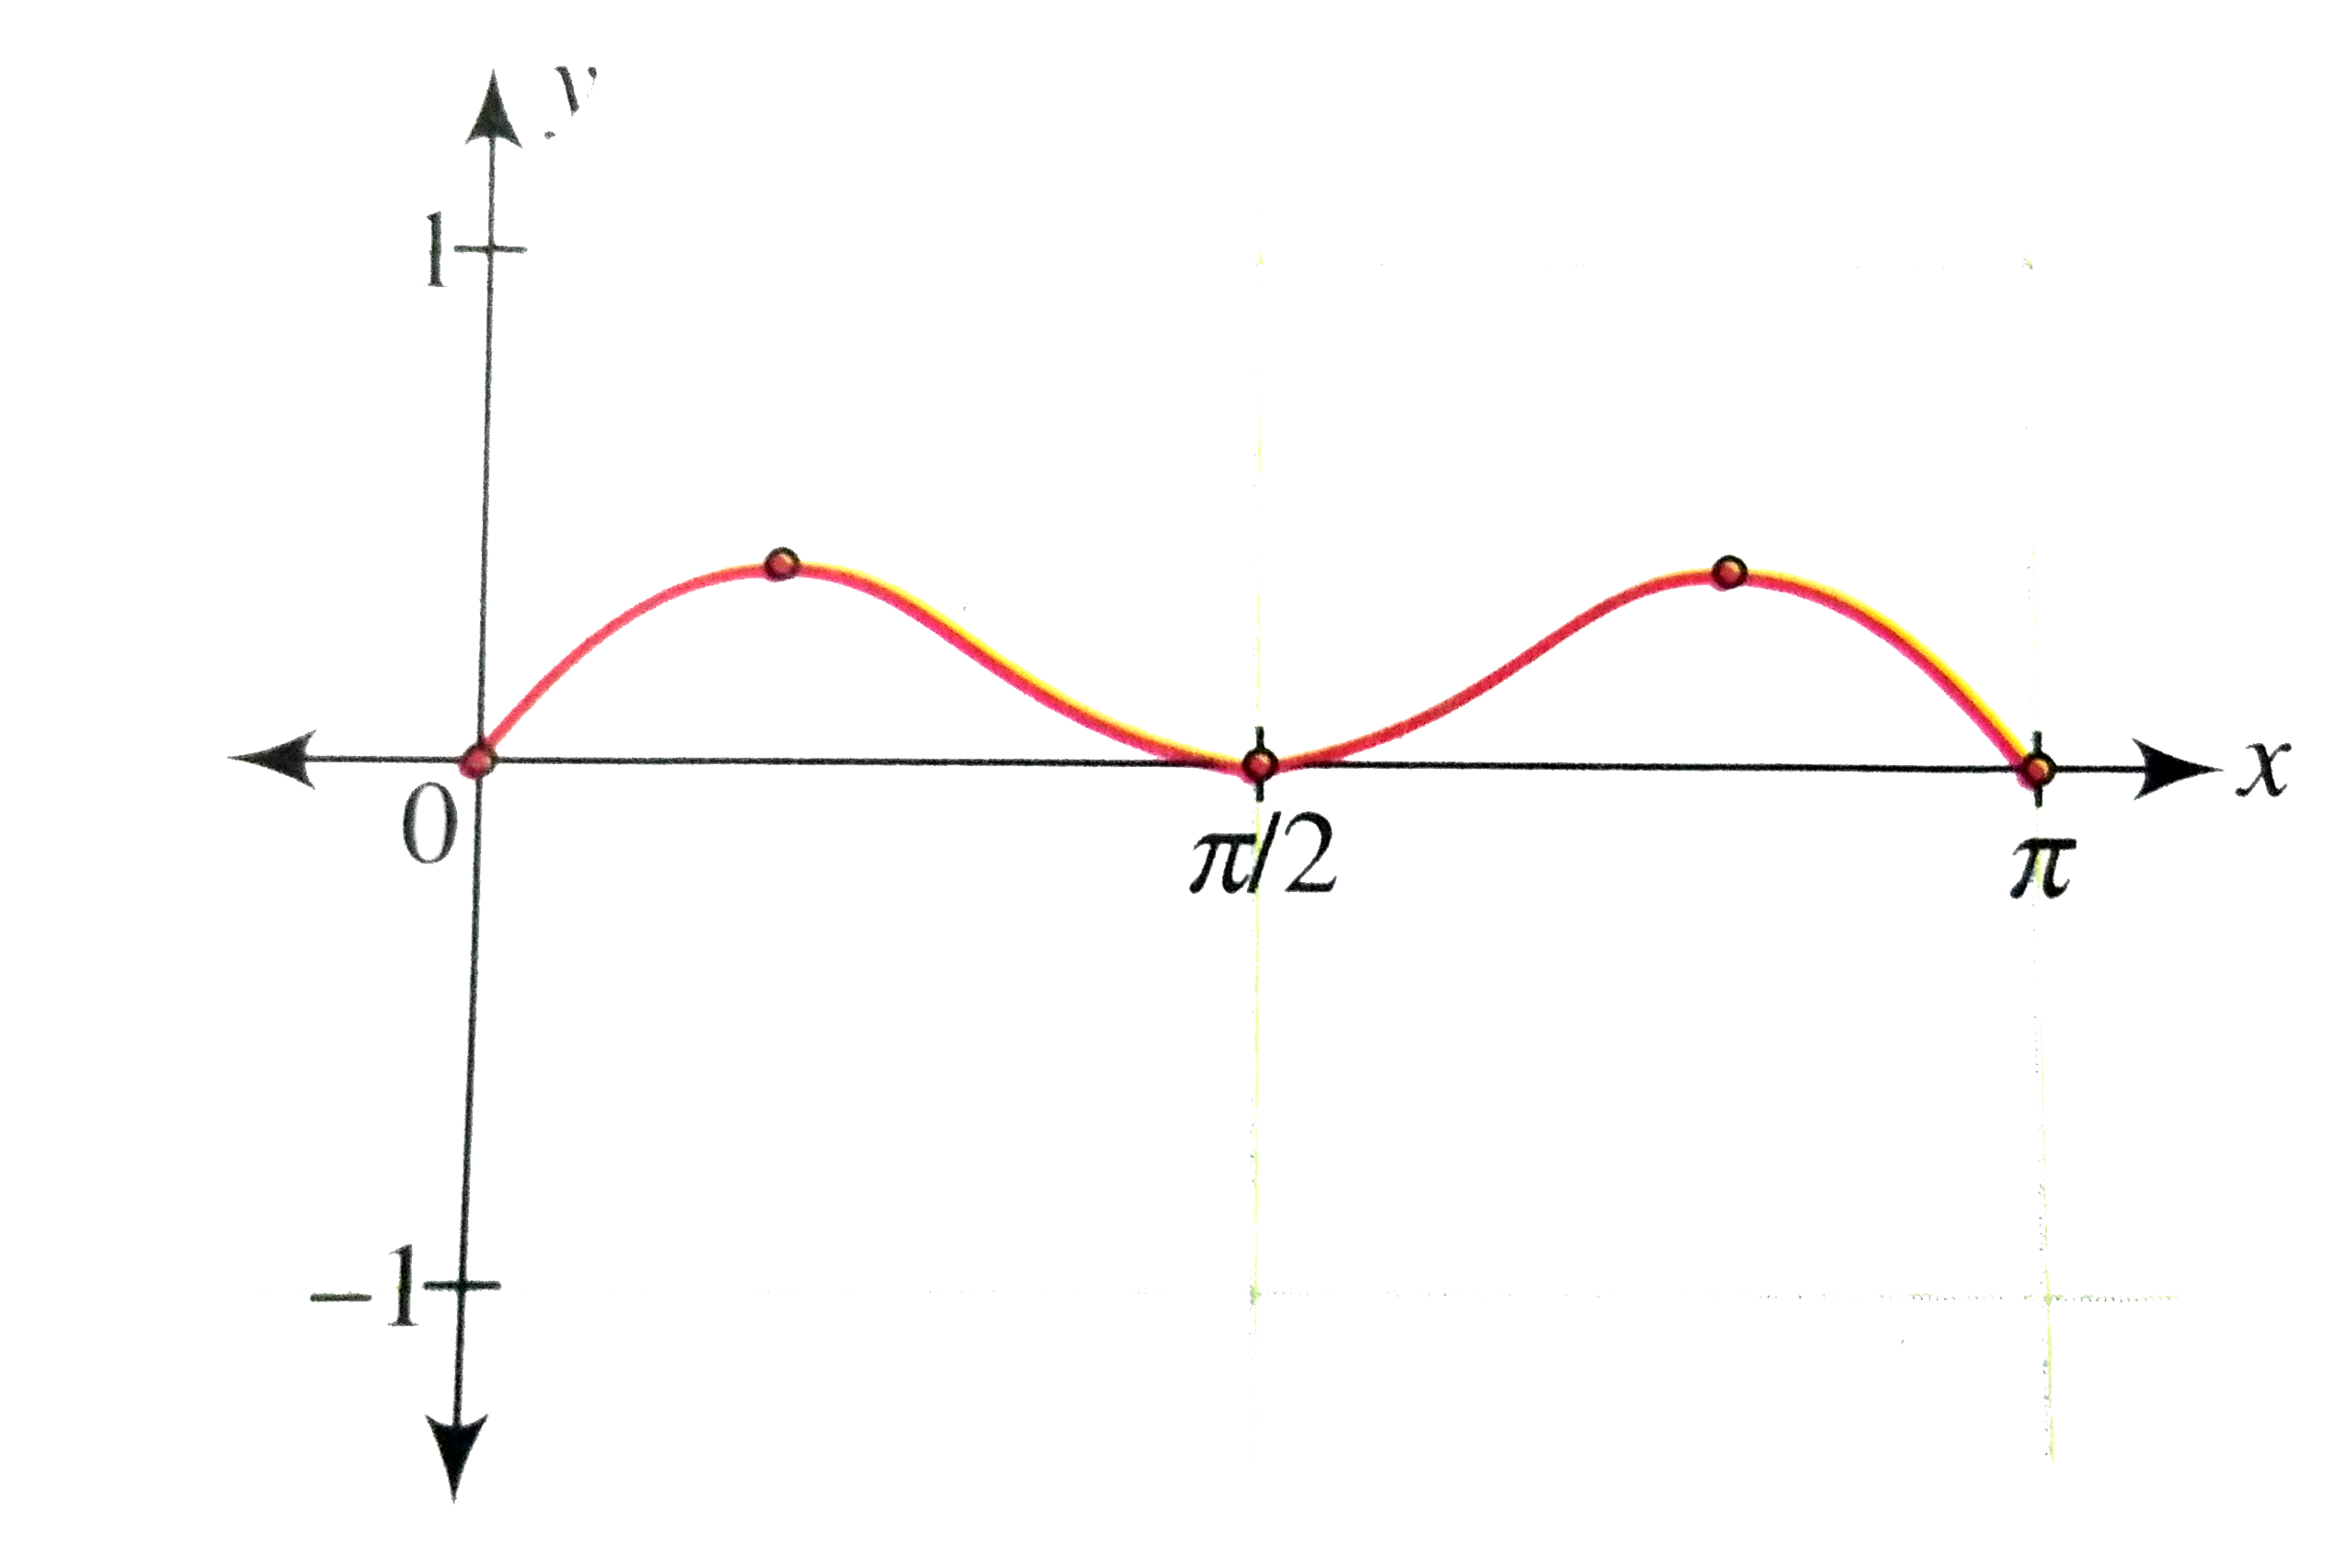
f(x) increases from O to A, decreases from A to B, increases from B to C, decreases from C to D.
Hence the graph of y=f(x) for 0<x<π is as shown in the following figure.

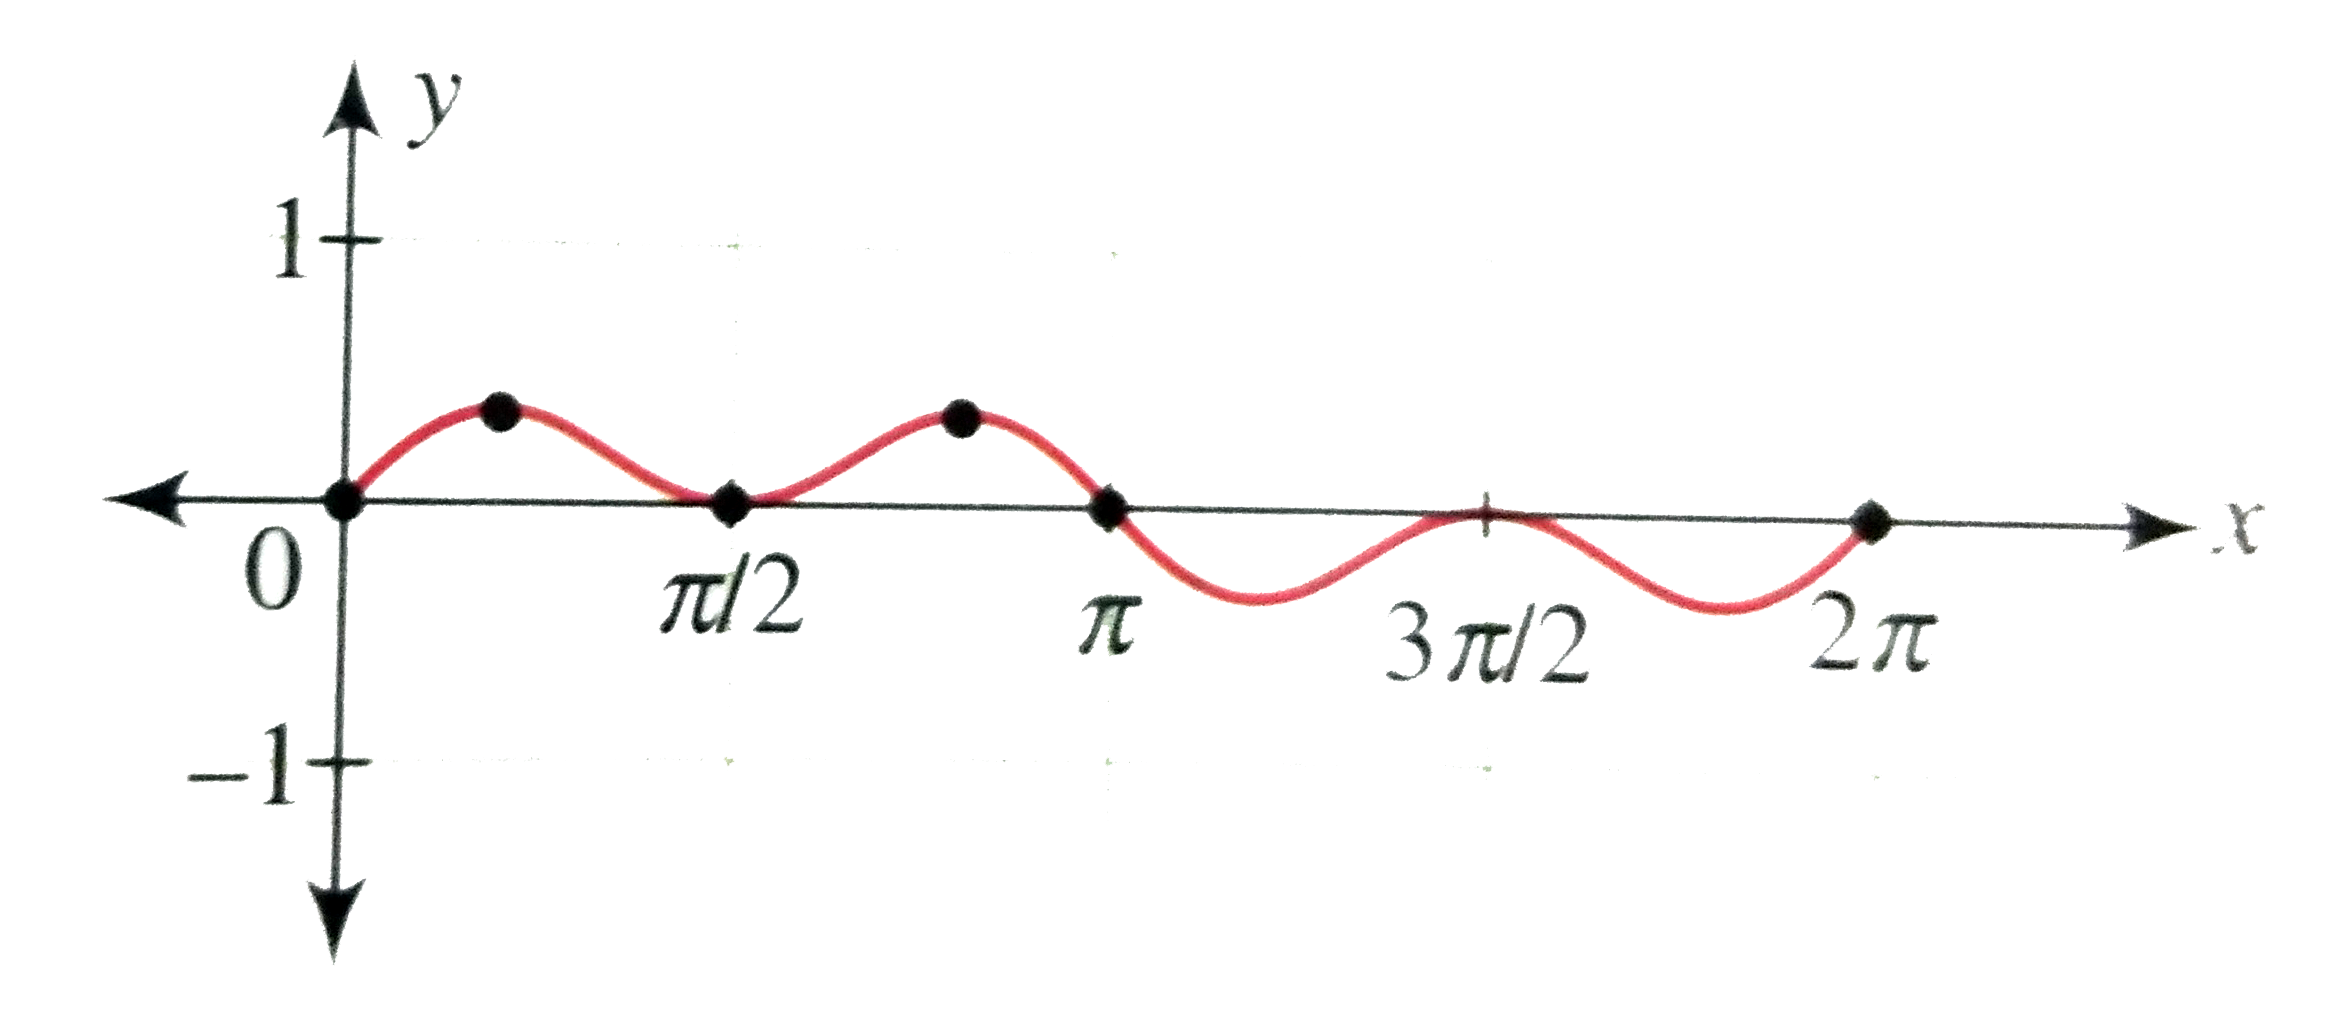
For π<x<2π, the graph of y=f(x) lies below the x-axis.
Hence, the graph of y=f(x) for π<x<2π is as shown in the following figure.

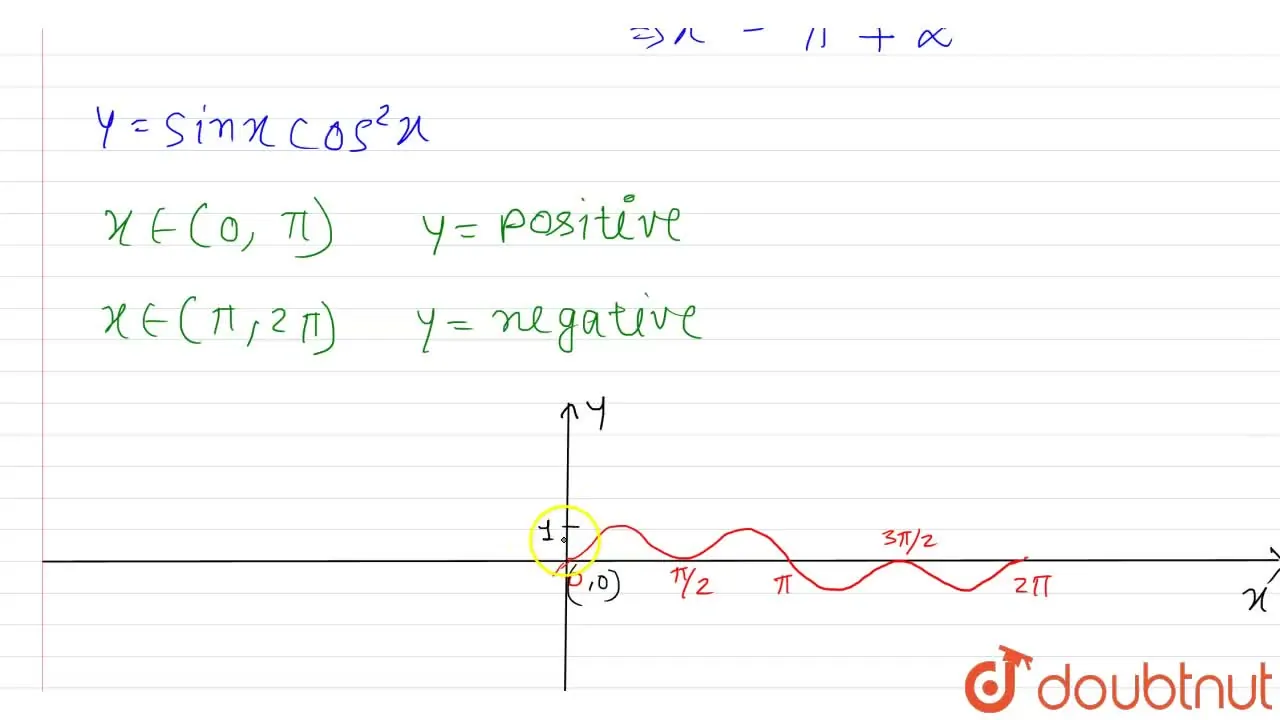
Since the period of f(x) is 2π, the graph for R is as follows:

|
Updated on:21/07/2023
Related Playlists
Similar Questions
Find the derivative of y=sin2x−cosx
01:43View SolutionLet →a and →b be two vectors of equal magnitude 5 units. Let →p,→q be vectors such that →p=→a−→b and →q=→a+→b. If |→p×→q|=2{λ−(→a.→b)2}12, then value of λ is
04:04View SolutionLet f be a non-negative function defined on the interval [0,1]. If ∫x0√1−(f′(t))2dt=∫x0f(t)dt,0≤x≤1,and f(0)=0, then
04:01View SolutionDraw the graph of y≤x+2.
01:33View SolutionDraw graph of y=2^(x)-2^(-x)
View SolutionDraw the graph of y=|x|+2
03:53View SolutionDraw the graph of y=2−x.
02:41View SolutionDraw the graph of y=|||x|−2|−3| by transforming the graph of y=|x|
03:11View SolutionDraw the graph of y=sinxcos2x
09:21View SolutionDraw the graph of y=2−x.
07:15View SolutionDraw the graph of y=2(|x|+x)x.
03:30View SolutionDraw the graph of y=|||x|−2|−3| by transforming the graph of y=|x|
04:15View SolutionDraw the graph of y=sinxcos2x
02:01View SolutionDraw the graph of y=|x|+2
01:28View SolutionDraw the graph of x + y = 2
04:08View SolutionDraw the graph x+ y = 2
04:26View Solution


