Directions (Questions 11-15): Study the following bar graph and the table carefully and answer the questions given below: Time Taken (in Hours) by 6 Vehicles on Two Different Days (FIGURE) Distance Covered (in km) by 6 Vehicles on Each day (FIGURE) Which of the following vehicles travelled at the same speed on both the days? A (b) C (c) F (d) B (e) None of these
Step by step video & image solution for Directions (Questions 11-15): Study the following bar graph and the table carefully and answer the questions given below: Time Taken (in Hours) by 6 Vehicles on Two Different Days (FIGURE) Distance Covered (in km) by 6 Vehicles on Each day (FIGURE) Which of the following vehicles travelled at the same speed on both the days? A (b) C (c) F (d) B (e) None of these by Maths experts to help you in doubts & scoring excellent marks in Class 14 exams.
Topper's Solved these Questions
Similar Questions
Direction: Read the following table carefully and answer the questions given below: The given table shows the number of boys and girls in 5 different school:
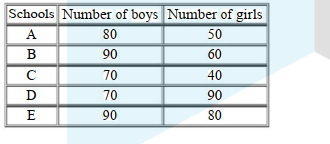
Find the average number of girls in schools B,C, and EView SolutionDirection: Read the following table carefully and answer the questions given below:- The given the table is showing the number of students in different school:-
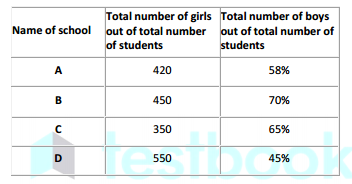
Find the average number of girls in schools B, C, and D.View Solution
Knowledge Check
- Question 1 - Select One
Study the following table carefully and answer the questions given below :
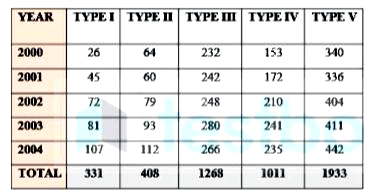
The percentage increase in sales in 2003 over the previous year was maximum for which Type of vehiclesAType IIBType ICType IIIDType V - Question 2 - Select One
Study the following graph carefully and answer the questions given below
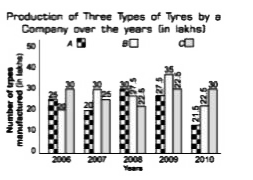
In which of the following years, was the percentage production of B type to C type the maximum?A2008B2009C2010D2007 - Question 3 - Select One
Study the following table carefully and answer the questions given below:
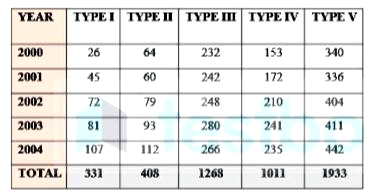
In which of the following years was the Sales of Type II vehicles approximated 25% of the Type V vehicles?A2000B2002C2004D2003
Study the following graph carefully and answer the question given below it.
Production and sale of printers of various companies in a month.
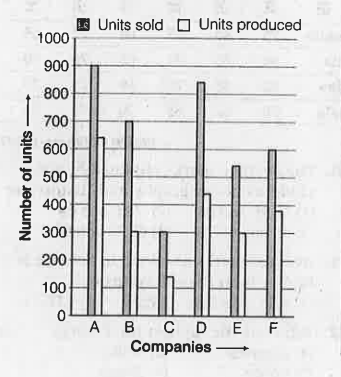
The total produced by the companies A B and C together isView SolutionStudy the following information carefully and answer the questions given below:
* D is the mother of E, who is the sister of F.
* A is the father of C. B is wife of A.
* F is son of C.
How is B related to D?View SolutionStudy the following information carefully and answer the questions given below:
* D is the mother of E, who is the sister of F.
* A is the father of C. B is wife of A.
* F is son of C.
How is E related to A?View SolutionStudy the following table carefully and answer the questions given below:
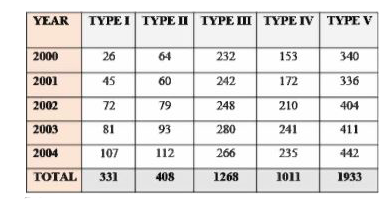
If the same percentage increase in the sales of Type I vehicles in 2004 over 2003 is expected in 2005, approximatdy how many Type I vehicles will be sold in 2005?View SolutionStudy the following figure and answer the questions given below.
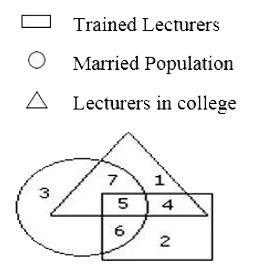
By which number, the trained unmarried lecturers in the college are represented?
A. 6
B. 5
C. 7
D. 4View Solution
