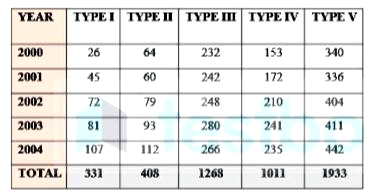
Study the following table carefully and answer the questions given below:
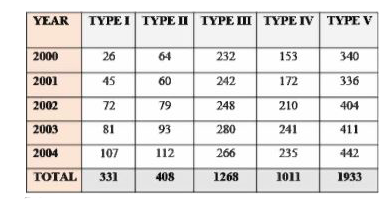
If the same percentage increase in the sales of Type I vehicles in 2004 over 2003 is expected in 2005, approximatdy how many Type I vehicles will be sold in 2005?
141
139
144
131
The correct Answer is:A
Step by step video, text & image solution for Study the following table carefully and answer the questions given below: If the same percentage increase in the sales of Type I vehicles in 2004 over 2003 is expected in 2005, approximatdy how many Type I vehicles will be sold in 2005? by Reasoning experts to help you in doubts & scoring excellent marks in Class 14 exams.
Updated on:21/07/2023Similar Questions
Study the following table carefully and answer the questions given below it-
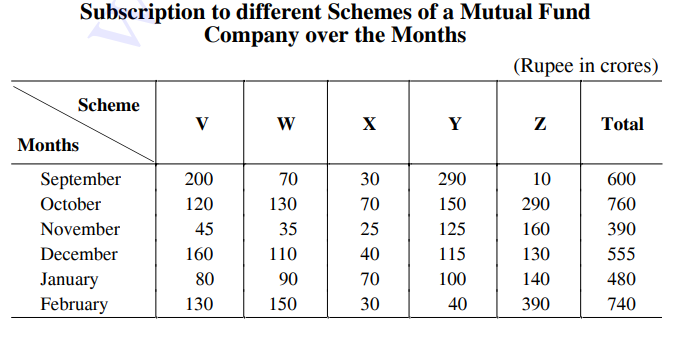
What is the percentage increase in the subscription to Z scheme from January to February ?
View SolutionStudy the following table carefully and answer the questions given below.
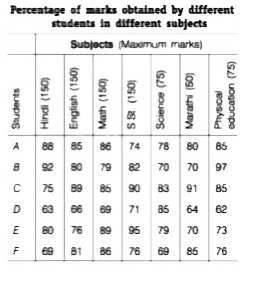
How many marks did E get in all the subjects together?
View Solution
Knowledge Check
Study the following table carefully and answer the questions given below-

Who amongst them secured highest percentage of marks?AChiragBEhsanCAmitDBhavnaStudy the following graph carefully and answer the questions given below it -----
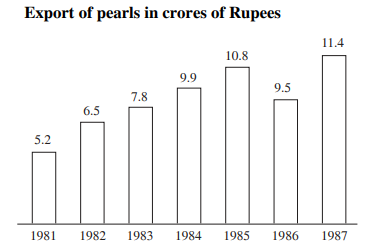
What was the percentage increase in export from 1986 to 1987 ?A1623%B20%C19%D3313%Study the following graph carefully and answer the question given below-----
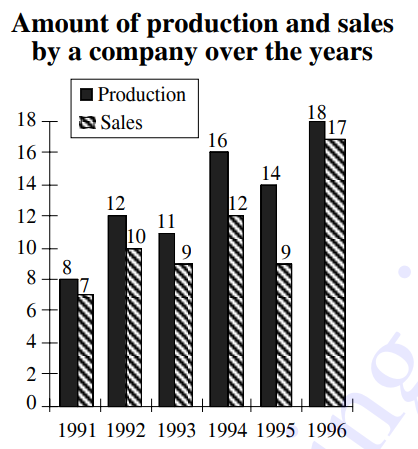
What was the percentage drop in sales from 1992 to 1993 ?A1B10C20D15
Study the following table carefully and answer the questions given below :
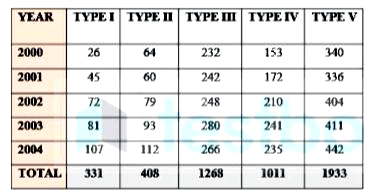
The percentage increase in sales in 2003 over the previous year was maximum for which Type of vehicles
View SolutionStudy the following table carefully and answer the questions given below:
In which of the following years was the Sales of Type II vehicles approximated 25% of the Type V vehicles?
View SolutionStudy the following Pie-Chart carefully to answer the questions given below.
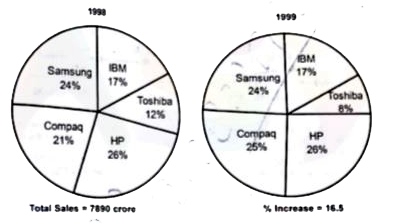
The percentage increase/decrease in the sales of Toshiba in 1999 is approximately-
View SolutionStudy the following graph carefully and answer the questions given below
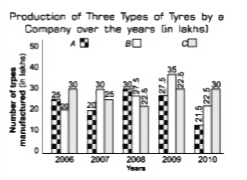
What was the percentage drop in the number of C type tyres manufactured from 2007 to 2008?
View SolutionStudy the following graph carefully and answer the question given below-----
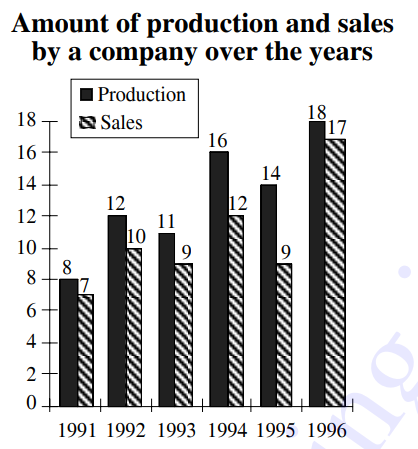
What was the difference between the sales of 1992 and 1995 ?
View Solution
