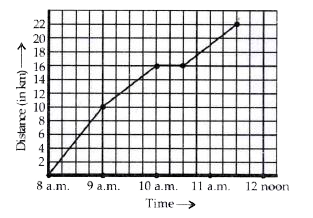
A courter-person cycles from a town to a neighbouring suburban area to deliver a parcel to a merchant. His distances from the twon at different times are shown by the given graph.
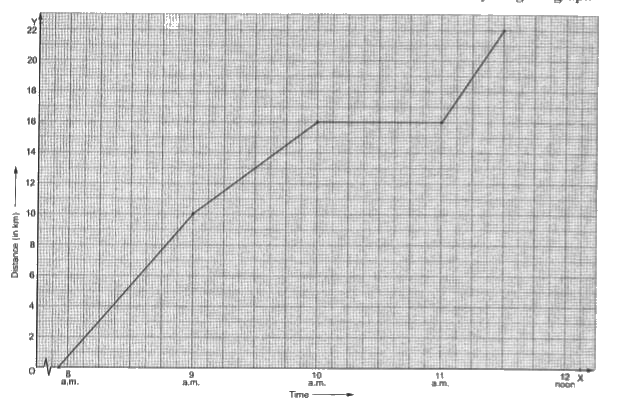
Study the above graph carefully and answer the questions given below:
(i) What is the scale taken for the time-axis?
(ii) How much time did the person take for the travel ?
(iii) How far is the place of the merchant from the town ?
(iv) Did the person stop on his way ? Explain.
(v) During which period did he ride fastest ?
The correct Answer is:(i)1 unit =15 minutes (ii) 3hr30min (iii) 22km(iv)Yes,om10a.m.→11 a.m.
Step by step video, text & image solution for A courter-person cycles from a town to a neighbouring suburban area to deliver a parcel to a merchant. His distances from the twon at different times are shown by the given graph. Study the above graph carefully and answer the questions given below: (i) What is the scale taken for the time-axis? (ii) How much time did the person take for the travel ? (iii) How far is the place of the merchant from the town ? (iv) Did the person stop on his way ? Explain. (v) During which period did he ride fastest ? by Maths experts to help you in doubts & scoring excellent marks in Class 8 exams.
Related Playlists
- BOOK - RS AGGARWALCHAPTER - LINE GRAPHS AND LINEAR GRAPHSEXERCISE - Exercise 2325videos
LINE GRAPHS AND LINEAR GRAPHS
- BOOK - RS AGGARWALCHAPTER - INTRODUCTION TO COORDINATE GEOMETRYEXERCISE - EXERCISE B (OBJECTIVE QUESTIONS)7videos
INTRODUCTION TO COORDINATE GEOMETRY
- BOOK - RS AGGARWALCHAPTER - LINEAR EQUATIONSEXERCISE - TEST PAPER-8 (D) (Write .T. for true and .F. for false for each of the following:)1videos
LINEAR EQUATIONS
Similar Practice Problems
- Question 1 - Select One
Study the following graph carefully and answer the question given below-----
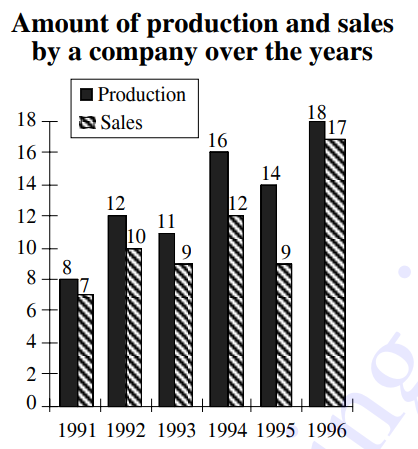
What was the percentage drop in sales from 1992 to 1993 ?A1B10C20D15 - Question 1 - Select One
Study the following graph carefully and answer the question given below-----
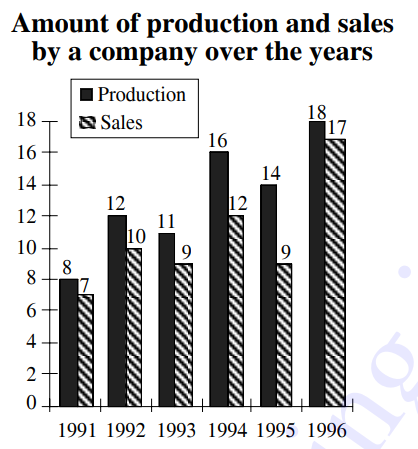
What was the difference between the sales of 1992 and 1995 ?A10 lakh tonnesB50 thousand tonnesC1 lakh tonnesD75 thousand tonnes - Question 1 - Select One
Study the following graph carefully and answer the questions given below it -----
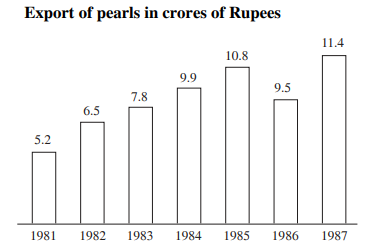
What was the percentage increase in export from 1986 to 1987 ?A1623%B20%C19%D3313% - Question 1 - Select One
Study the following graph carefully and answer the questions given below it -----
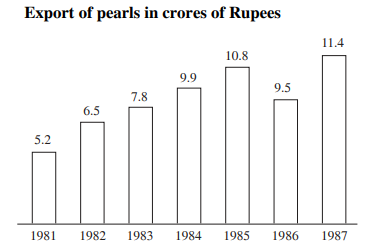
In how many years was the export above the average for the given period ?A2B3C4D5 - Question 1 - Select One
Study the following graph carefully and answer the questions given below
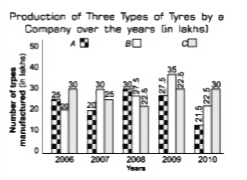
What was the percentage drop in the number of C type tyres manufactured from 2007 to 2008?A25%B10%C15%D2.5% - Question 1 - Select One
The following bar graph shows the games played by the students. Study the graph carefully and answer the question given below:
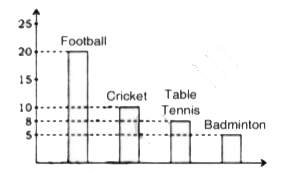
How many students play table tennis?A10B8C18D20
Similar Questions
A courier-person cycles from a town to a neighboring suburban area to deliver a parcel to a merchant. His distance from the town at different times is shown by the following graph.
(a) What is the scale taken for the time axis?
(b) How much time did the person take for the travel?
(c) How far is the place of the merchant from the town?
(d) Did the person stop on his way? Explain.
(e) During which period did he ride fastest?
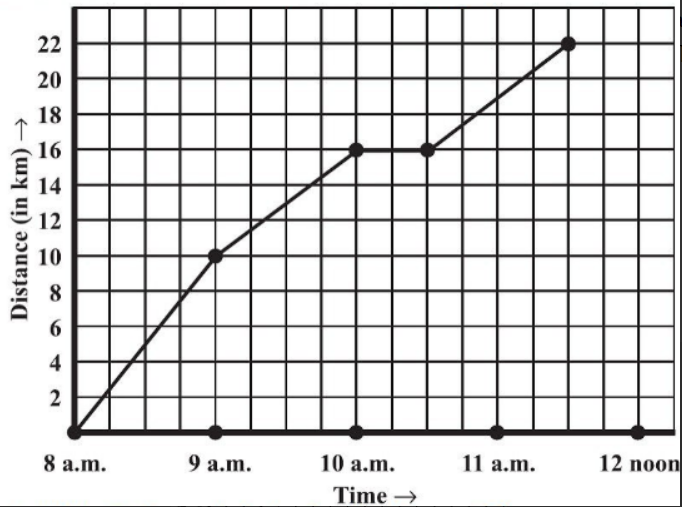 View Solution
A courier- person cycles from a town to a neighbouring suburban area to deliver a parcel to a merchant. His distance from the town at different times is shown by the following graph.
(a) What is the scale taken for the time axis? (b) How much time did the person take for the travel? (c) How far is the place of the merchant from the town? (d) Did the person stop on his way? Explain. (e) During which period did he ride fastest?
 View Solution
Read the following graph carefully and answer the questions given below:
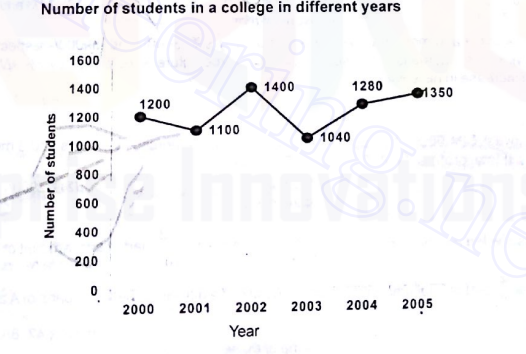
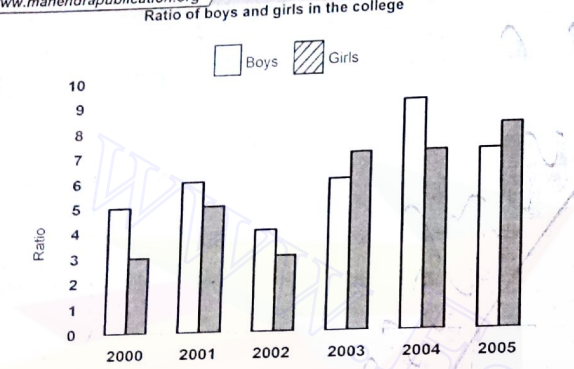
What is the difference between the number of boys and girls in the year 2004 ?View SolutionStudy the following graph carefully and answer the given questions.
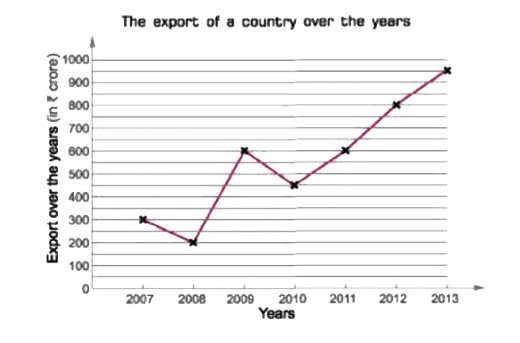
What is the total exports ( in ? Crore) for the given years ?View Solution

