A car is travelling from city P to city Q which are 350 km apart. The line graph given below describes the distances of the car from the city P at different times .
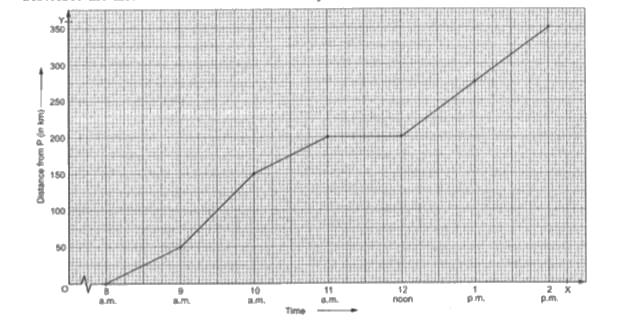
Study the above graph and answer the questions given below.
(i) What information is given on the two axes ?
(ii) From where and when did the car begin its journey ?
(iii) How far did the car go in the first hour ?
(iv) How far did the car go during (a) the 2nd hour and (b) the 3rd hour?
(v) Was the speed same during first three hours? How do you know it ?
(vi) Did the car stop for some duration at any place ? Justify your answer.
(vii) When did the car reach city Q ?
The correct Answer is:(i) The x-axis shows the time and the y-axis shows the distance of the car from city P.
(ii) From city P, at 8 a.m.
(iii)50km
(iv)(a)100km (b)50km
(v) No. because the distance covered per hour is not uniform.
(vi) Yes, the car stopped during the interval 11 a.m. to 12 noon , as is indicated by the horizontal line segment during this period.
(vii)2 p.m.
Step by step video, text & image solution for A car is travelling from city P to city Q which are 350 km apart. The line graph given below describes the distances of the car from the city P at different times . Study the above graph and answer the questions given below. (i) What information is given on the two axes ? (ii) From where and when did the car begin its journey ? (iii) How far did the car go in the first hour ? (iv) How far did the car go during (a) the 2nd hour and (b) the 3rd hour? (v) Was the speed same during first three hours? How do you know it ? (vi) Did the car stop for some duration at any place ? Justify your answer. (vii) When did the car reach city Q ? by Maths experts to help you in doubts & scoring excellent marks in Class 8 exams.
Related Playlists
- BOOK - RS AGGARWALCHAPTER - LINE GRAPHS AND LINEAR GRAPHSEXERCISE - Exercise 2325videos
LINE GRAPHS AND LINEAR GRAPHS
- BOOK - RS AGGARWALCHAPTER - INTRODUCTION TO COORDINATE GEOMETRYEXERCISE - EXERCISE B (OBJECTIVE QUESTIONS)7videos
INTRODUCTION TO COORDINATE GEOMETRY
- BOOK - RS AGGARWALCHAPTER - LINEAR EQUATIONSEXERCISE - TEST PAPER-8 (D) (Write .T. for true and .F. for false for each of the following:)1videos
LINEAR EQUATIONS
Similar Practice Problems
- Question 1 - Select One
The graph given here shows a car following the linear path with uniform speed. Study the graph and answer the questions.
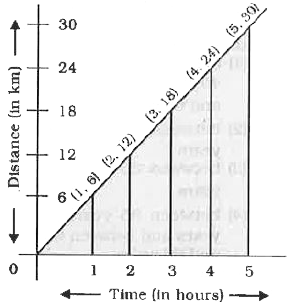
The speed of the car isA12 km/hrB6 km/hrC18 km/hrD24 km/hr - Question 1 - Select One
Study the following graph carefully and answer the question given below-----
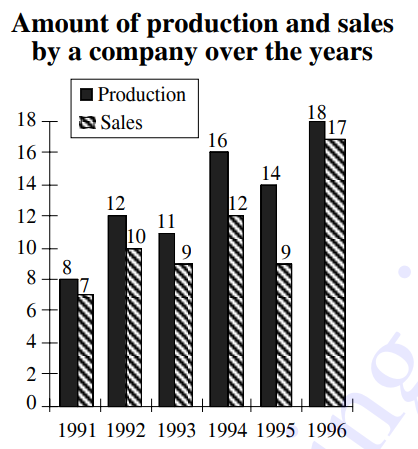
What was the percentage drop in sales from 1992 to 1993 ?A1B10C20D15 - Question 1 - Select One
The graph given here shows a car following the linear path with uniform speed. Study the graph and answer the questions.
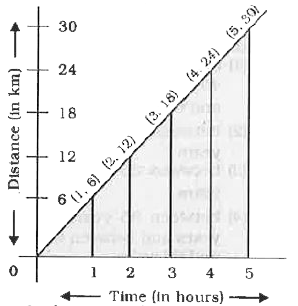
The distance travelled by the car in 4.5 hours isA27 kmB30 kmC36 kmD40 km
Similar Questions
The given graph (Fig 15.8) describes the distances of a car from a city P at different times when it is travelling from City P to City Q, which are 350 km apart. Study the graph and answer the following:(i) What information is given on the two axes?(ii) From where and when did the car begin its journey?(iii) How far did the car go in the first hour?(iv) How far did the car go during (i) the 2nd hour? (ii) the 3rd hour?(v) Was the speed same during the first three hours? How do you know it?(vi) Did the car stop for some duration at any place? Justify your answer.(vii) When did the car reach City Q?
 View Solution
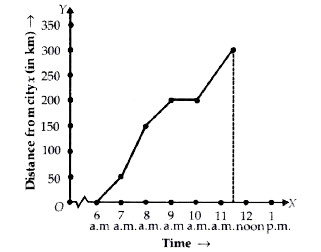
The given graph describes the distances of a car from a city X at different times when it is travelling from City X to City Y, which are 300 km apart. Study the graph and answer the following:
(i) What information is given on the two axes?
(ii) From where and at what time did the car begin its journey?
(iii) How far did the car go in the first hours?
(iv) Did the car stop for some duration at any place? Justify your answer
(v) Was the speed same during the first three hours? How do you know it?
(vi) When did the car reach City Y?
 View Solution
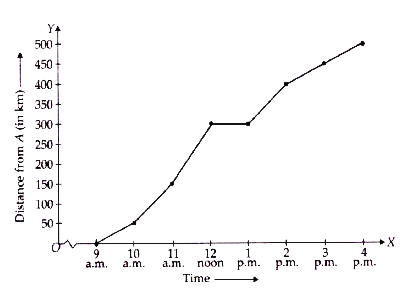
The given line graph shows the distance travelled by a motorcyclist from a city A to B at different times. These two cities are 500 km apart. Study the graph and answer the following:
(i) What information is given on the two axes?
(ii) From where and when did the motorcyclist begin its journey?
(iii) How far did the motorcyclist go in the first hour?
(iv) How far did the motorcyclist go during 3rd hour?
(v) When did the motorcyclist reach city B?
 View Solution
Read the bar graph given below and answer the following questions:
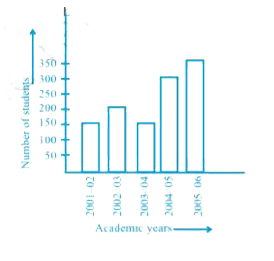
What information is given by the þar graph?View SolutionStudy the following graph and answer the questions given below it.
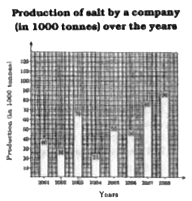
What was the percentage decline in the product of salt from 2003 to 2004 ?View SolutionThe following graph shows the sales of cars (in thousands) in four cities in 4 years. Study the graph and answer the question.
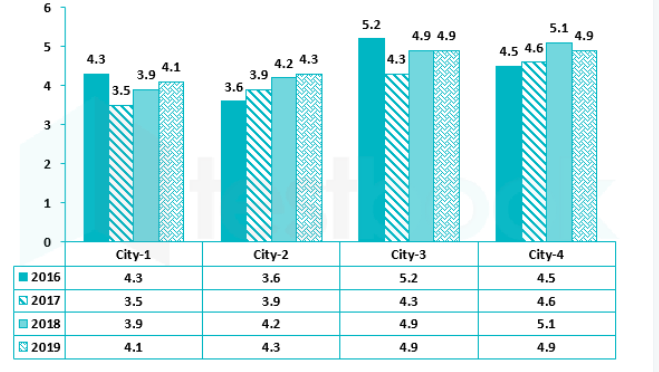
Which city has the highest sales?View SolutionThe following graph shows the sales of cars (in thousands) in four cities in 4 years. Study the graph and answer the question
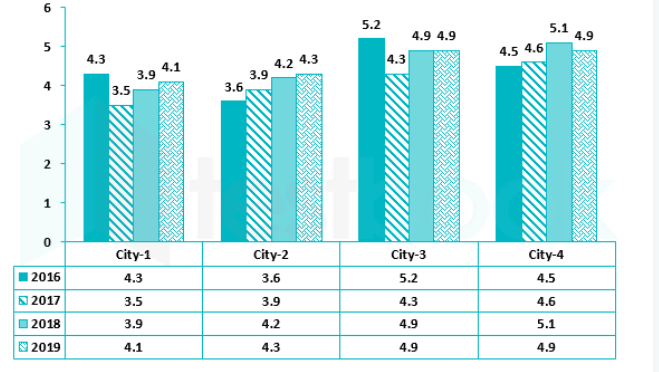
In which year. the sales are highest?View Solution

