The given figure shows the diagram for a Camot cycle. In this diagram,
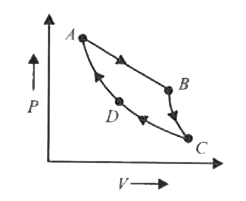
curve AB represents isothermal process and BC adiabatic process
curve AB represents adiabatic process and BC isothermal process
curve CD represents isothermal process and DA adiabatic process
curve CD represents adiabatic process and DA isothermal process.
The correct Answer is:a,c
For an adiabatic process, = constant.
Differentiating w.r.t. V , we get
For isothermal process, PV = constant
Hence,
Now dP/dV is the slope of the (P - V) graph. Thus, the slope of the (P-V ) graph for an adiabatic process is times that for an isothermal process. Hence, curves BC and DA both represent adiabatic process and curves AB and CD both represent isothermal process.
Related Playlists
- BOOK - MTG-WBJEECHAPTER - THERMODYNAMICSEXERCISE - WB JEE Previous Years Questions12videos
THERMODYNAMICS
- BOOK - MTG-WBJEECHAPTER - THERMODYNAMICSEXERCISE - WB JEE WORKOUT ( CATEGORY 2 : Single Option Correct Type (2 Mark )15videos
THERMODYNAMICS
- BOOK - MTG-WBJEECHAPTER - SOLID STATE ELECTRONS EXERCISE - WB JEE Previous Years Questions (CATEGORY 1 : Single Option Correct Type)15videos
SOLID STATE ELECTRONS
- BOOK - MTG-WBJEECHAPTER - WAVE OPTICSEXERCISE - WB JEE PREVIOUS YEARS QUESTION (MCQ.s)9videos
WAVE OPTICS
Similar Questions
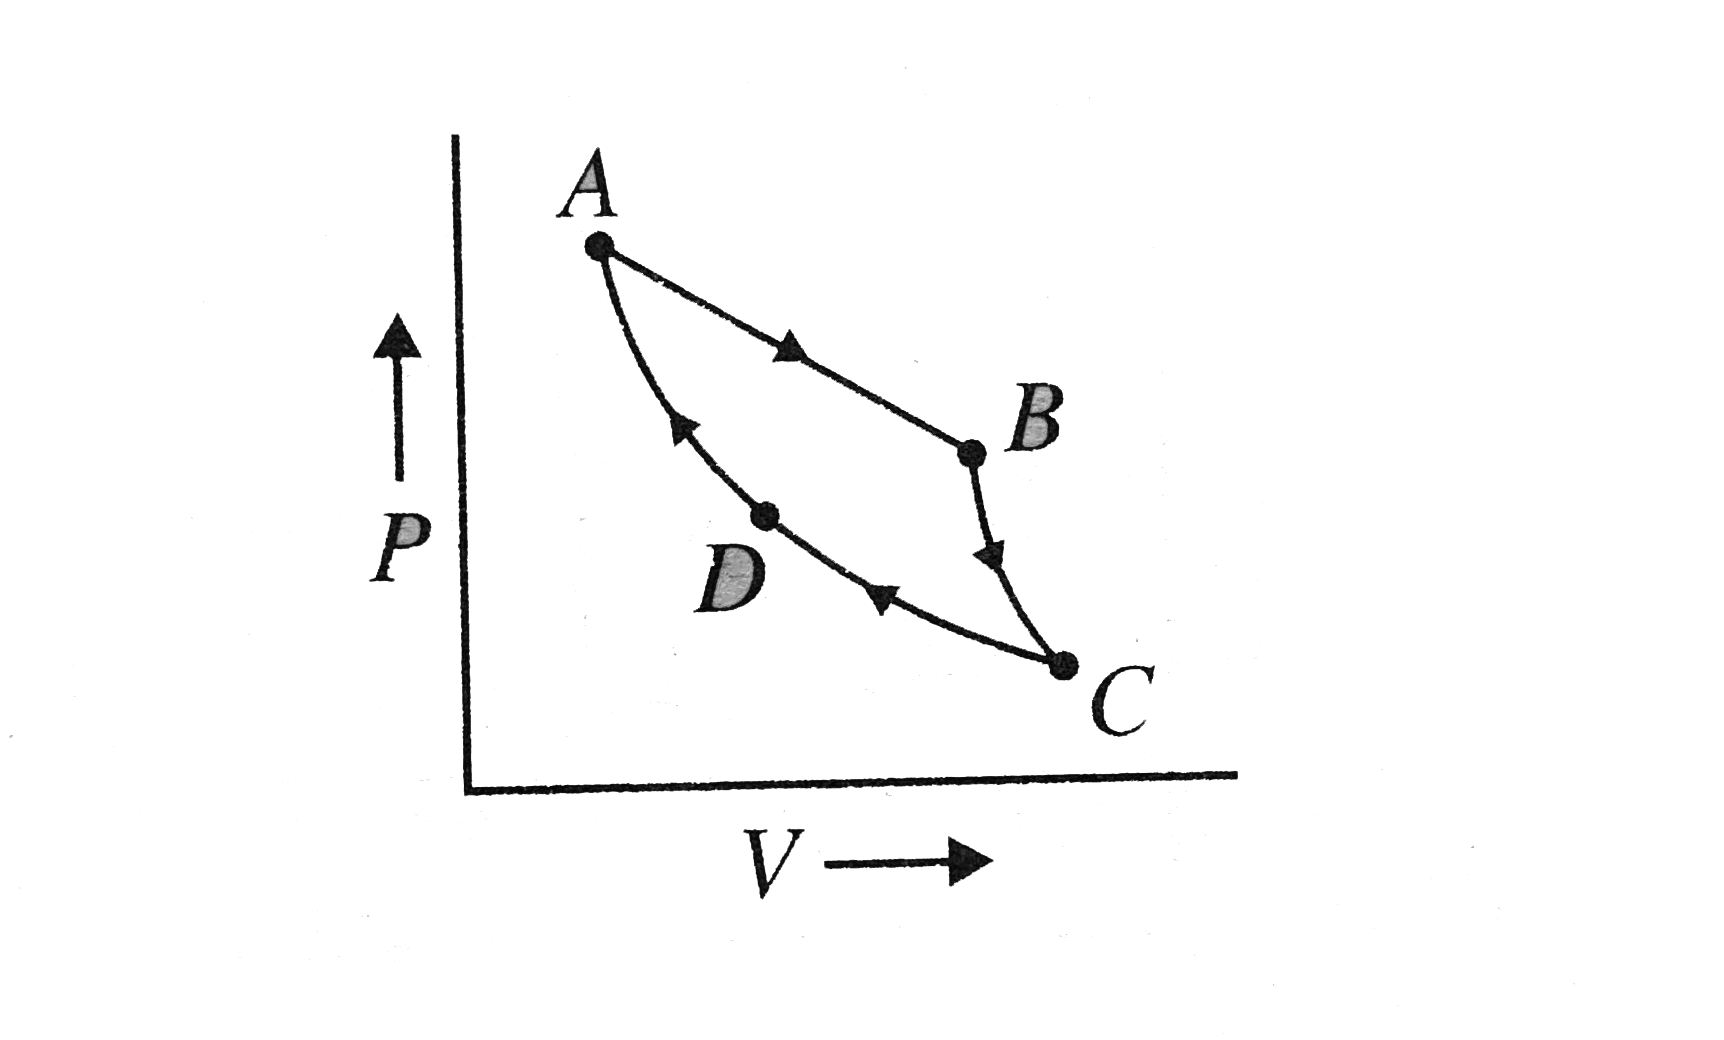
Figure. Shows the P−V diagram for a Carnot cycle. In this diagram
 View Solution
Figure. Shows the P−V diagram for a Carnot cycle. In this diagram
 View Solution
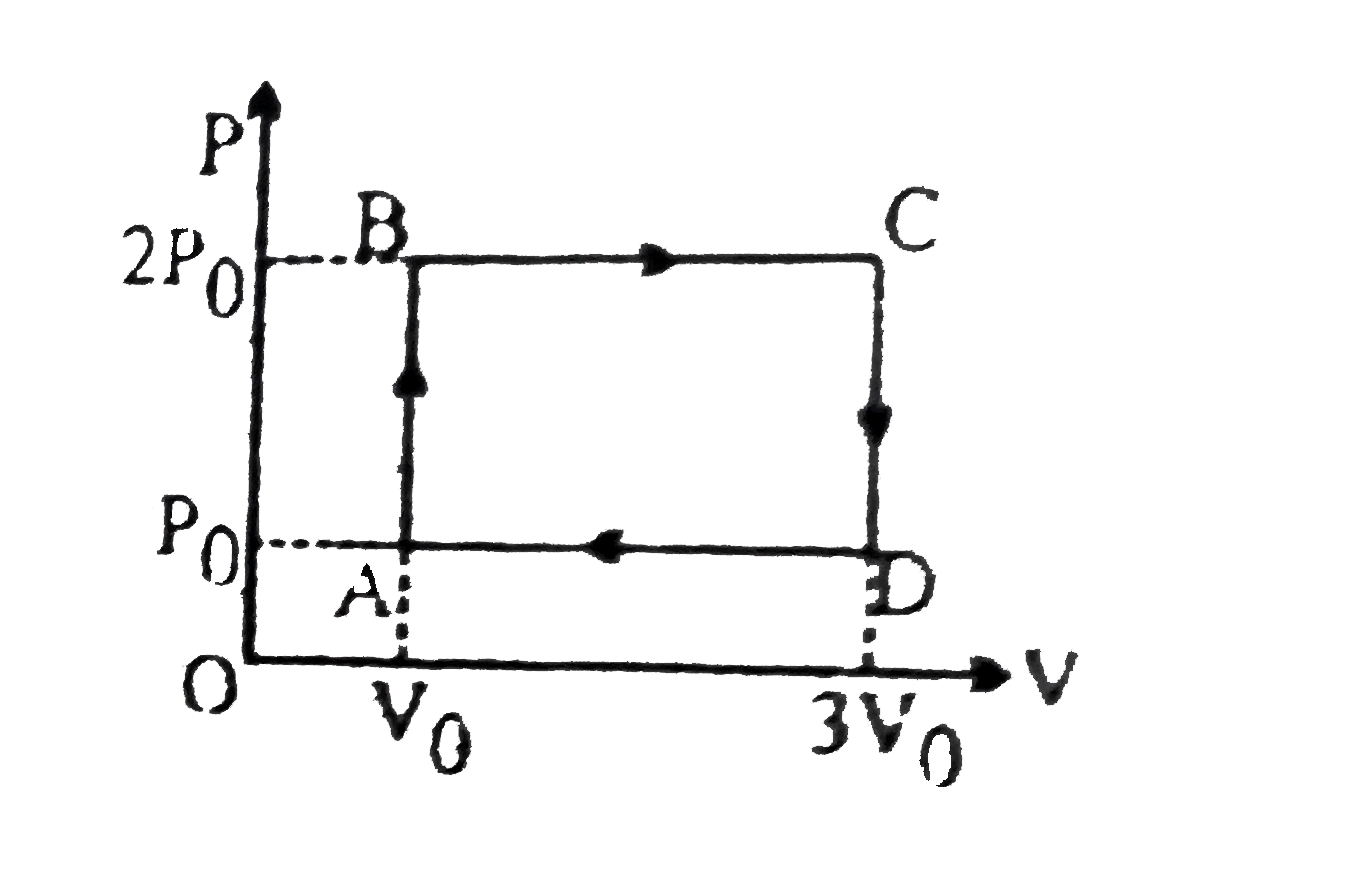
The figure shows P - V diagram of a thermodynamic cycle
Identify the diagram which correctly represents the heat inflow and outflow of the systemView SolutionShow diagram for carbon cycle .
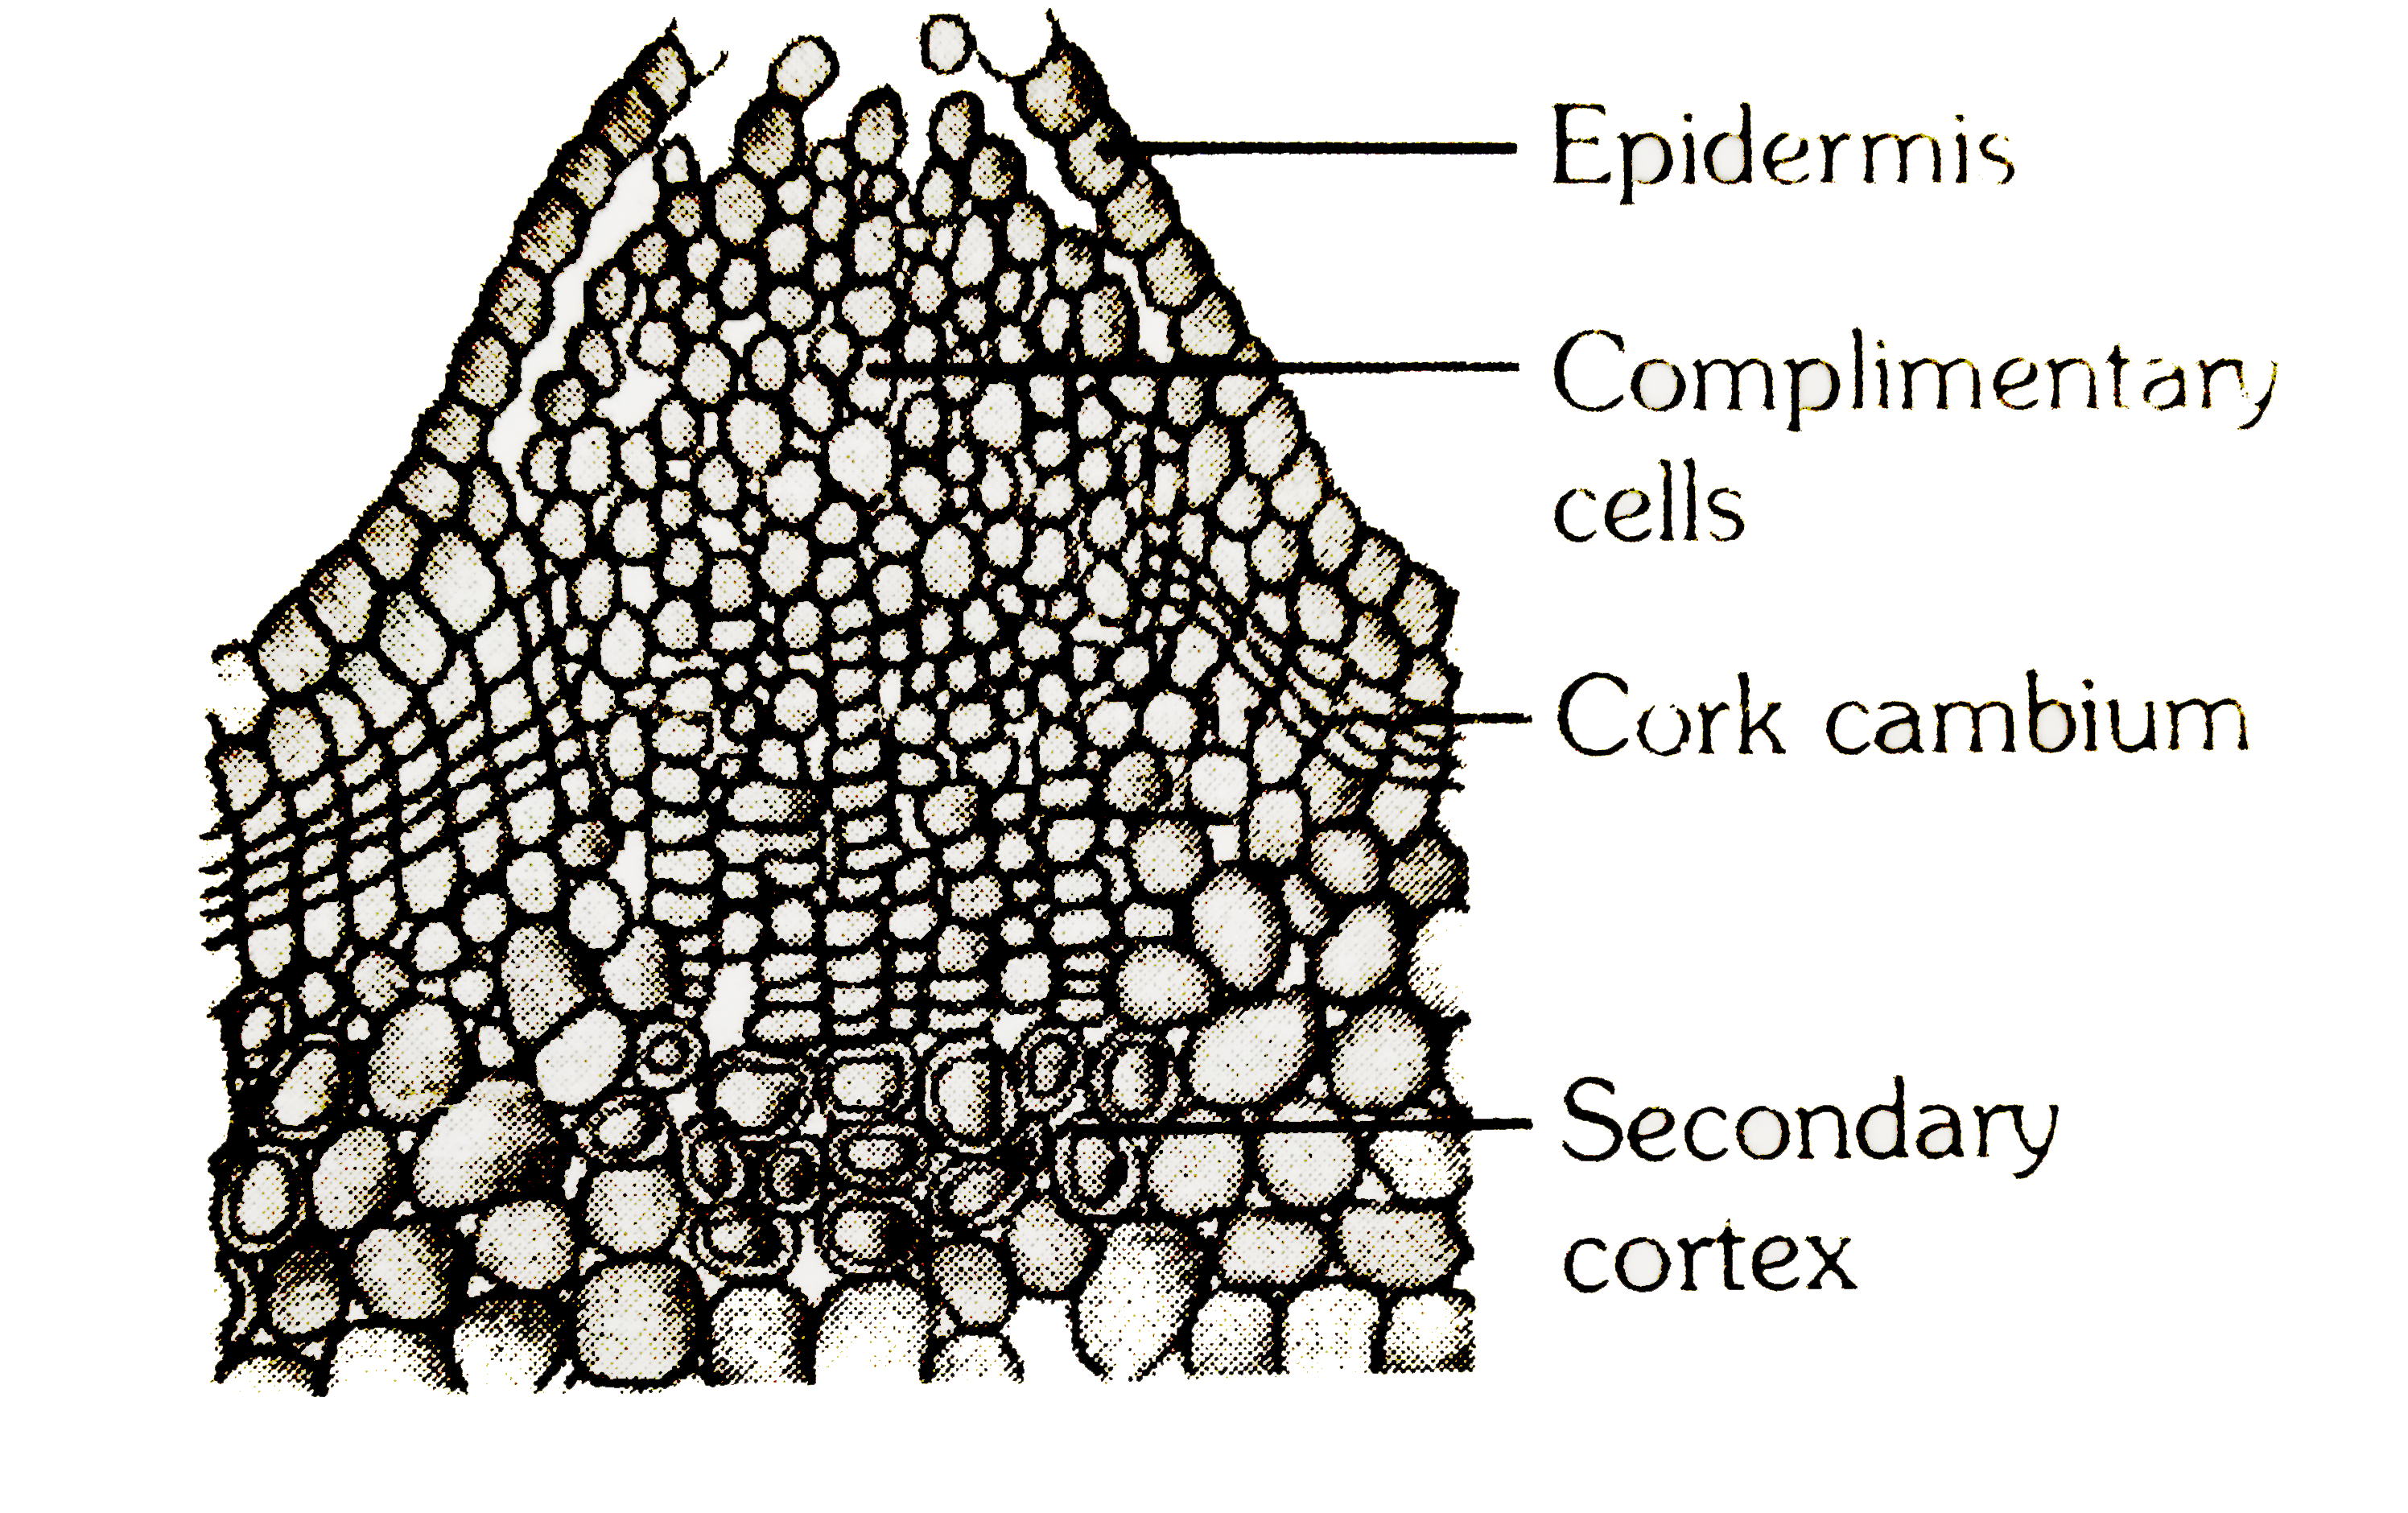
View SolutionGiven diagram shows -
 View Solution
The given figure shows four p-V diagrams for the given sample of gas. In which case, no exchange of heat occurs with the sample?
 View Solution
The figure shows P - V diagram of a thermodynamic cycle
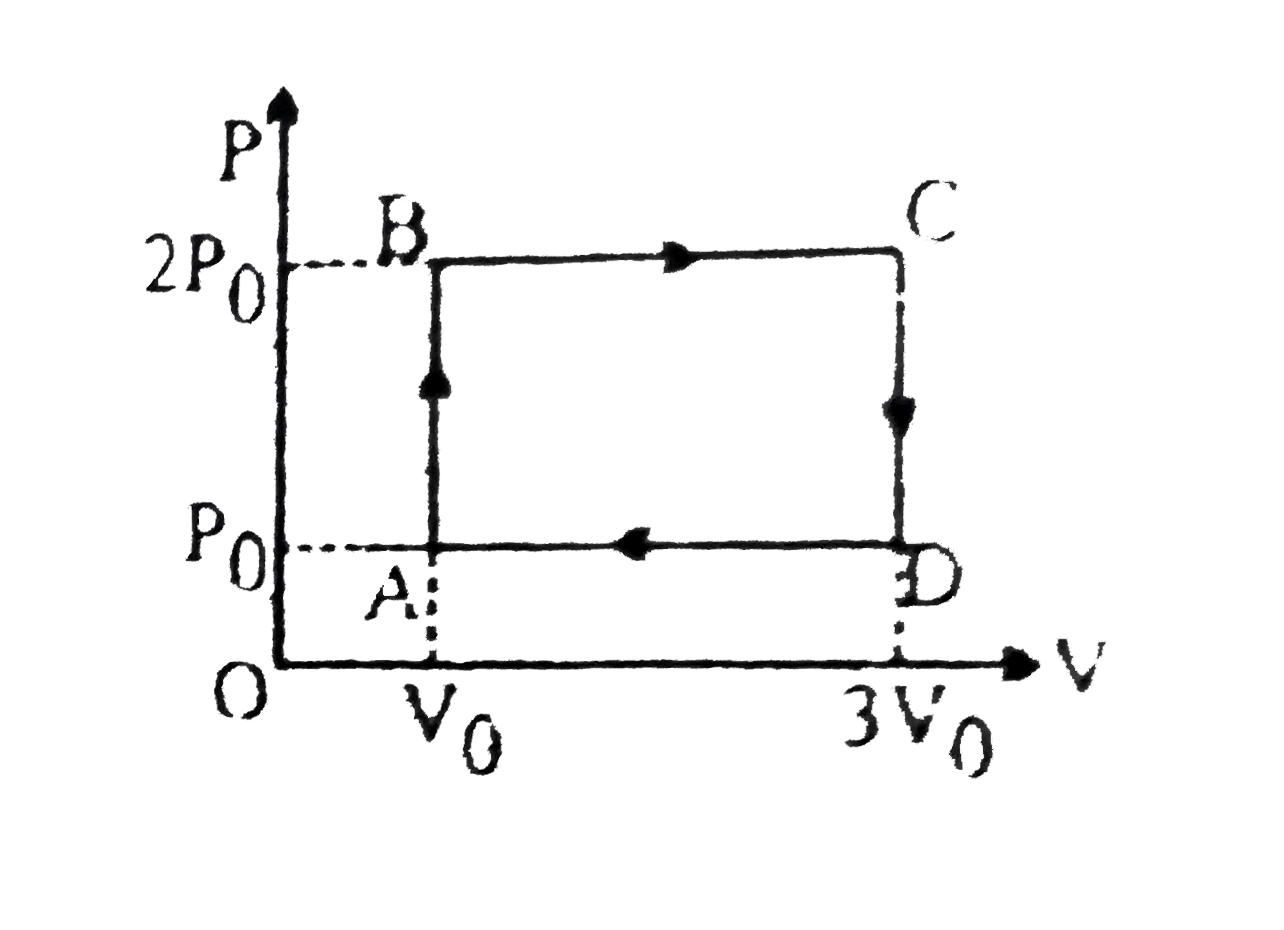
Choose the correct V - T diagram for the given cyclic process.View SolutionThe figure shows P - V diagram of a thermodynamic cycle
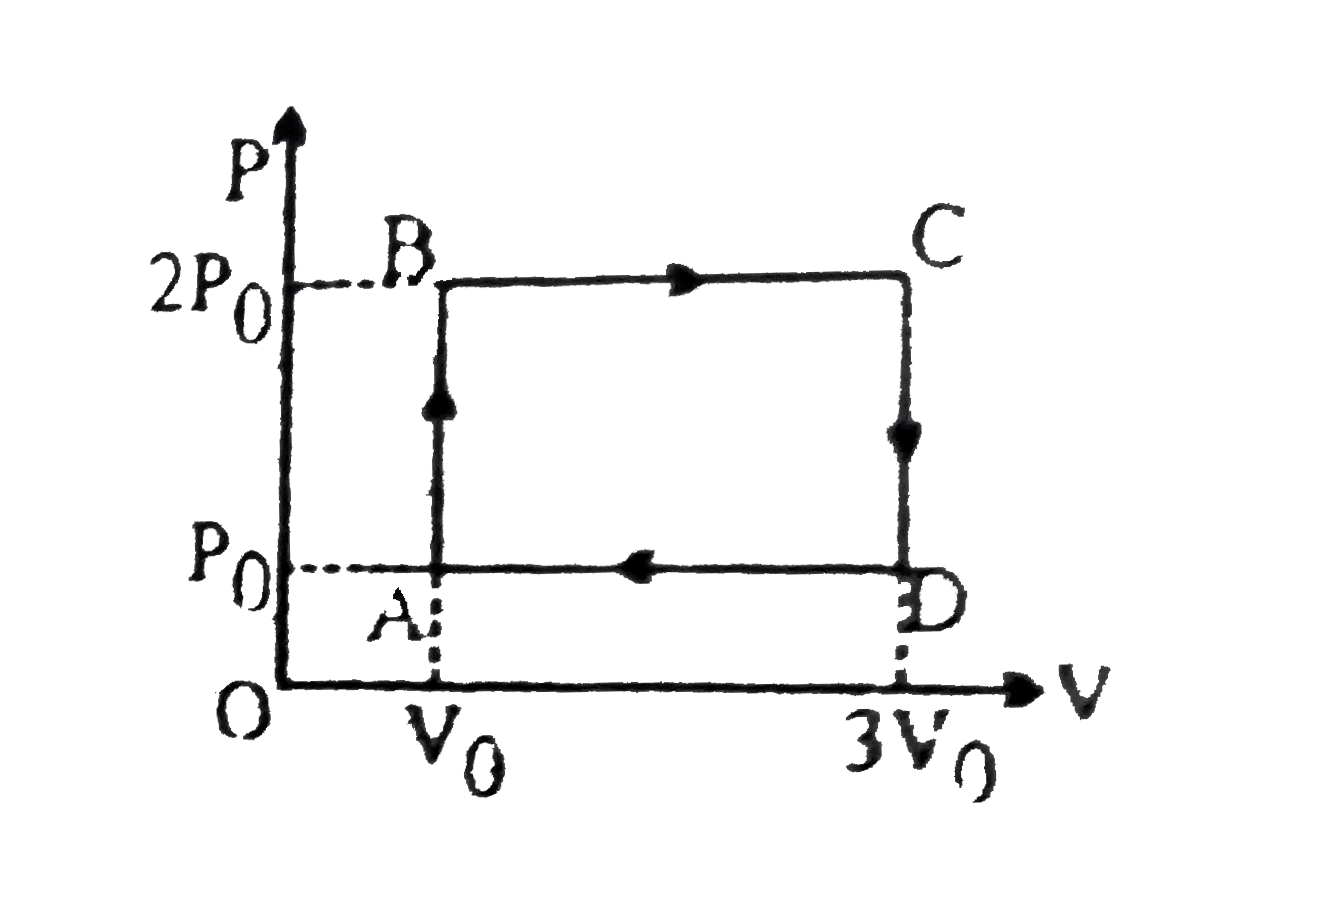
Choose the correct V - T diagram for the given cyclic process.View SolutionThe figure shows P-V diagram of a thermodynamic cycle. Which corresponding curve is correct ?
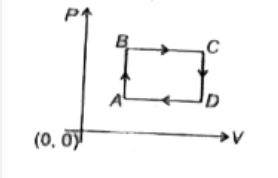 View Solution
The figure shows P-V diagram of a thermodynamic cycle. Which corresponding curve is correct?
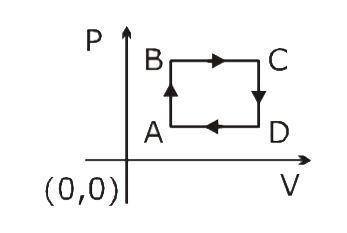 View Solution

