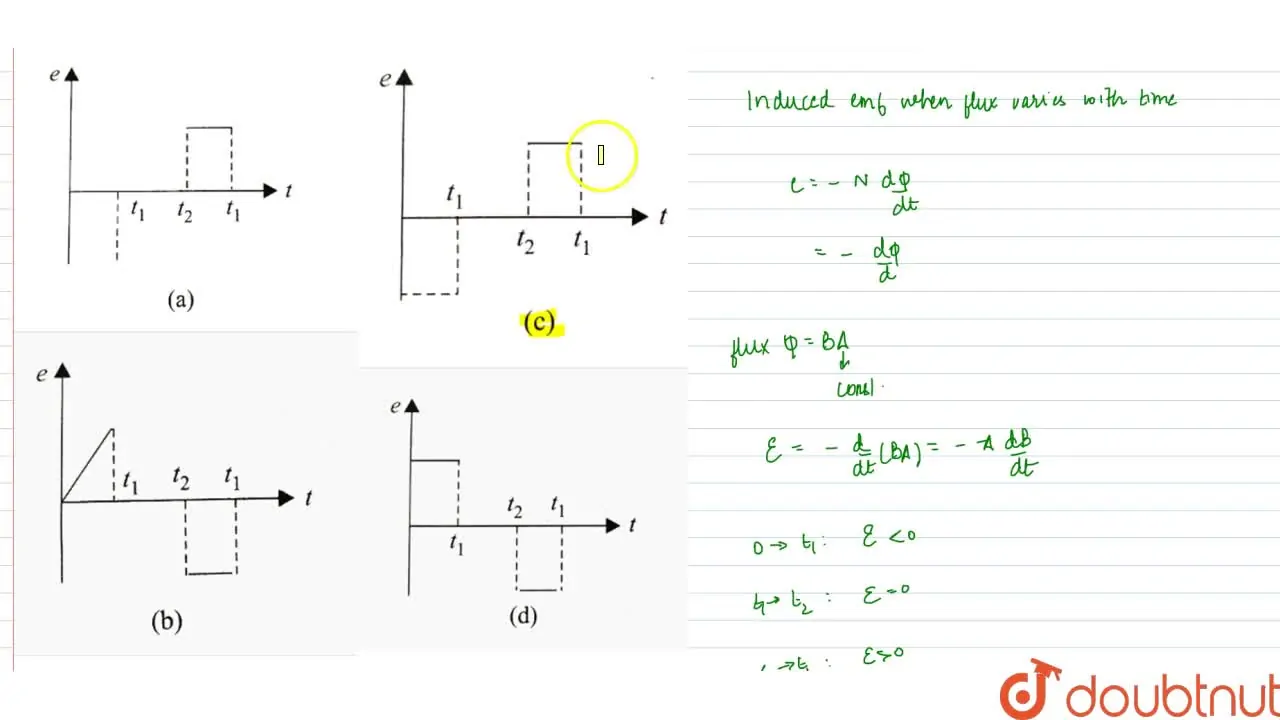
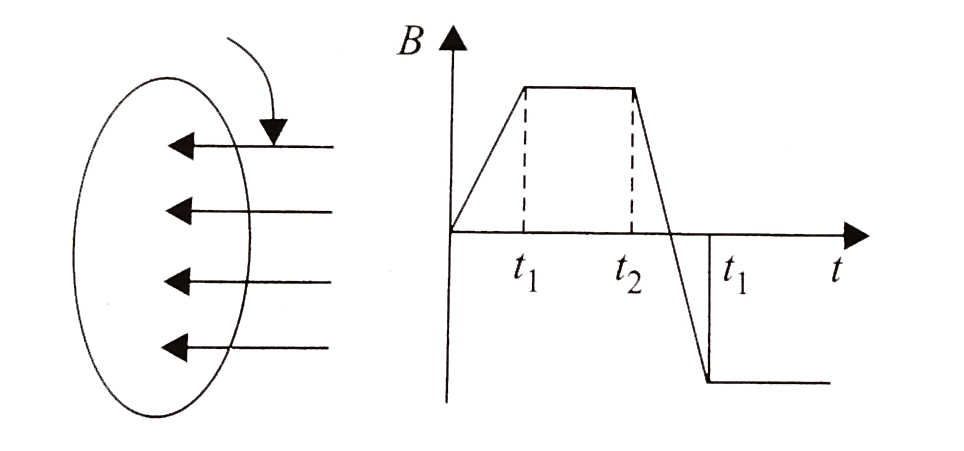
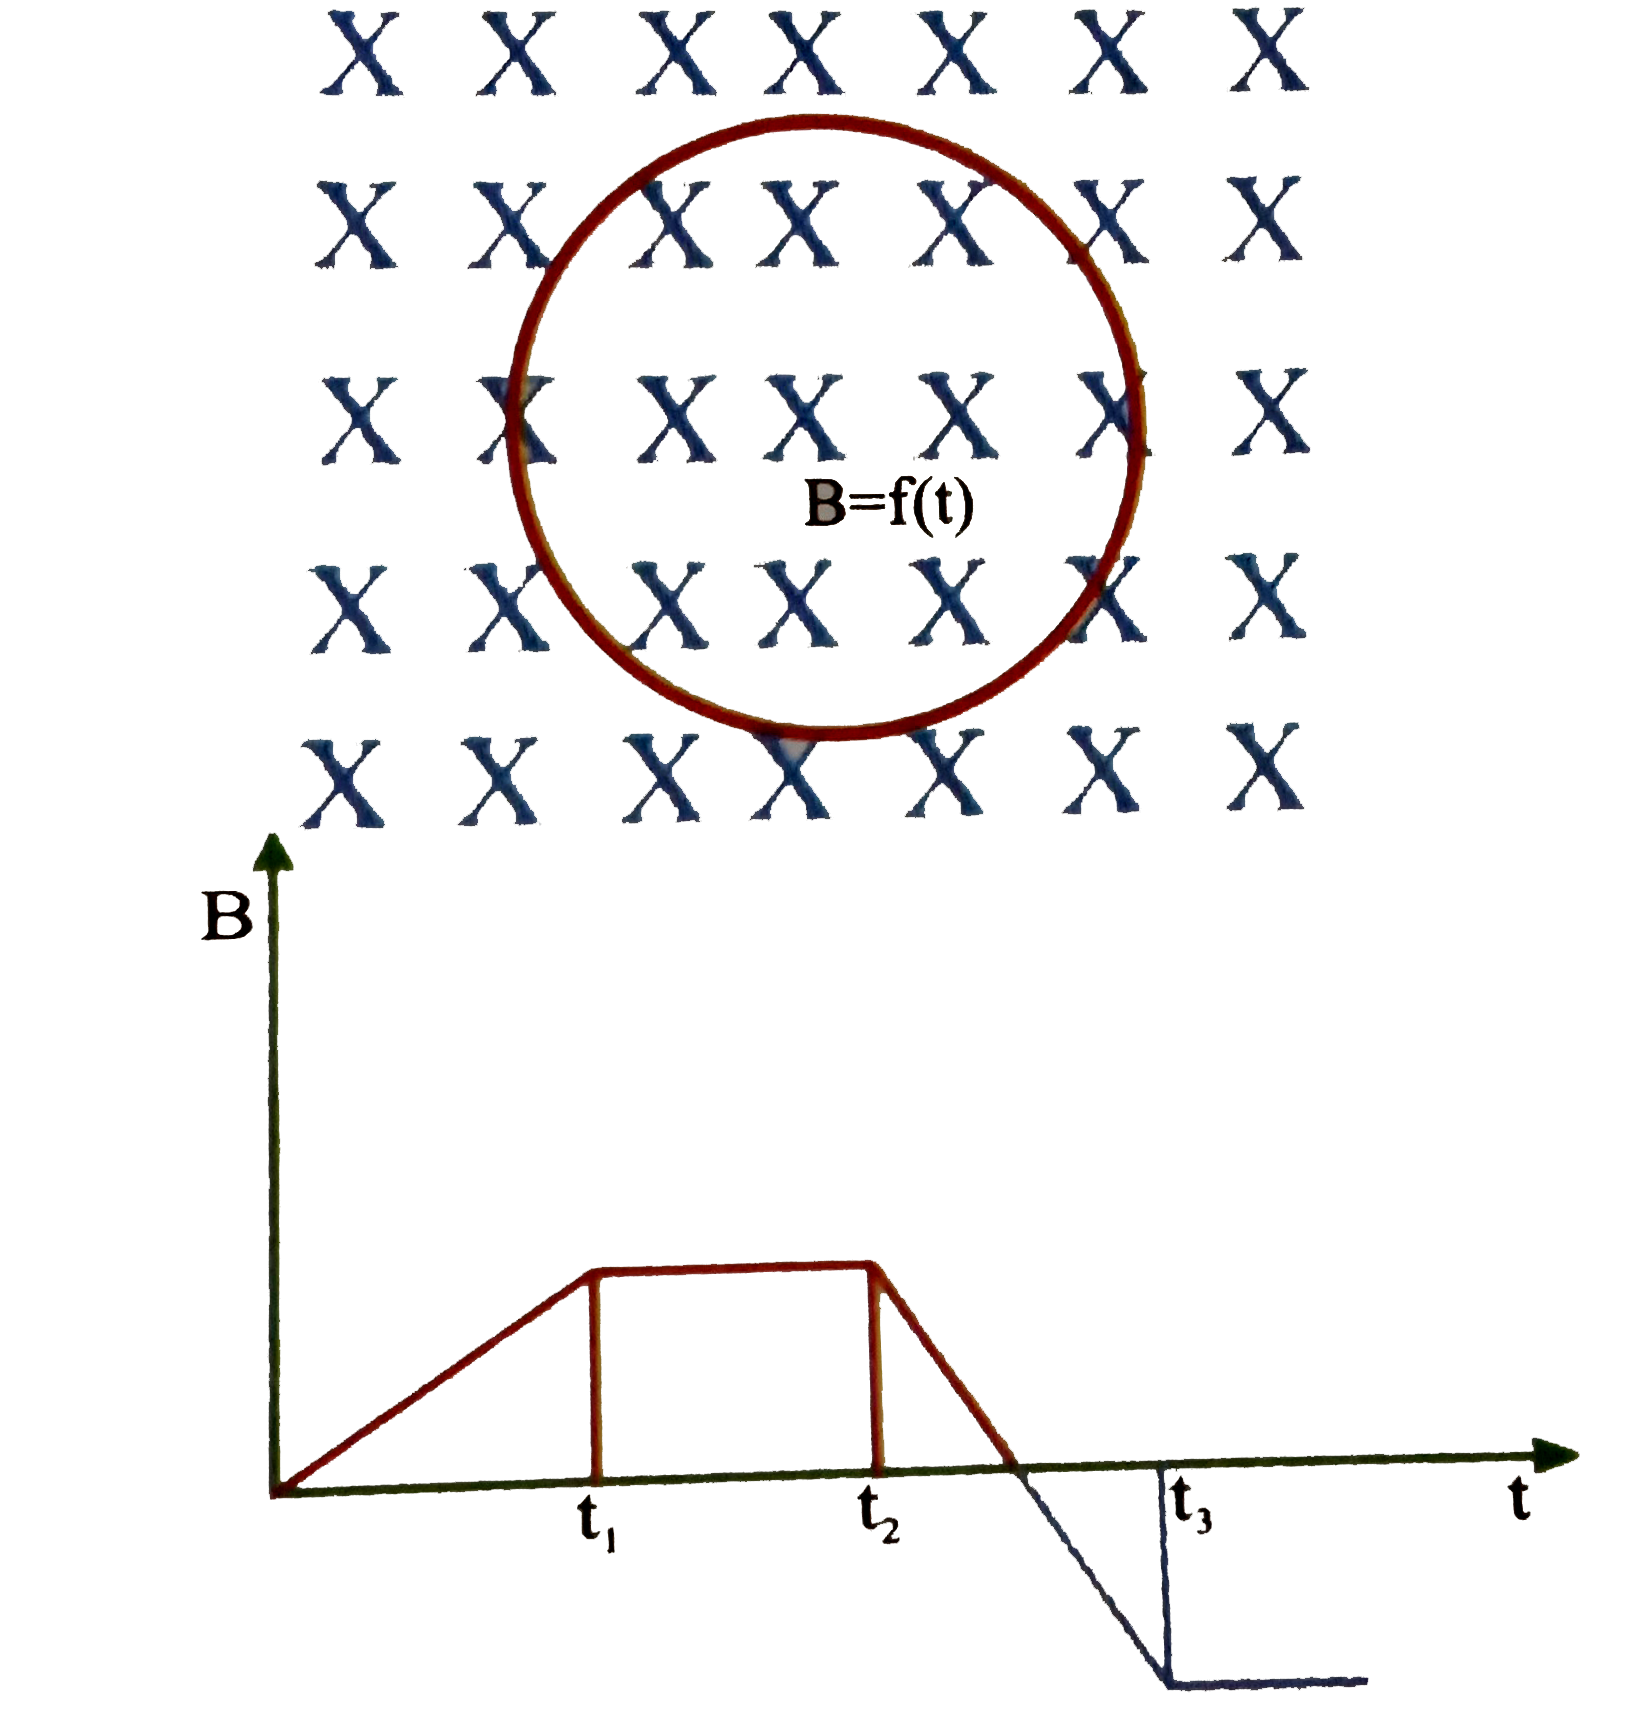
A wire loop is placed in a region of time varying magnetic field which is oriented orthogonally to the plane of the loop as shown in Fig. The graph shows the magnetic field variation as the function of time. Assume the positive emf is the one which drives a current in the clockwise direction and seen by the observer in the direction of B. Which of the following graphs best represents the induced emf as a function of time?
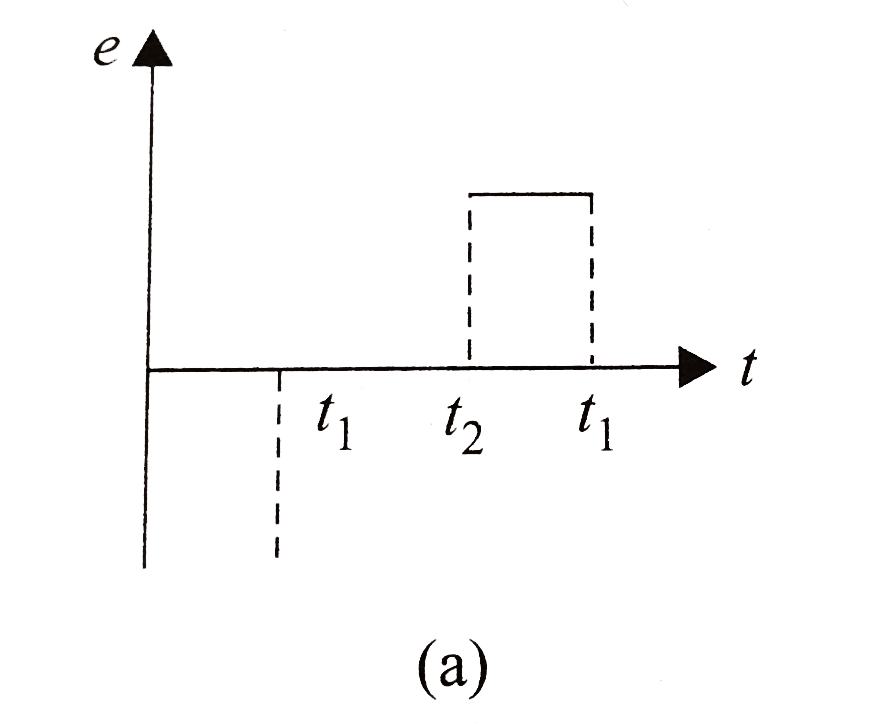
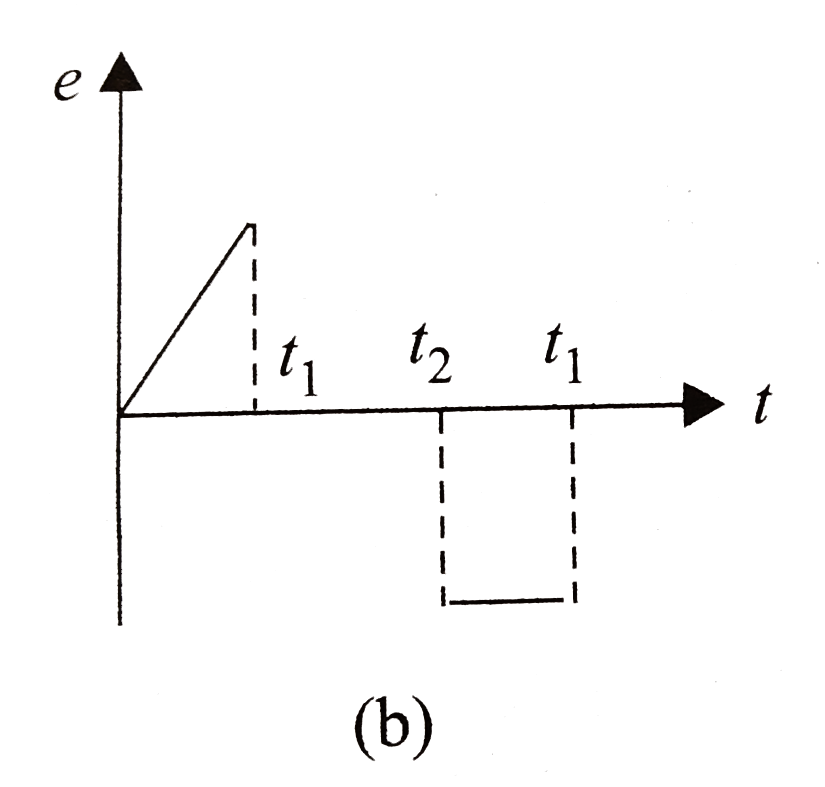
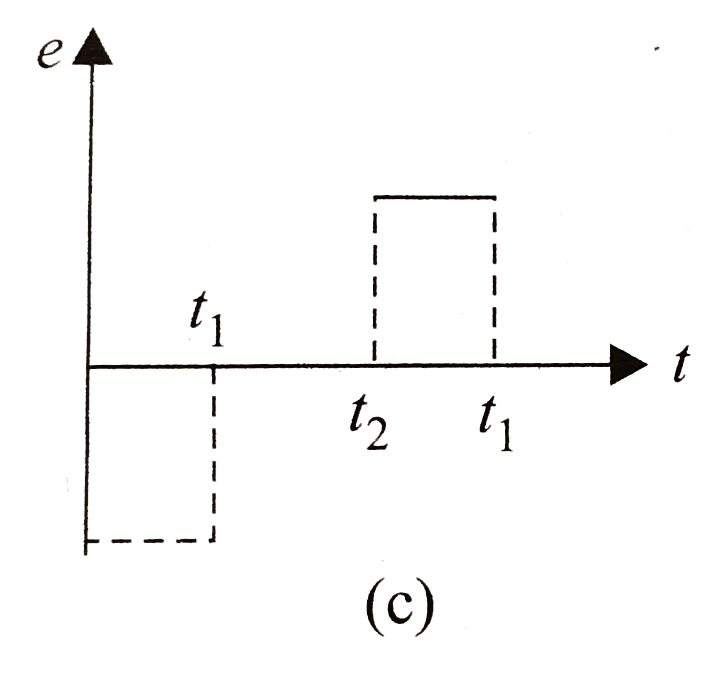
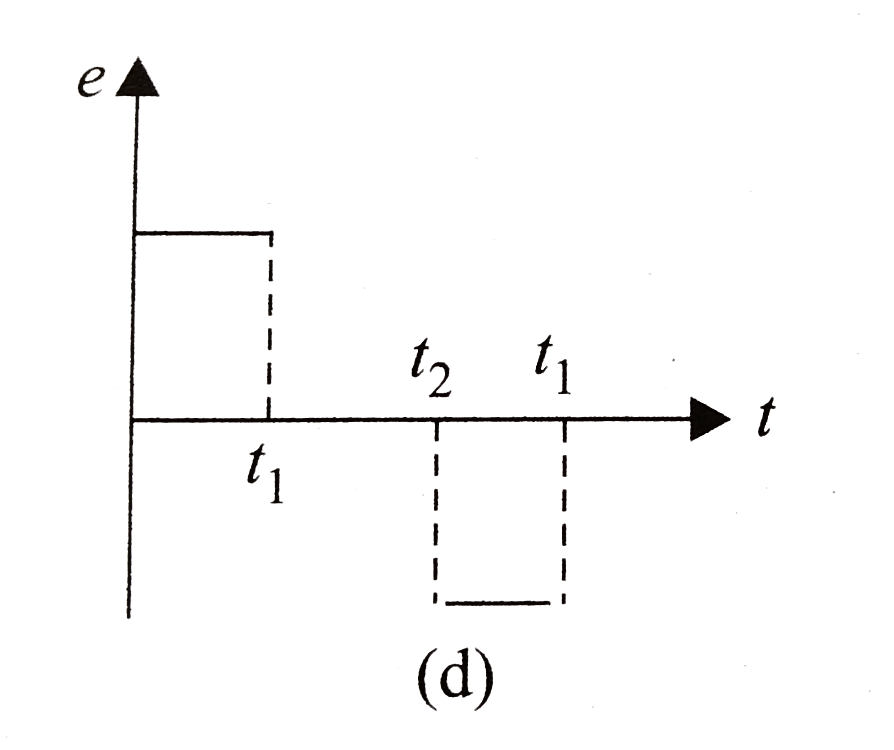
The correct Answer is:C
For, 0<t<t1,dBdt is positive and hence, e−AdBdt is
costant and negative.
for t1<t<t2,dBdt is zero and hence, e−AdBdt is also zero.
for (t2)<(t)<(t3),dBdt is negative and hence, e−AdBdt is constant and positive.
Related Playlists
- BOOK - CENGAGE PHYSICSCHAPTER - MISCELLANEOUS VOLUME 5EXERCISE - Multiple Correct34videos
MISCELLANEOUS VOLUME 5
- BOOK - CENGAGE PHYSICSCHAPTER - MISCELLANEOUS VOLUME 5EXERCISE - Linked Comprehension84videos
MISCELLANEOUS VOLUME 5
- BOOK - CENGAGE PHYSICSCHAPTER - MISCELLANEOUS VOLUME 3EXERCISE - True and False3videos
MISCELLANEOUS VOLUME 3
- BOOK - CENGAGE PHYSICSCHAPTER - Moving charges and magnetismEXERCISE - Question Bank20videos
Moving charges and magnetism
Similar Questions
A wire loop is placed in a region of time varying magnetic field which oriented orthogonally to the plane of the loop as shown in figure. The graph shows the magnetic field variation as the function of time. Assume the positive emf is the ine which drives a current in the clockwise direction and seen by the observer in the direction of B. Which of the following graphs best represents the induced emf a function of time.
 View Solution
A metallic loop is placed in a nonuiform magnetic field. Will an emf be induced in the loop?
View SolutionA circular wire loop of radius r is placed in a region of uniform magnetic field B such that the plane of the loop makes an angle θ with the direction of B. In which of the following conditions, will no emf be induced in the loop?
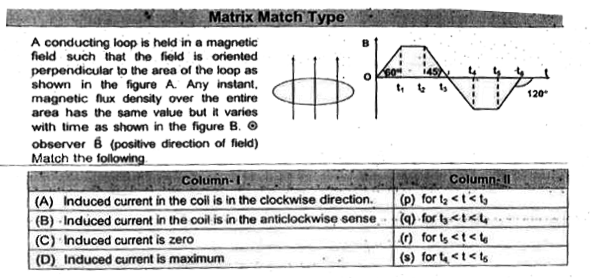
View SolutionA conducting loop is held in a magneitc field such that the field is oriented perpendicular to the area of the loop as shown in the figure A any instant, magnetic flux density over the entire area has the same value but it varies with time as shown in the figure B ⊙ observer →B (positive direction of field ) Match the following .
 View Solution
A conducting loop is held in a magneitc field such that the field is oriented perpendicular to the area of the loop as shown in the figure A any instant, magnetic flux density over the entire area has the same value but it varies with time as shown in the figure B ⊙ observer →B (positive direction of field ) Match the following .
 View Solution
A conducting loop of area A is placed in a magnetic field which varies sinusoidally with time as B=B0sin
View SolutionA triangular loop of side l carries a current I. It is placed in a magnetic field B such that the plane of the loop is in the direction of B. The torque on the loop is
View SolutionA triangular loop of side l carries a current I. It is placed in a magnetic field B such that the plane of the loop is in the direction of B. The torque on the loop is
View SolutionA positively charged disk is rotated clockwise as shown in Fig. The direction of hte magnetic field at a point A in the plane of the disk is
View SolutionA triangular loop of side 1 carries a current I. It is placed in a magnetic field B such that the plane of the loop is in the direction of B. The torque on the loop is
View Solution

