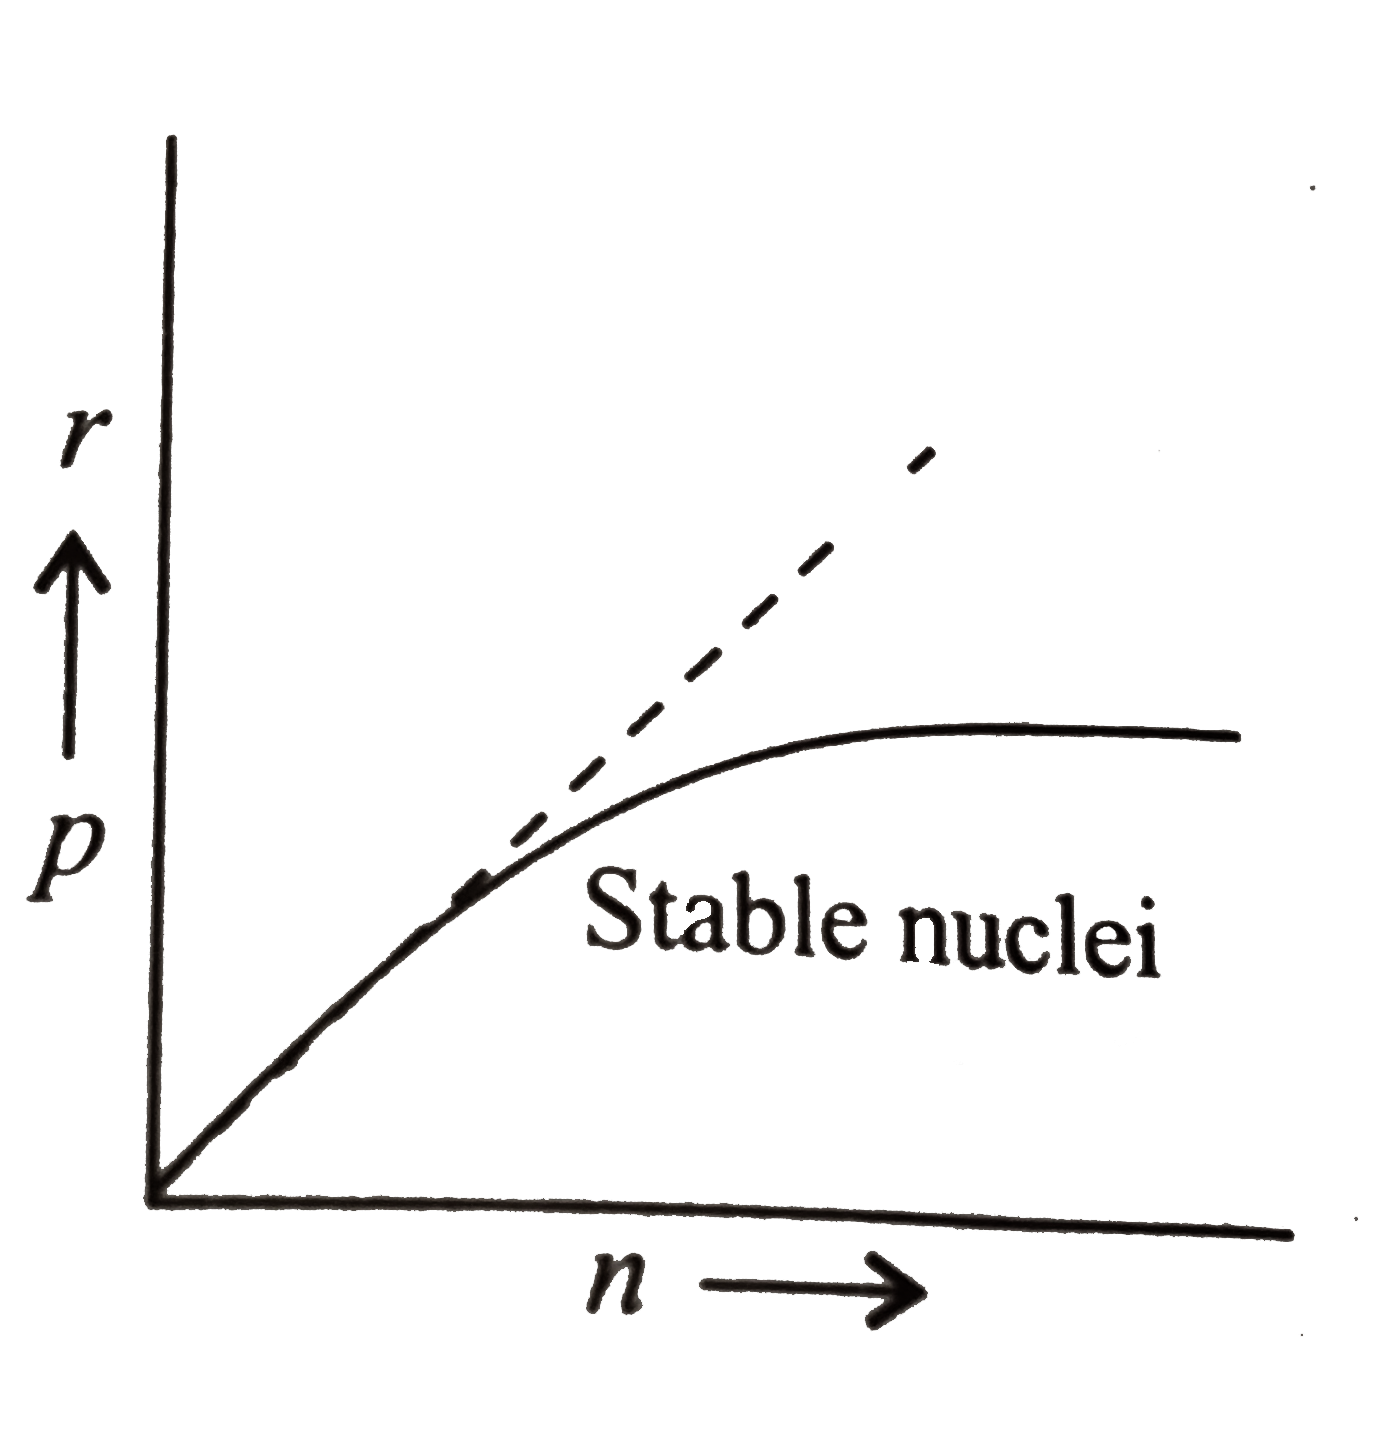
Statement : The plot of atomic number ( y -axis ) versus number of neutrons ( x -axis ) for stable nuclei shows a curvature towards x-axis fron the line of slope as the atomic number is increased .
Explanation : proton -proton electrostatic repulsions begin to overcome attracive forces involving protons and neutrons in heavier nuclides.
A
If both (A) and (R ) are correct, and (R ) is the correct explanation of (A).
B
If both (A) and (R ) are correct, but (R ) is not the correct explanation of (A)
C
If (A) is correct, but (R ) is incorrect.
D
If (A) is incorrect, but (R ) is correct
Video Solution
Text Solution
The correct Answer is:A
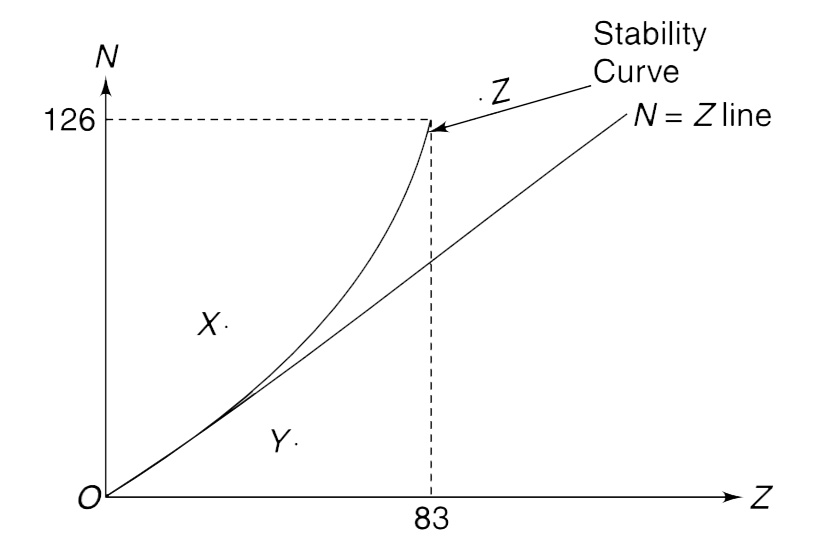
The stability relationship can be represented by a line with a slope of the maximum stability is attained when right of the curve. A radioactive nulide would be neutron rich and would decay by emission to produce a daughter nucleus with a lower ratio.
For heavier nuclides , replusions start to offset the attractive forces and an excess of neutrons over proptons, required for stability.

|
Updated on:21/07/2023
Related Playlists
- BOOK - CENGAGE CHEMISTRYCHAPTER - NUCLEAR CHEMISTRYEXERCISE - Archives Integer-Type1videos
NUCLEAR CHEMISTRY
- BOOK - CENGAGE CHEMISTRYCHAPTER - NUCLEAR CHEMISTRYEXERCISE - Archives Fill In The Blanks5videos
NUCLEAR CHEMISTRY
- BOOK - CENGAGE CHEMISTRYCHAPTER - NUCLEAR CHEMISTRYEXERCISE - Archives Single Correct Anser9videos
NUCLEAR CHEMISTRY
- BOOK - CENGAGE CHEMISTRYCHAPTER - NCERT BASED EXERCISEEXERCISE - Nuclear Chemistry (NCERT Exercise)29videos
NCERT BASED EXERCISE
- BOOK - CENGAGE CHEMISTRYCHAPTER - ORGANIC COMPOUNDS WITH FUNCTIONAL GROUPEXERCISE - Archives Analytical And Descriptive24videos
ORGANIC COMPOUNDS WITH FUNCTIONAL GROUP
Knowledge Check
- Question 1 - Select One
Statement-1: Th plot of atomic number (y-axis) versus number of neutrons (x-axis) for stable nuclei shows a curvature towards x-axis from the line of 45∘C slope as the atomic number is increased.
Statement-2: Proton-proton electrostatic repulsions begin to overcome attractive forces involving protons and neutrons in heavier nuclides.AStatement-1 is True, statement-2 is True, Statement-2 is a correct explantion for Statement-1.BStatement-1 is True, Statement-2 is True, Statement-2 is NOT a correct explanation for Statement-1CStatement-1 is True, Statement-2 is False.DStatement-1 is False, Statement-2 is True. - Question 1 - Select One
Statement : The plot of atomic number ( y -axis ) versus number of neutrons ( x -axis ) for stable nuclei shows a curvature towards x-axis fron the line of 45∘ slope as the atomic number is increased .
Explanation : proton -proton electrostatic repulsions begin to overcome attracive forces involving protons and neutrons in heavier nuclides.AStatement 1 is true, statement 2 is true, statement 2 is correct explanation for statement 1.BStatement 1 is true, statement 2 is true, statement 2 is not a correct explanation for statement 1.CStatement 1 is true, statement 2 is falseDStatement 1 is false, statement 2 is true - Question 1 - Select One
Statement : The plot of atomic number ( y -axis ) versus number of neutrons ( x -axis ) for stable nuclei shows a curvature towards x-axis fron the line of 45∘ slope as the atomic number is increased .
Explanation : proton -proton electrostatic repulsions begin to overcome attracive forces involving protons and neutrons in heavier nuclides.AIf both Statement-I & Statement -II are True & the Statement -II is a correct explanation of the Statement -I.BIf both Statement -I & Statement -II are True but Statement-II is not a correct explanation of the Statement-I.CIf Statement-I is True but the Statement -II is False.DIf Statement-I is False but the Statement -II is True. - Question 1 - Select One
Statement 1 : Proton -proton electrostatic repulsions begin to overcome attractive forces involving protons and neutrons in heavier nuclides
Statement 2 : The plot of atomic number (y-axis) veruse number of neutrons (x-axis) for stable nuclei shows a curvature towards x-axis from the line of 45∘ slope as the atomic number is increased.AStatement 1 is true, statement 2 is true , statement 2 is a correct explanation for statement 1BStatement 1 is true, Statement 2 is true, statement 2 is not a correct explanation for statement 1CStatement 1 is true, statement 2 is falseDStatement 1 is false, statement 2 is true - Question 1 - Select One
The nucleus of an atom is made up of X protons and Y neutrons. For the most stable and abundant nuclei
AX and Y are both evenBX and Y are both oddCX is even and Y is oddDX is odd and Y is even - Question 1 - Select One or More
A plot of the number of neutrons (n) against the number of protons (p) of stable nuclei exhibits upward deviation from linearity for atomic number, Z > 20. For an unstable nucleus having n, p ratio less than 1, the possible mode(s) of decay is(are)
Aβ−-decay (βemission)Borbital or K- electron captureCneutron emissionDβ+-decay (positron emission). - Question 1 - Select One
A plot of the number of neutrons (n) against the number of protons (p) of stable nuclei exhibits upward deviation from linearity for atomic number, Z>20. For an unstable nucleus having n/p ratio less than 1, the possible mode (s) of decay is (are)
Aβ−−decay(β−emission)Borbital or K- electron captureCneutron emissonDβ+−dacay(positron emission) - Question 1 - Select One or More
A plot of the number of neutrons (n) against the number of protons (p) of stable nuclei exhibits upward deviation from linearity for atomic number, Z>20. For an unstable nucleus having n/p ratio less than 1, the possible mode (s) of decay is (are)
Aβ− -decay (β-emission)Borbital and K-electron captureCneutron emissionDβ+ -decay (positron emission) - Question 1 - Select One or More
A plot of the number of neutrons (n) against the number of protons (p) of stable nuclei exhibits upward deviation from linearity for atomic number, Z>20. For an unstable nucleus having n/p ratio less than 1, the possible mode (s) of decay is (are)
Aβ−− decay (β emission)BOrbital or K-electron captureCNeutron emissionDβ+− decay (positron emission)


