For an ideal gas, under isobaric condition, a graph between log V vs log T :
is linear with unit slope
represents Boyle’s Law
represents Charle’s Law
represents Gay-Lussac’s Law
The correct Answer is:A, C
To solve the question regarding the graph between log V vs log T for an ideal gas under isobaric conditions, we can follow these steps:
1. Understand the Ideal Gas Law:
The ideal gas law is given by the equation:
PV=nRT
where P is the pressure, V is the volume, n is the number of moles, R is the universal gas constant, and T is the absolute temperature.
Hint: Remember that the ideal gas law relates pressure, volume, temperature, and the number of moles.
2. Identify Isobaric Conditions:
Under isobaric conditions, the pressure P remains constant. This means we can express the relationship between volume and temperature while keeping P constant.
Hint: Isobaric means pressure does not change; focus on how volume and temperature relate under this condition.
3. Establish the Relationship:
Since P is constant, we can rearrange the ideal gas law to show that volume V is directly proportional to temperature T:
V∝T
This indicates that as temperature increases, volume also increases.
Hint: Think about direct proportionality—if one increases, the other must also increase.
4. Convert Proportionality to an Equation:
We can express this relationship as:
V=kT
where k is a constant.
Hint: This equation shows a linear relationship between volume and temperature.
5. Take the Logarithm of Both Sides:
Taking the logarithm of both sides gives:
logV=log(kT)=logk+logT
This can be rearranged to:
logV=logT+logk
Hint: Remember that the logarithm of a product is the sum of the logarithms.
6. Identify the Linear Relationship:
The equation logV=logT+logk is in the form of a straight line y=mx+c, where:
- y=logV
- x=logT
- m=1 (slope)
- c=logk (y-intercept)
Hint: Recognize that this represents a linear graph with a slope of 1.
7. Conclusion:
Since the graph of logV versus logT is linear with a unit slope, it represents Charles' Law, which states that at constant pressure, the volume of a gas is directly proportional to its absolute temperature.
Hint: Recall that Charles' Law specifically deals with volume and temperature at constant pressure.
Final Answer:
The graph between log V vs log T for an ideal gas under isobaric conditions is linear with a unit slope and represents Charles' Law.
The ideal gas law is given by the equation:
PV=nRT
where P is the pressure, V is the volume, n is the number of moles, R is the universal gas constant, and T is the absolute temperature.
Under isobaric conditions, the pressure P remains constant. This means we can express the relationship between volume and temperature while keeping P constant.
Since P is constant, we can rearrange the ideal gas law to show that volume V is directly proportional to temperature T:
V∝T
This indicates that as temperature increases, volume also increases.
We can express this relationship as:
V=kT
where k is a constant.
Taking the logarithm of both sides gives:
logV=log(kT)=logk+logT
This can be rearranged to:
logV=logT+logk
The equation logV=logT+logk is in the form of a straight line y=mx+c, where:
- y=logV
- x=logT
- m=1 (slope)
- c=logk (y-intercept)
Since the graph of logV versus logT is linear with a unit slope, it represents Charles' Law, which states that at constant pressure, the volume of a gas is directly proportional to its absolute temperature.
The graph between log V vs log T for an ideal gas under isobaric conditions is linear with a unit slope and represents Charles' Law.
Topper's Solved these Questions
- BOOK - VMC MODULES ENGLISHCHAPTER - STATES OF MATTEREXERCISE - Level-2 (NUMBERICAL VALUE TYPE FOR JEE MAIN15videos
STATES OF MATTER
- BOOK - VMC MODULES ENGLISHCHAPTER - STATES OF MATTEREXERCISE - JEE-Main ( ARCHIVE )17videos
STATES OF MATTER
- BOOK - VMC MODULES ENGLISHCHAPTER - STATES OF MATTEREXERCISE - Level-175videos
STATES OF MATTER
- BOOK - VMC MODULES ENGLISHCHAPTER - STATES OF MATTEREXERCISE - IMPECCABLE50videos
STATES OF MATTER
- BOOK - VMC MODULES ENGLISHCHAPTER - STOICHIOMETRY - IEXERCISE - JEE Advanced (Archive)31videos
STOICHIOMETRY - I
Similar Questions
Knowledge Check
- Question 1 - Select One
A gas that follows Boyle's law, Charle's law and Avogadro's law is called an ideal gas. Under what conditions a real gas would behave ideally ?
AUnder low pressure and temperatureBUnder high pressure and temperatureCUnder high pressure and low temperatureDUnder low pressure and high temperature
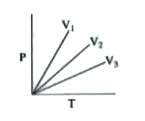
Under isochoric condition, graphs between P and T are shown below.Then volumes of gases are related as
 View Solution
A gas that follos Boyle's law, charle's law and Avogadro's law is called an ideal gas. Under what conditions a real gas would behave ideally ?
View SolutionA gas behave most like an Ideal gas under conditions of
View SolutionIn an adsorption experiment, a graph between log (xm) versus log P was found to be linear with a slope of 45∘ . The intercept on the log (xm) axis was found to be 0.3010 . Calculate the amount of the gas adsorbed per gram of charcoal under a pressure of 0.5 atm .
View SolutionIn an adsorption experiment, a graph between log (xm) versus log P was found to be linear with a slope of 45∘ . The intercept on the log y axis was found to be 0.301 . Calculate the amount of the gas adsorbed per gram of charcoal under a pressure of 3.0 atm.
View SolutionWhat is molar volume of an ideal gas under N.T.P. conditions ?
View SolutionIn an adsorption experiment a graph between log xm versus log P was fond to be linear with a slope of 45∘). The intercept on the log xm axis was found to 0.70. Calculate the amount of gas adsorbed per gram of charcoal under a pressure of 1 atm [log5=0.70]
View Solution
