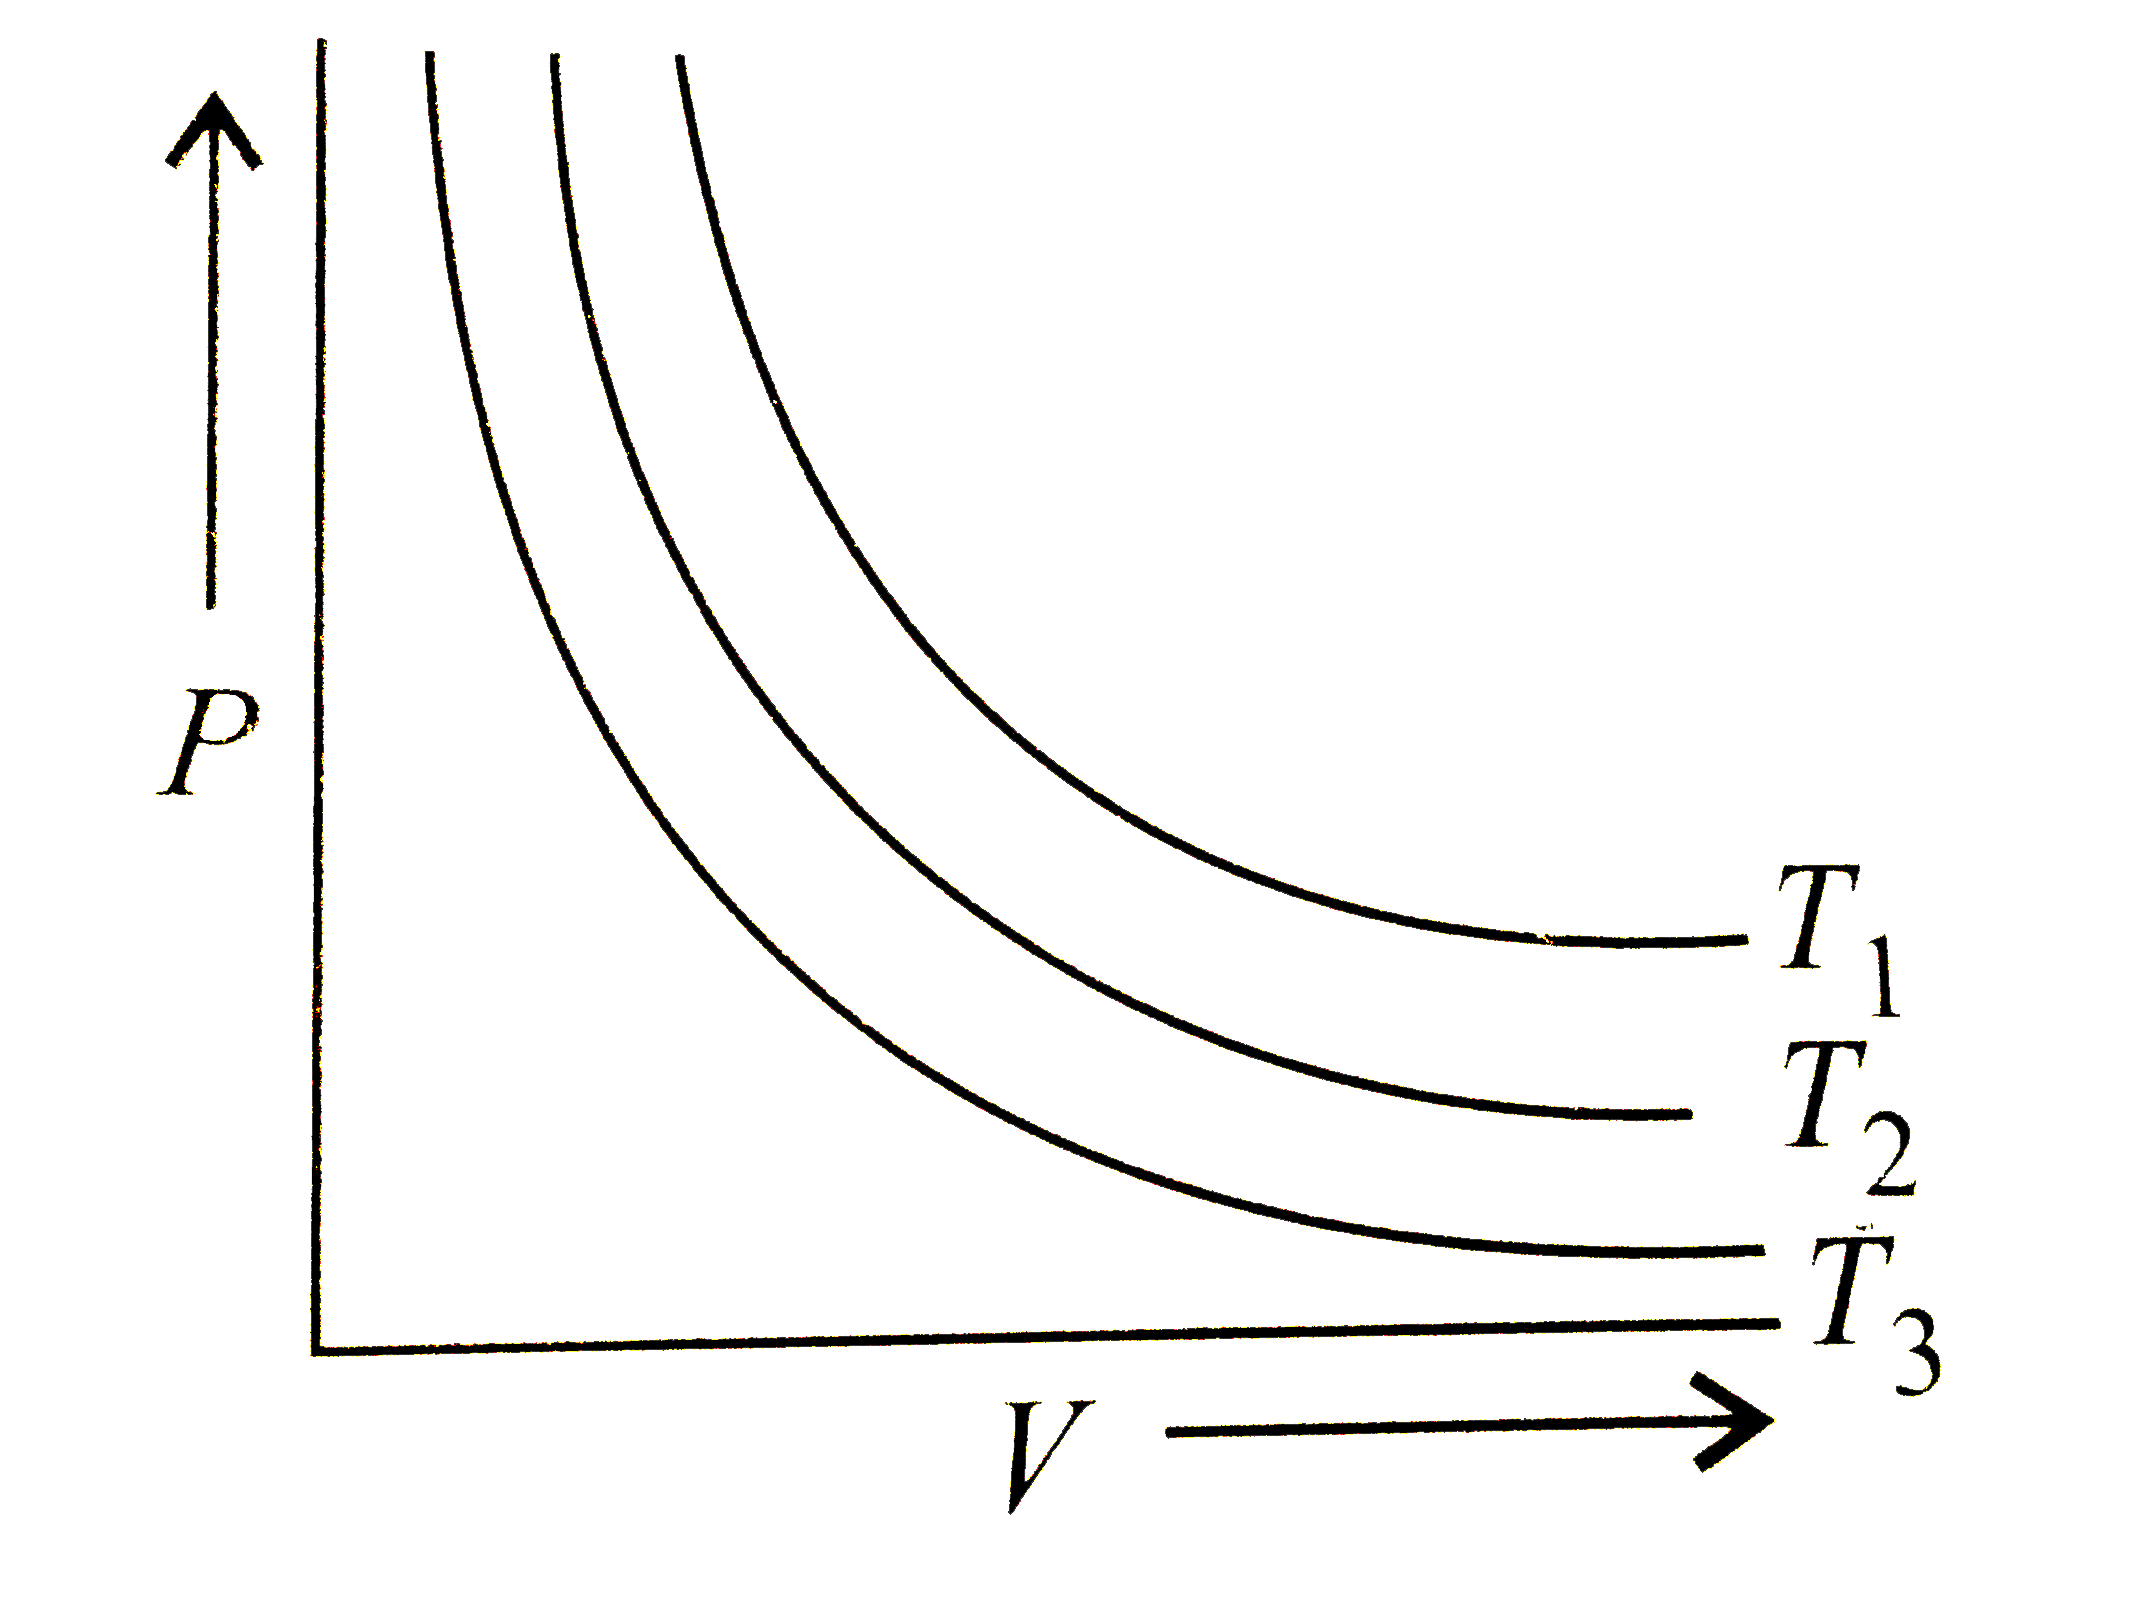
The graph of P vs V is given at different temperature

The correct relationship is
A
ab<0.4kcalmol−1
B
0.4calmol−1<ab<2kcalmol−1
C
ab>0.4kcalmol−1
D
ab=1kcalmol−1
Video Solution
Text Solution
The correct Answer is:D
Check that 500 K is Boyle’s Temperature.⇒500=a2×b⇒ab=1kcalmol−1
|
Topper's Solved these Questions
- STATES OF MATTERBOOK - VMC MODULES ENGLISHCHAPTER - STATES OF MATTEREXERCISE - Level-2 (NUMBERICAL VALUE TYPE FOR JEE MAIN
15 Videos
- STATES OF MATTERBOOK - VMC MODULES ENGLISHCHAPTER - STATES OF MATTEREXERCISE - JEE-Main ( ARCHIVE )
17 Videos
- STATES OF MATTERBOOK - VMC MODULES ENGLISHCHAPTER - STATES OF MATTEREXERCISE - Level-1
75 Videos
- STATES OF MATTERBOOK - VMC MODULES ENGLISHCHAPTER - STATES OF MATTEREXERCISE - IMPECCABLE
50 Videos
- STOICHIOMETRY - IBOOK - VMC MODULES ENGLISHCHAPTER - STOICHIOMETRY - IEXERCISE - JEE Advanced (Archive)
31 Videos
Similar Questions
Knowledge Check
The graph of PV vs P for a gas is
AparabolicBhyperbolicCa straight line parallel to X-axisDa straight line passing through originVolume : Temperature relationship is given by
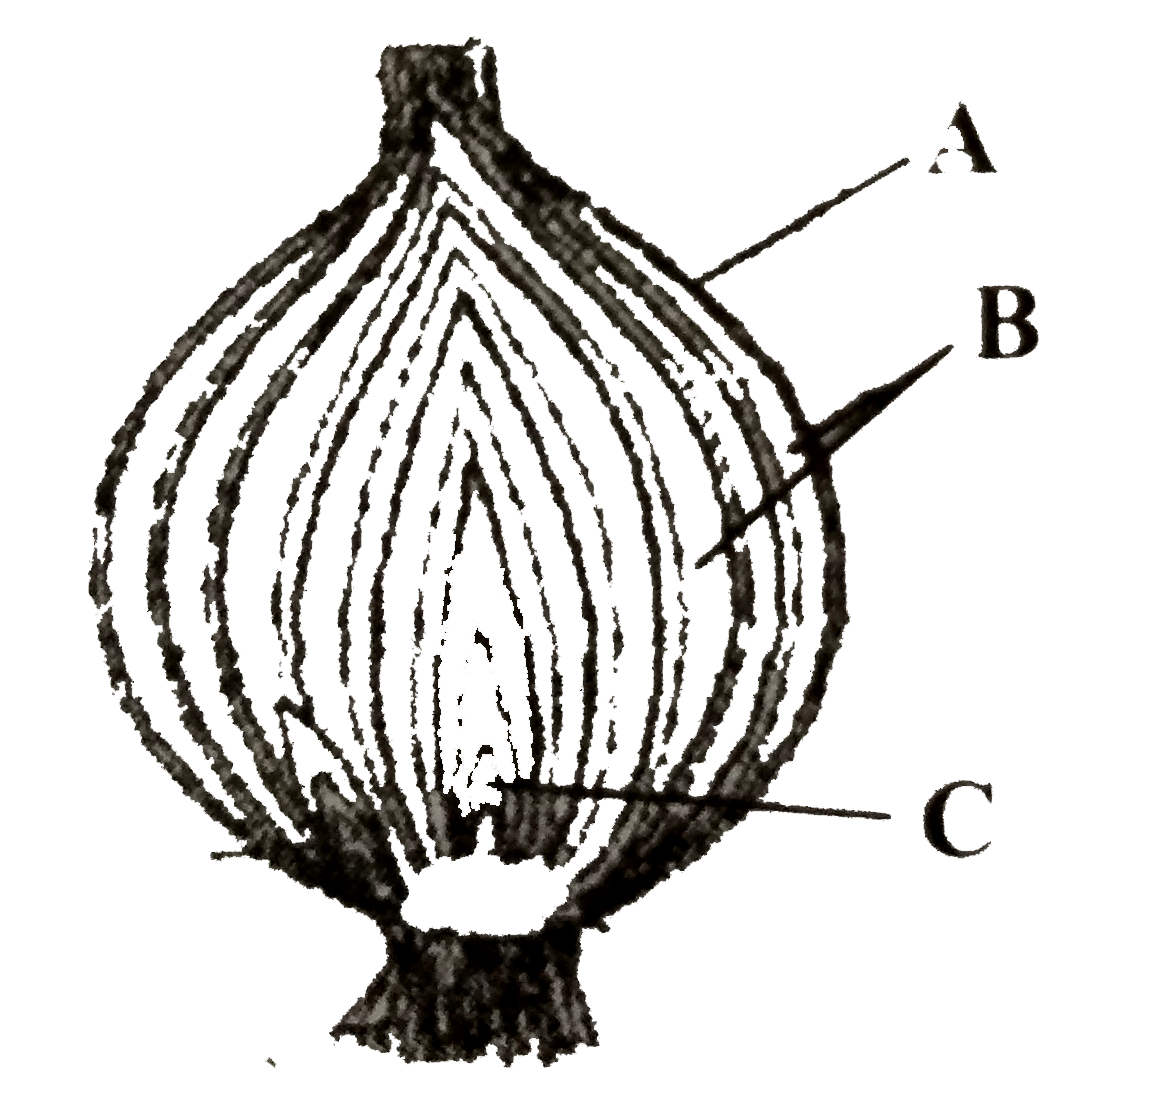
ABoyleBGay LussacCDaltonDCharlesThe given figure represent the V.S. of bulbs of Allium cepa identify the different parts and select the correct options
 A A B CFleshy scalesTunicTerminal budB A B CTunicTerminal budFleshy scalesC A B CTunicFleshy scalesTerminal budD A B CTerminal budFleshy scalesTunic
The plot of PV vs P at particular temperature is called isovbar.
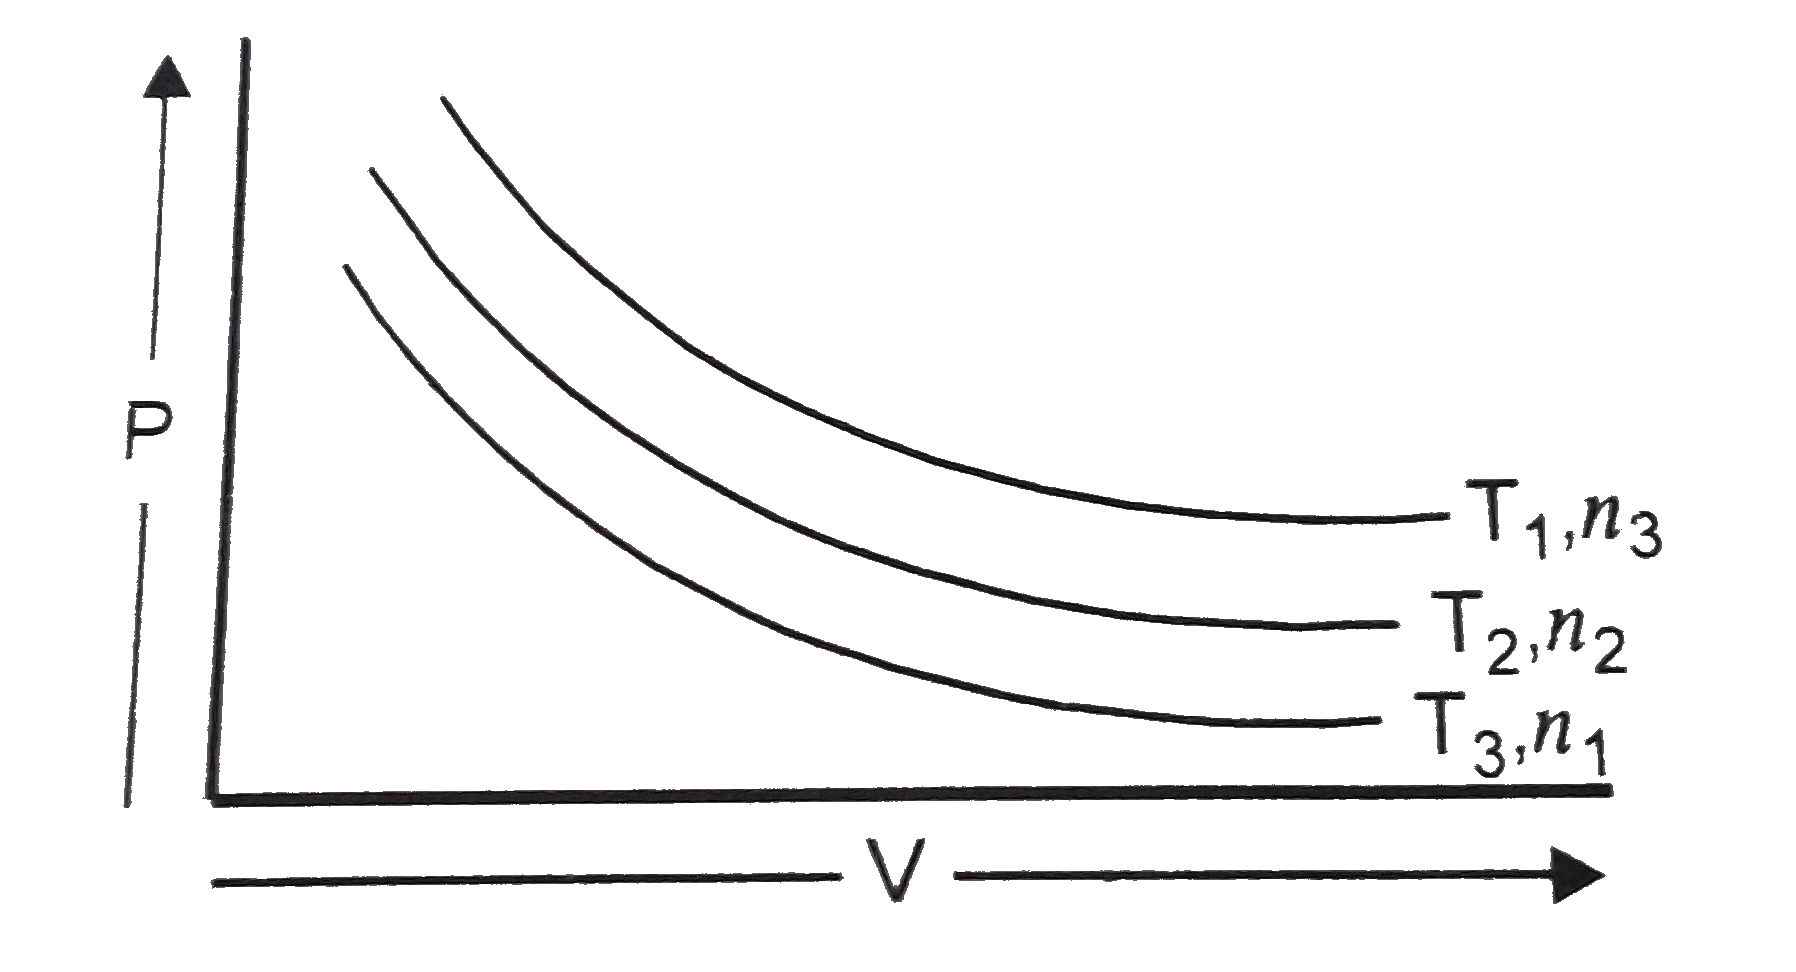
View SolutionThe graph betwene P and V at constant temperature should look like
View SolutionThe current (I) and voltage (V) graphs for a given metallic wire at two different temperature (T1) and (T2) are shown in fig. It is concluded that

View SolutionThe graph between PV vs P at constant temperature is linear parallel to the pressure axis.
View SolutionA graph plotted between Pdvsd (where p is osmotic pressure of solution of a solute of mol. Wt. m and d is its density temperature T. Pick out the correct statements about the plots :
View Solution


