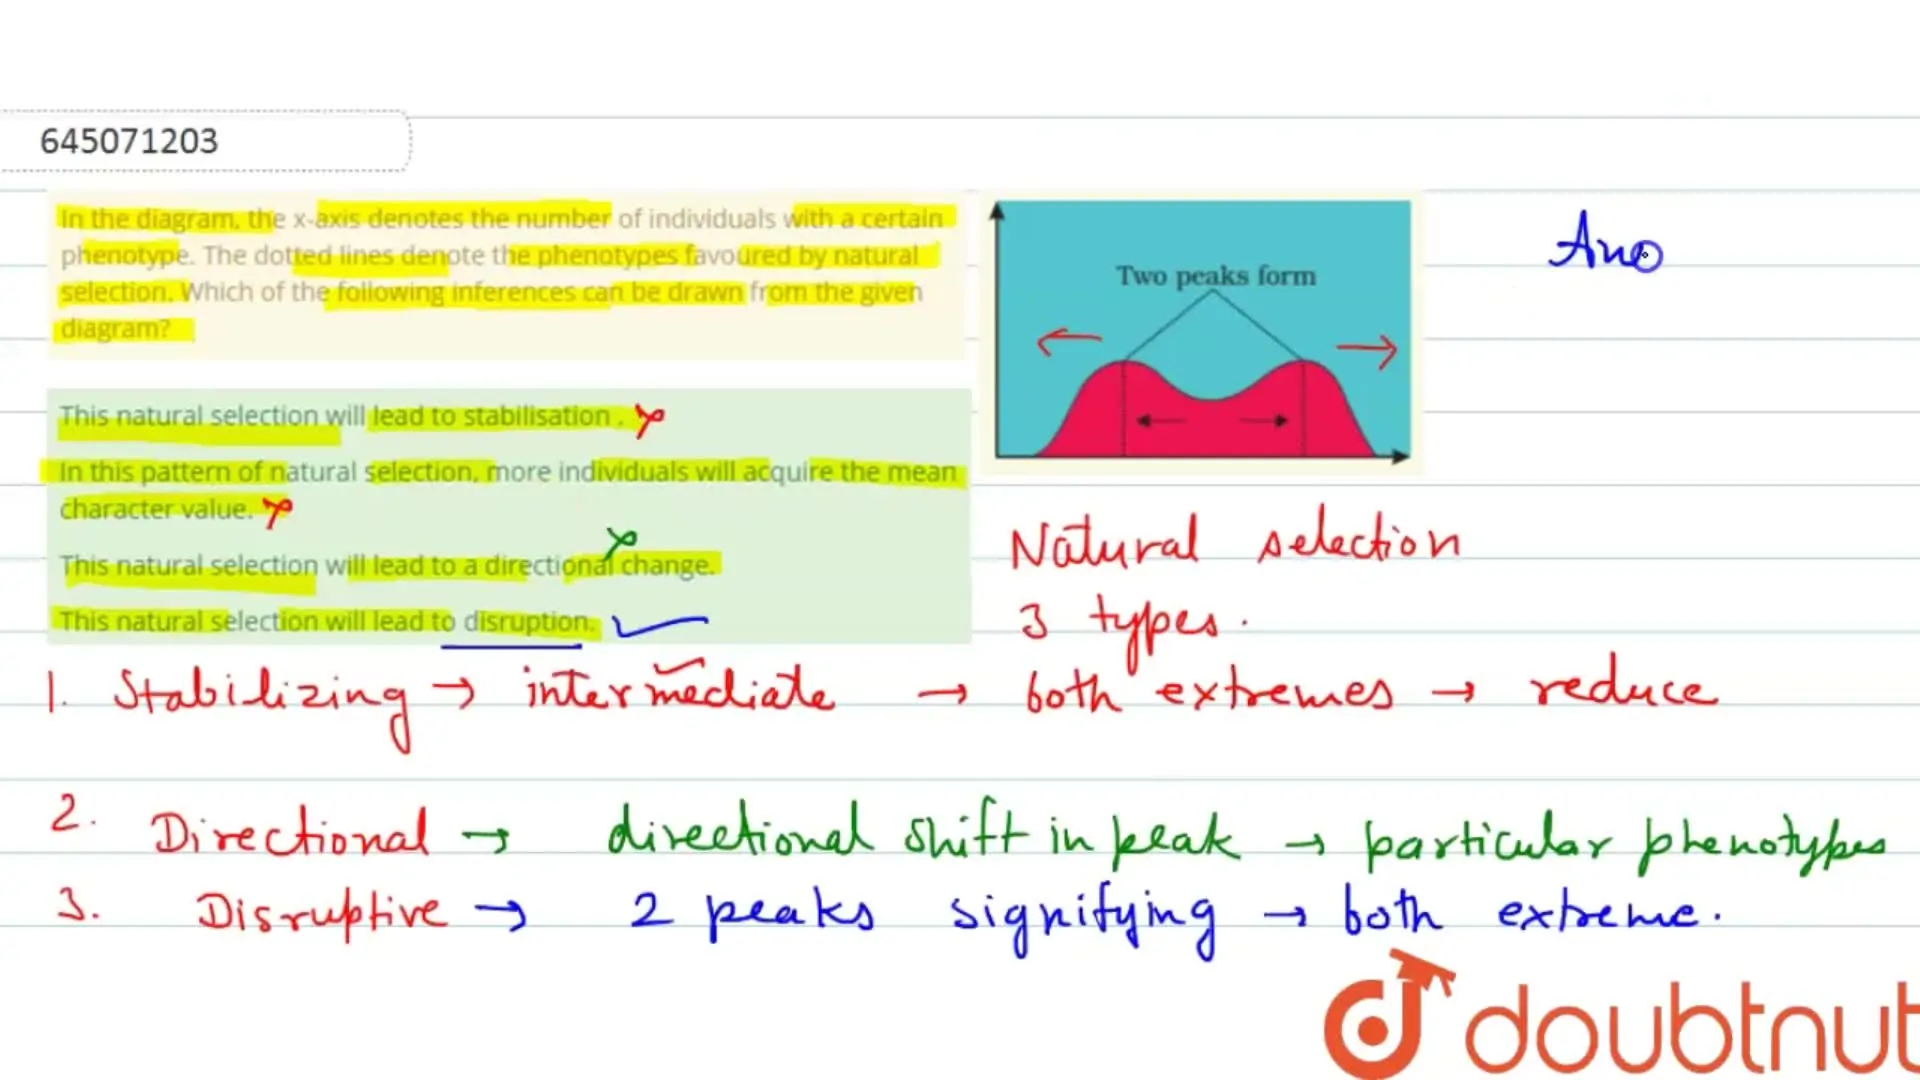
In the diagram, the x-axis denotes the number of individuals with a certain phenotype. The dotted lines denote the phenotypes favoured by natural selection. Which of the following inferences can be drawn from the given diagram?
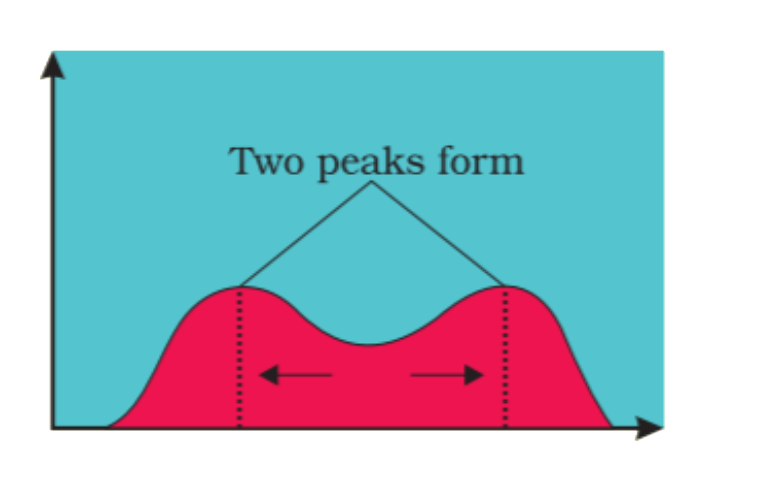
This natural selection will lead to stabilisation .
In this pattern of natural selection, more individuals will acquire the mean character value.
This natural selection will lead to a directional change.
This natural selection will lead to disruption.
The correct Answer is:D
Step by step video & image solution for In the diagram, the x-axis denotes the number of individuals with a certain phenotype. The dotted lines denote the phenotypes favoured by natural selection. Which of the following inferences can be drawn from the given diagram? by Biology experts to help you in doubts & scoring excellent marks in Class 12 exams.
Similar Questions
The age pyramid for human population is shown below
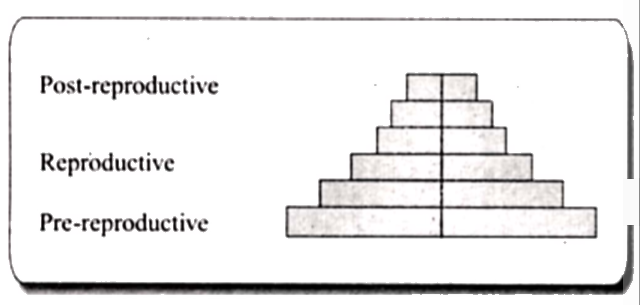
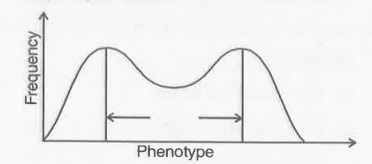
Which of the following conclusion can be drawn from the given age pyramid?View SolutionWhich type of natural selection is depicted in the diagram given below?
 View Solution
A market researcher selected 200 people at random from a group of people who indicated that they liked a certain book. The 200 people were shown a movie based on the book and then asked whether they liked or disliked the movie. Of those surveyed, 95% said they disliked the movie. Which of the following inferences can appropriately be drawn from this survey result?
View SolutionA psychology student randomly selected 300 people from a group of people who indicated that they preferred to work alone. Those 300 people were given a task to work on individually and then asked whether they were happy or unhappy while doing the task. OF those surveyed ,5% stated they are unhappy while doing the task. Which of the following inferences can appropriately be drawn from this survey result?
View Solution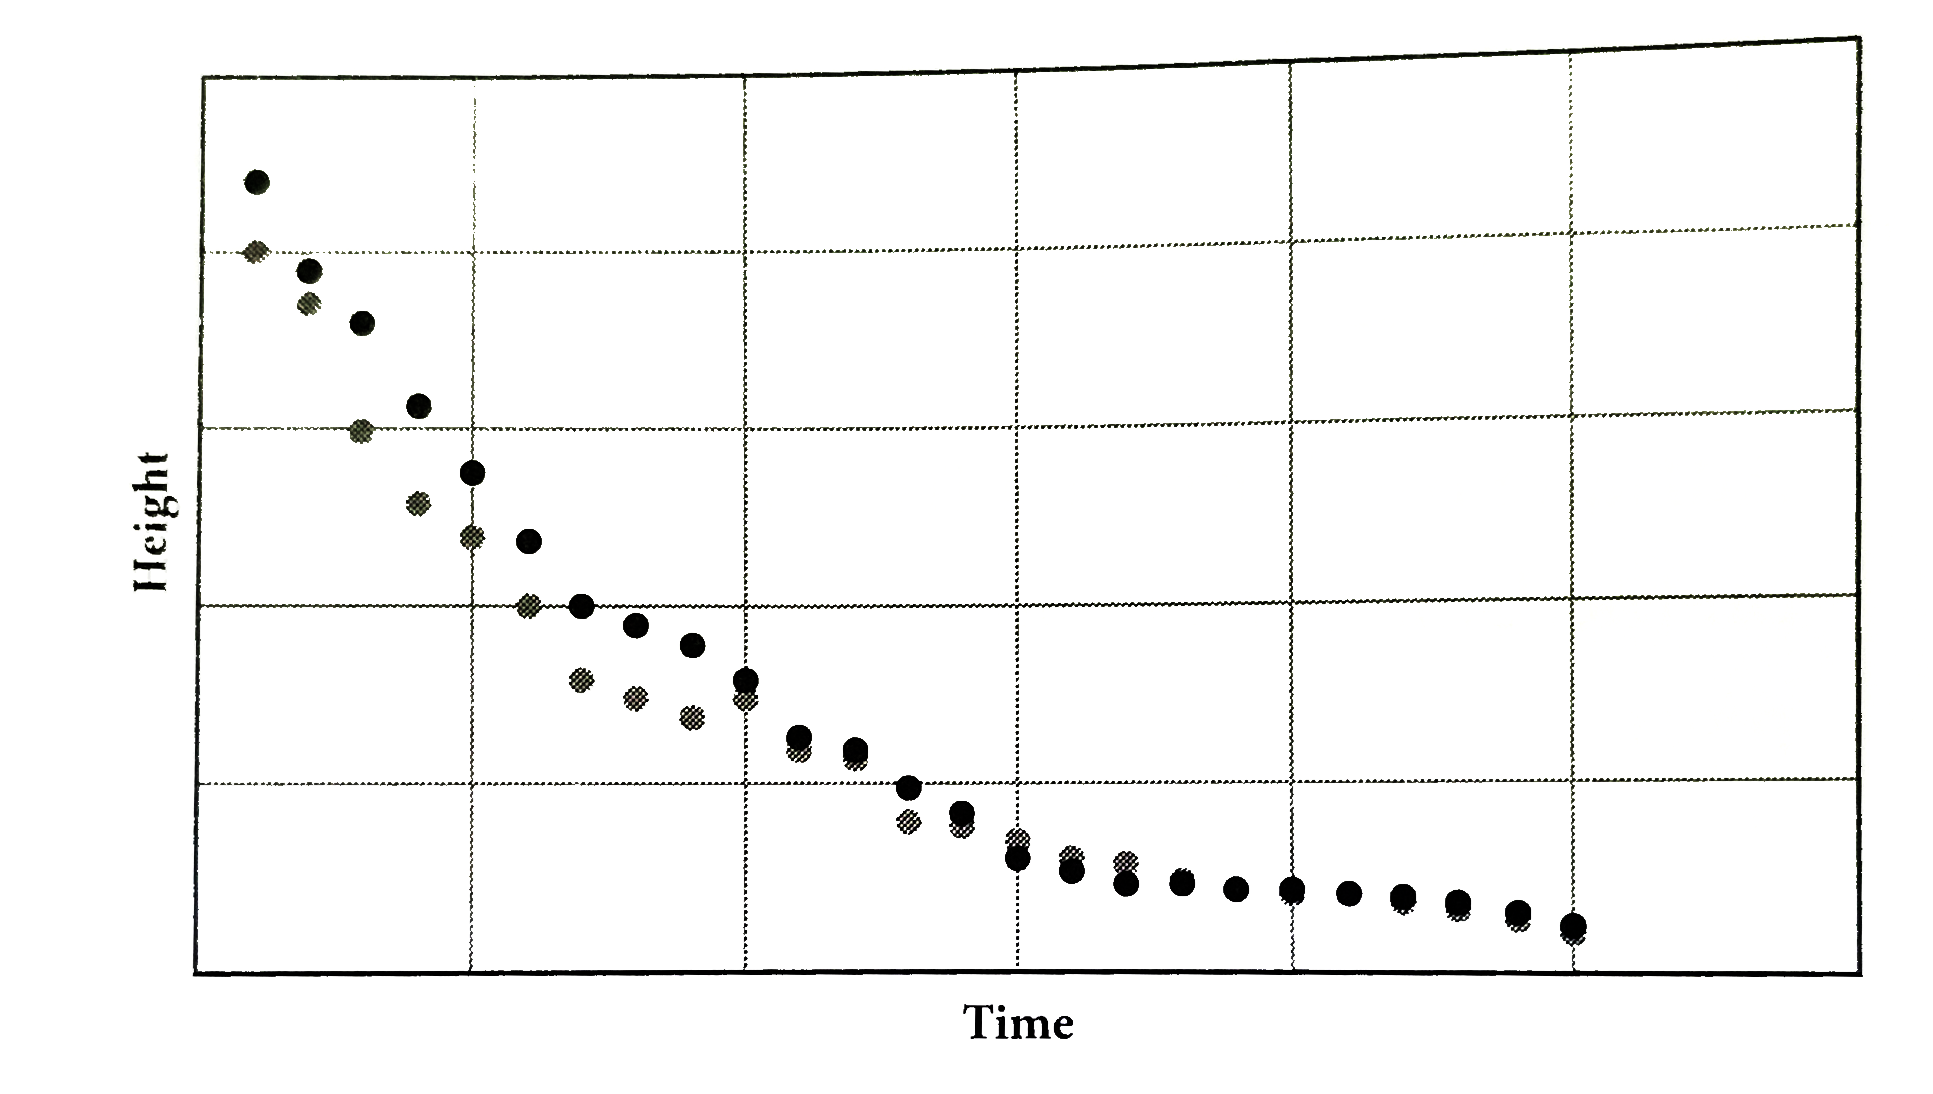
A drain at the bottom of a cylondrical water tank is opened and the height of the water is measured at regular time intervals. The tank is refilled and the process is then repeated. The scatterplot above shows the measured height on the y-axis and time on the x-axis for the trials. Which of the following conclusions can be drawn from the observations in the scatterplot?View SolutionThe following diagram represents the solution of two sets P and Q on the number line:

Which of the following is a replacement set of Q?View SolutionThe following diagram represents the solution of two sets P and Q on the number line:

Which of the following inequation has a set Q as its solution?View SolutionStudy the given pedigree chart of a certain family and select the correct conclusion which can be drawn for the character
 View Solution
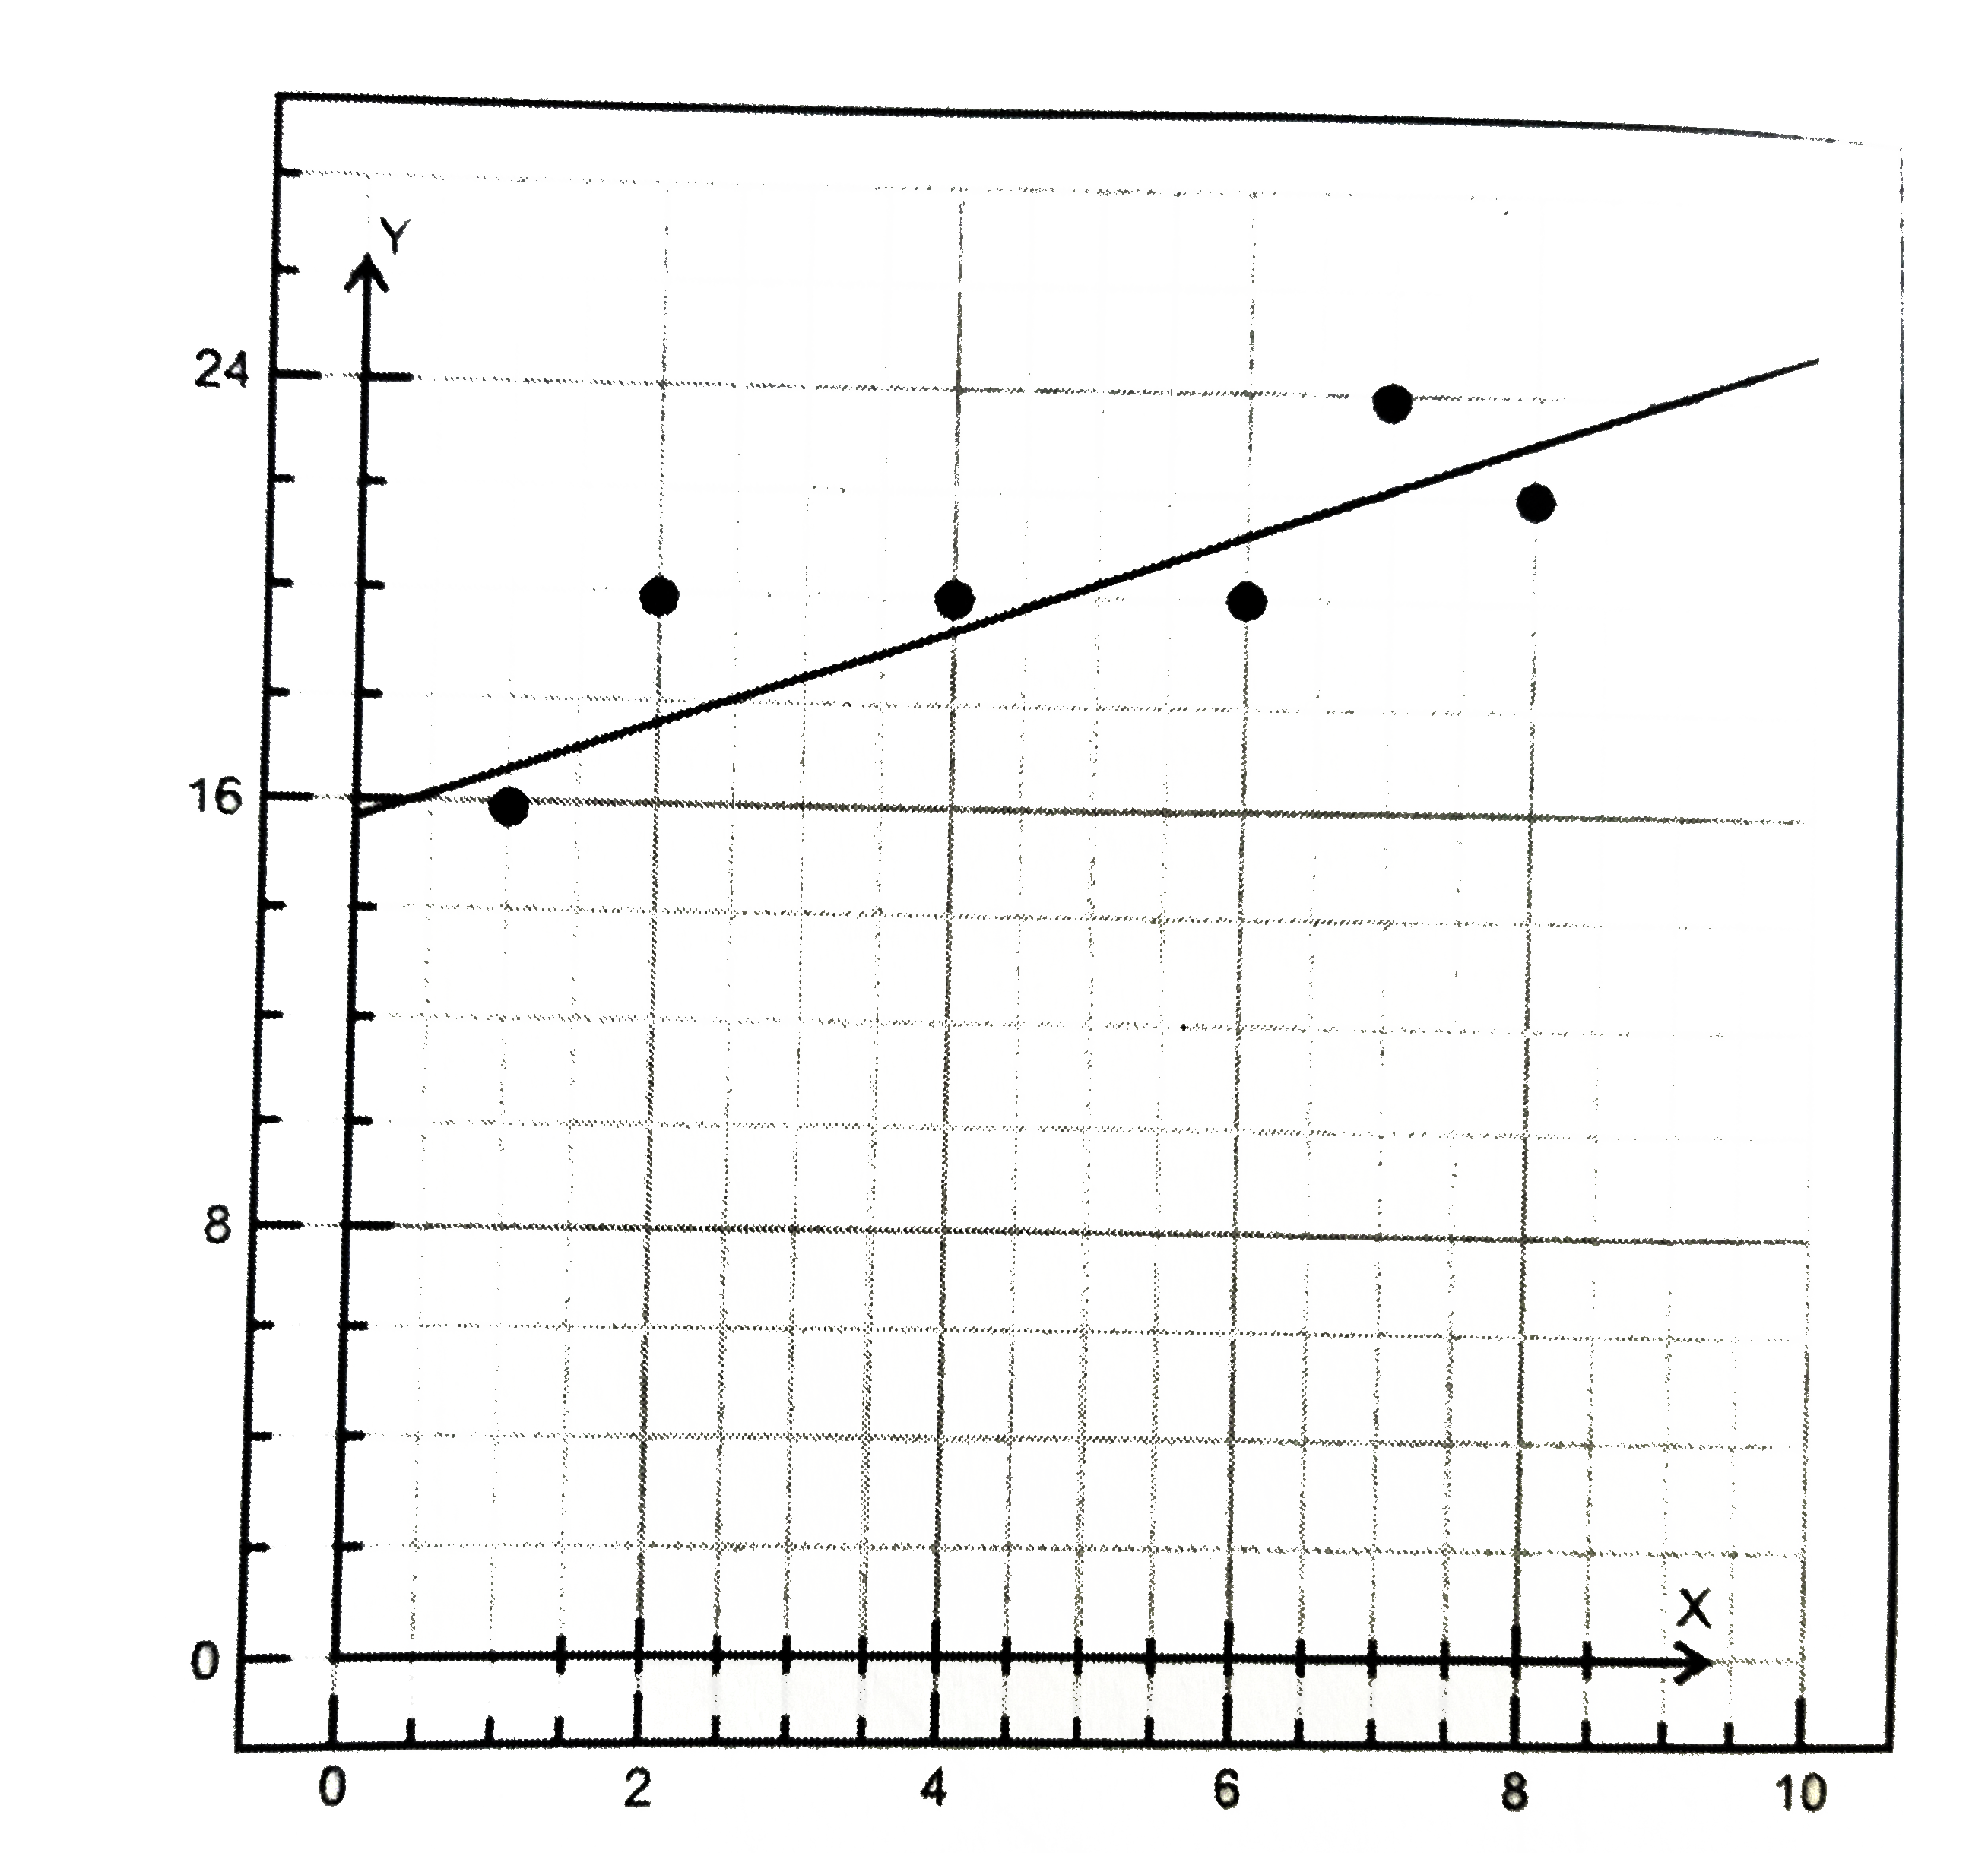
In a experiment a set of points denoted by the (x,y) coordinates are shown in the graph above along with the line of best fit. Which of the following is the best equation for the above line ?View SolutionLet N denote the number of ways in which n boys can be arranged in a line so that 3 particular boys are seperated then N is equal to
View Solution

