_2019_CBT6_E01_023_Q01.png)
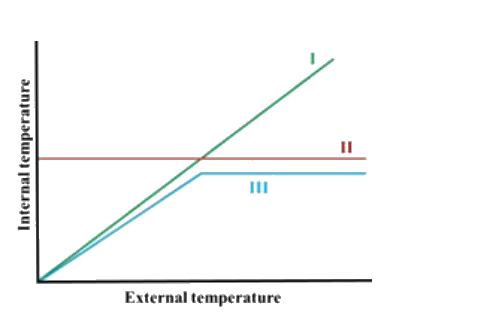
Graph I,II & III are respectively.
N2 at 300K,H2 at 300K,O2 at 400K
O2 at 400K,N2 at 300K,H2 at 300K
H2 at 300K,N2 at 300K,O2 at 400K
N2 at 300K,O2 at 400K,H2 at 300K
The correct Answer is:B
Step by step video, text & image solution for Graph I,II & III are respectively. by Chemistry experts to help you in doubts & scoring excellent marks in Class 12 exams.
Updated on:21/07/2023Topper's Solved these Questions
Similar Questions
Knowledge Check
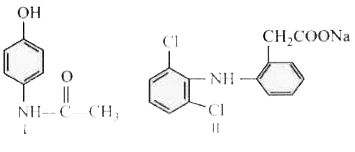
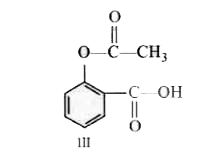
I, II and III respectively areAparacetamol, aspirin and ibuprofenBparacetamol, diclofenac sodium and aspirinCaspirin, diclofenac sodium and paracetamolDibuprofen, paracetamol and aspirin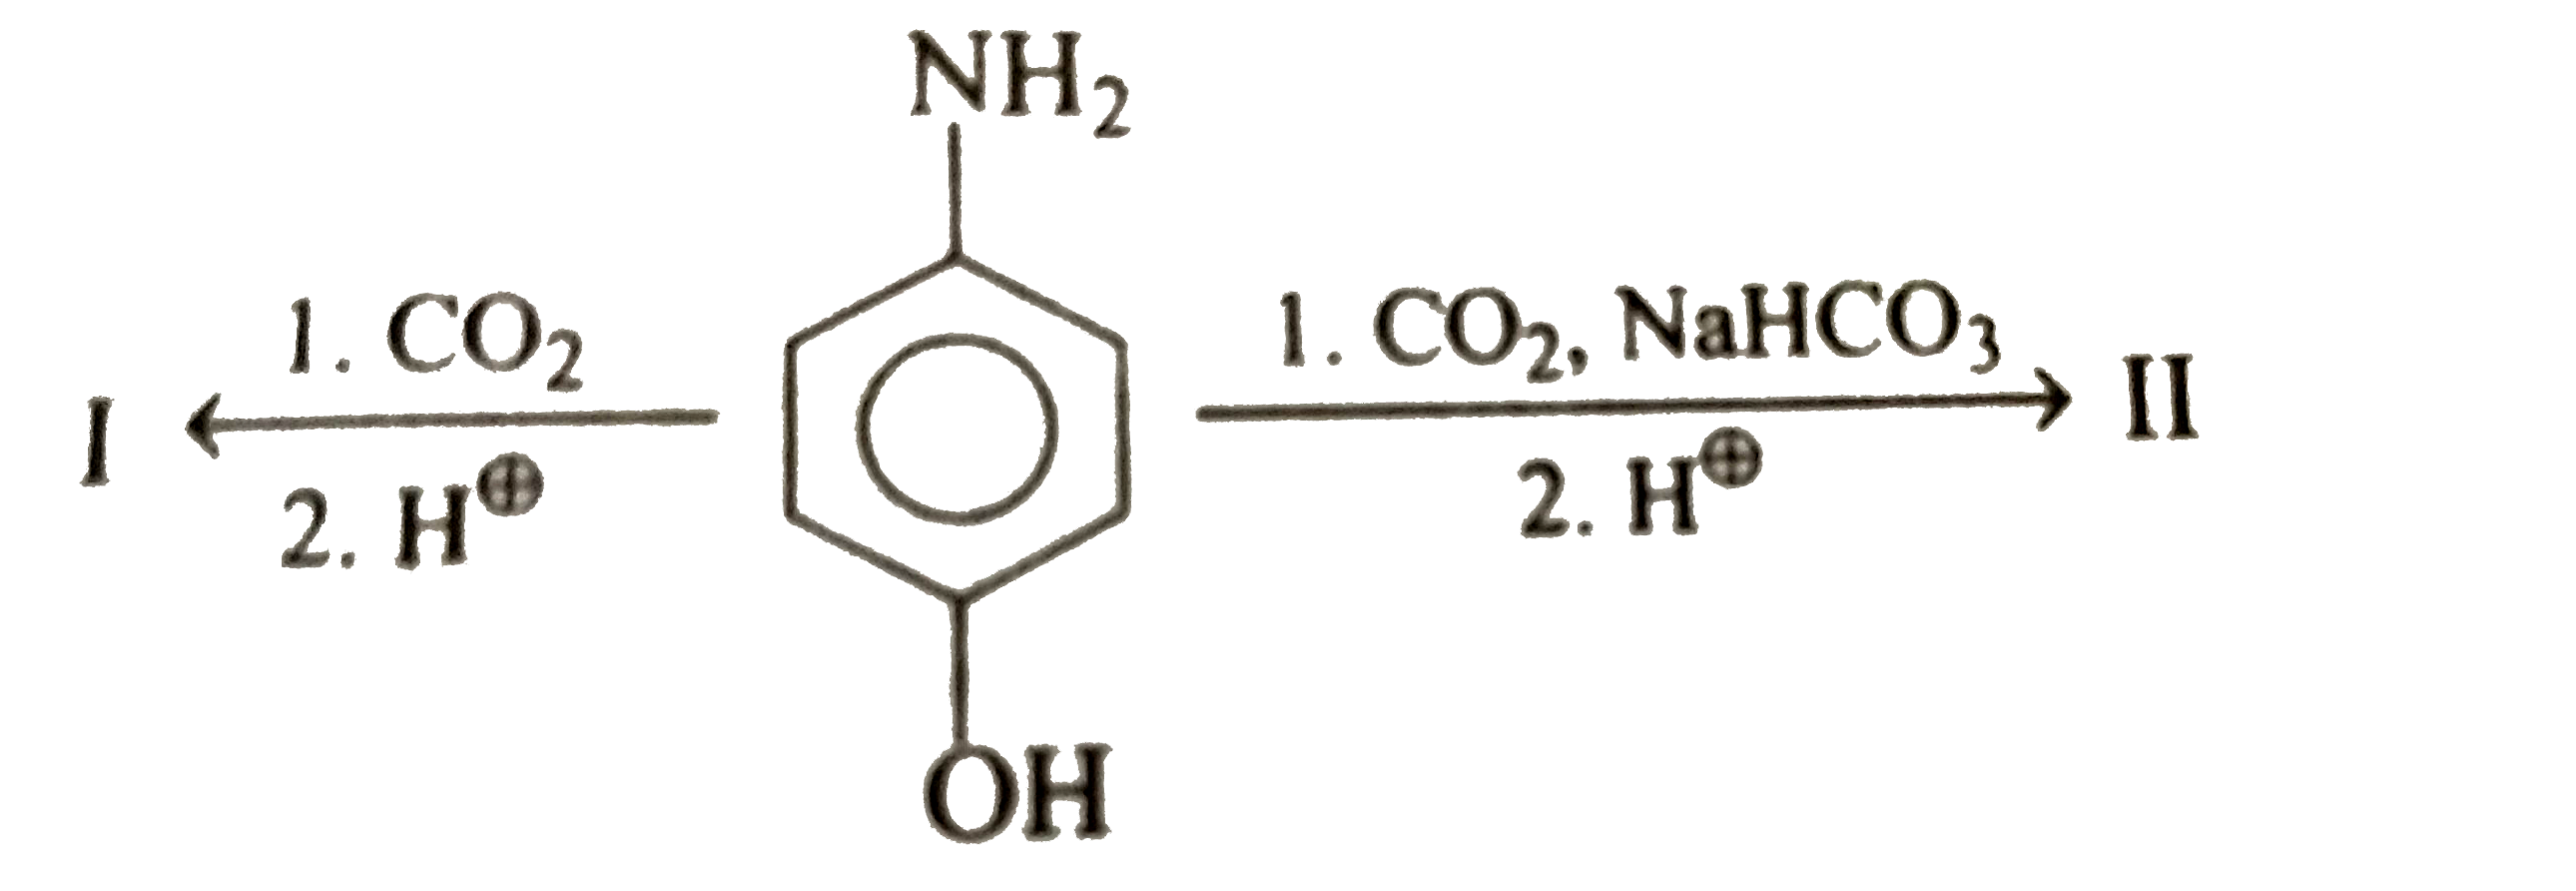
Product I and II are respectively:A B
B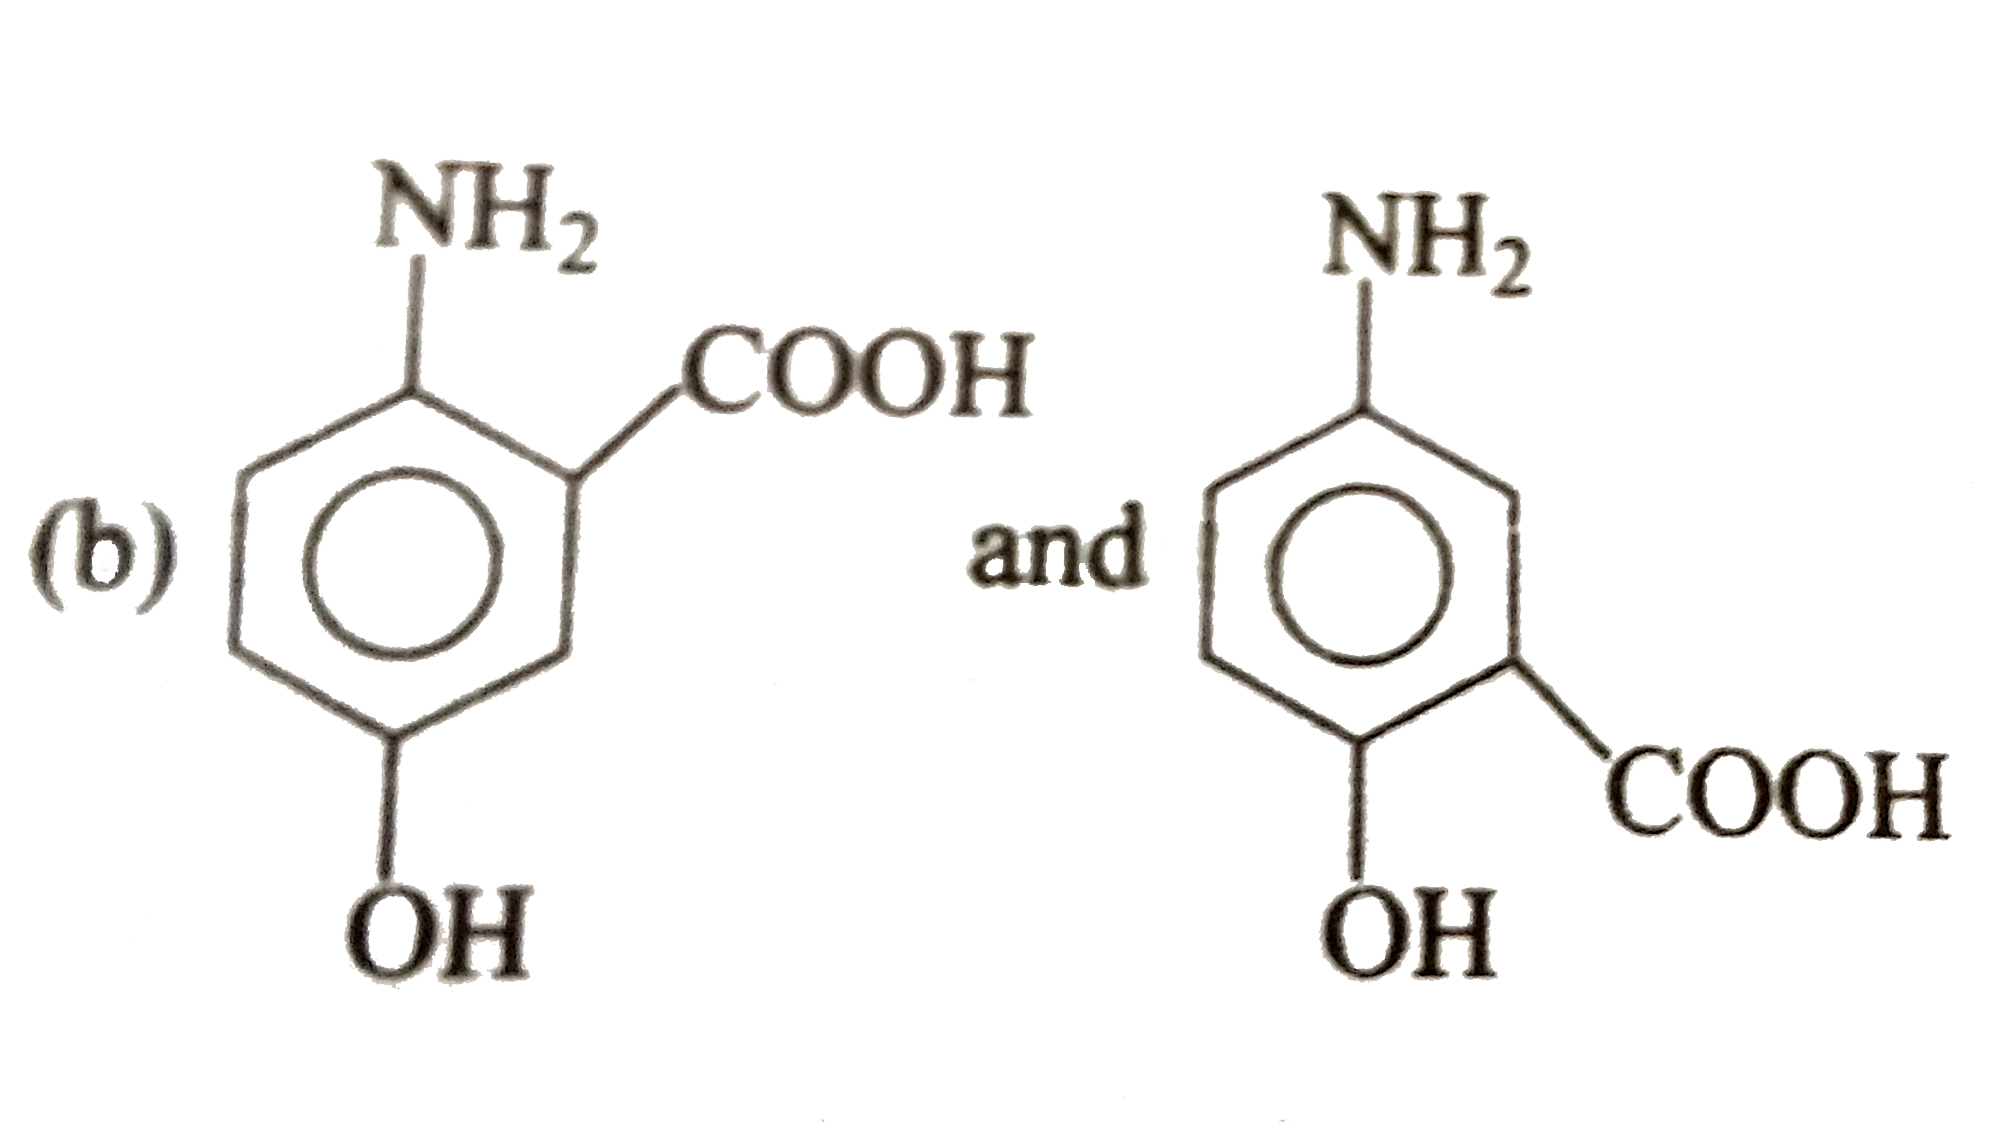 C
C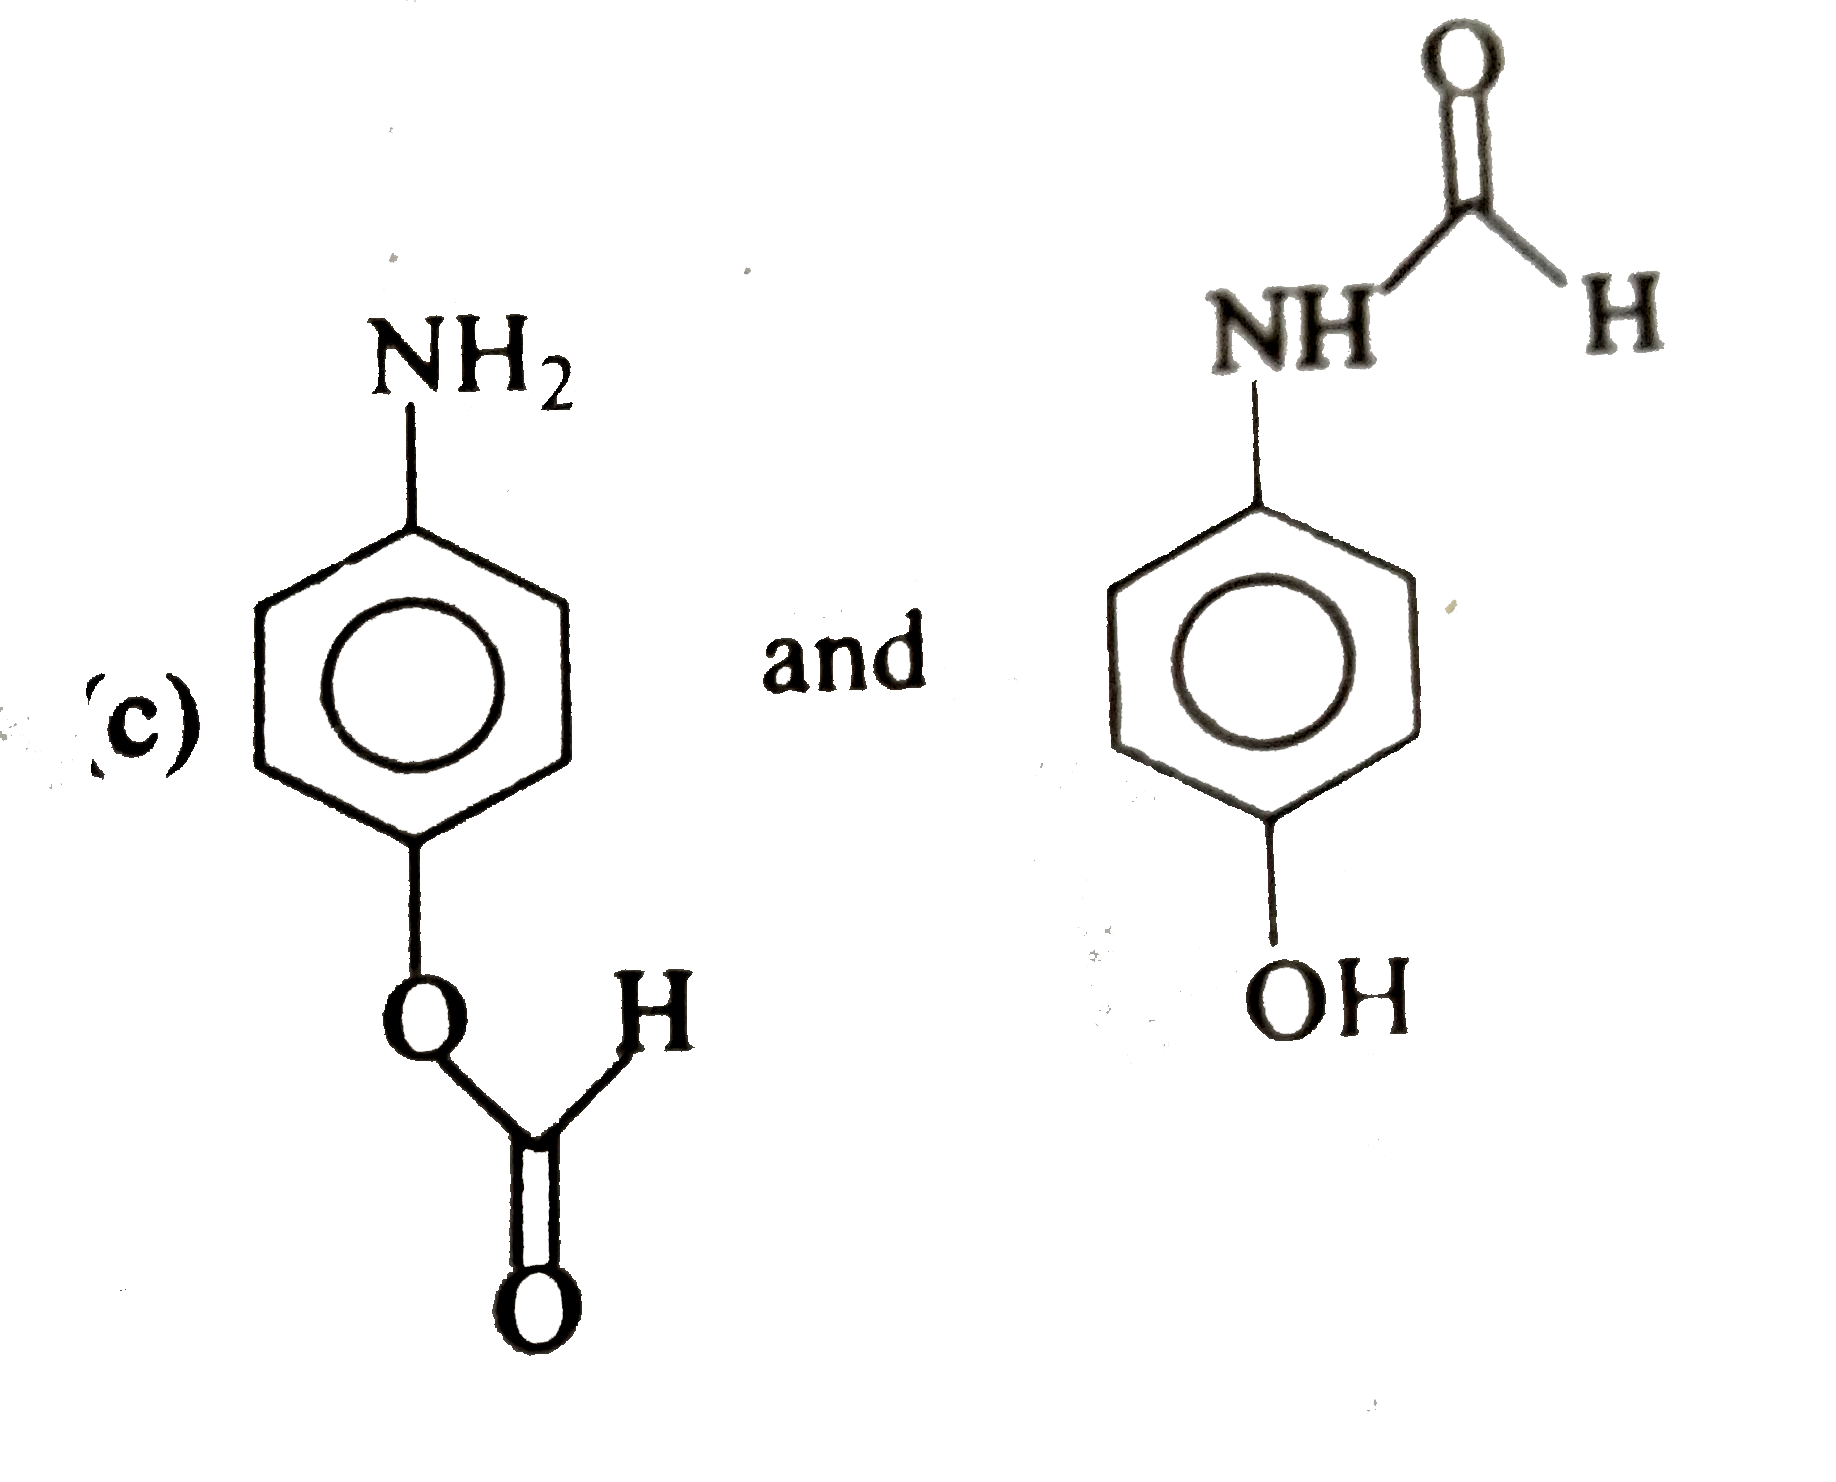 D
D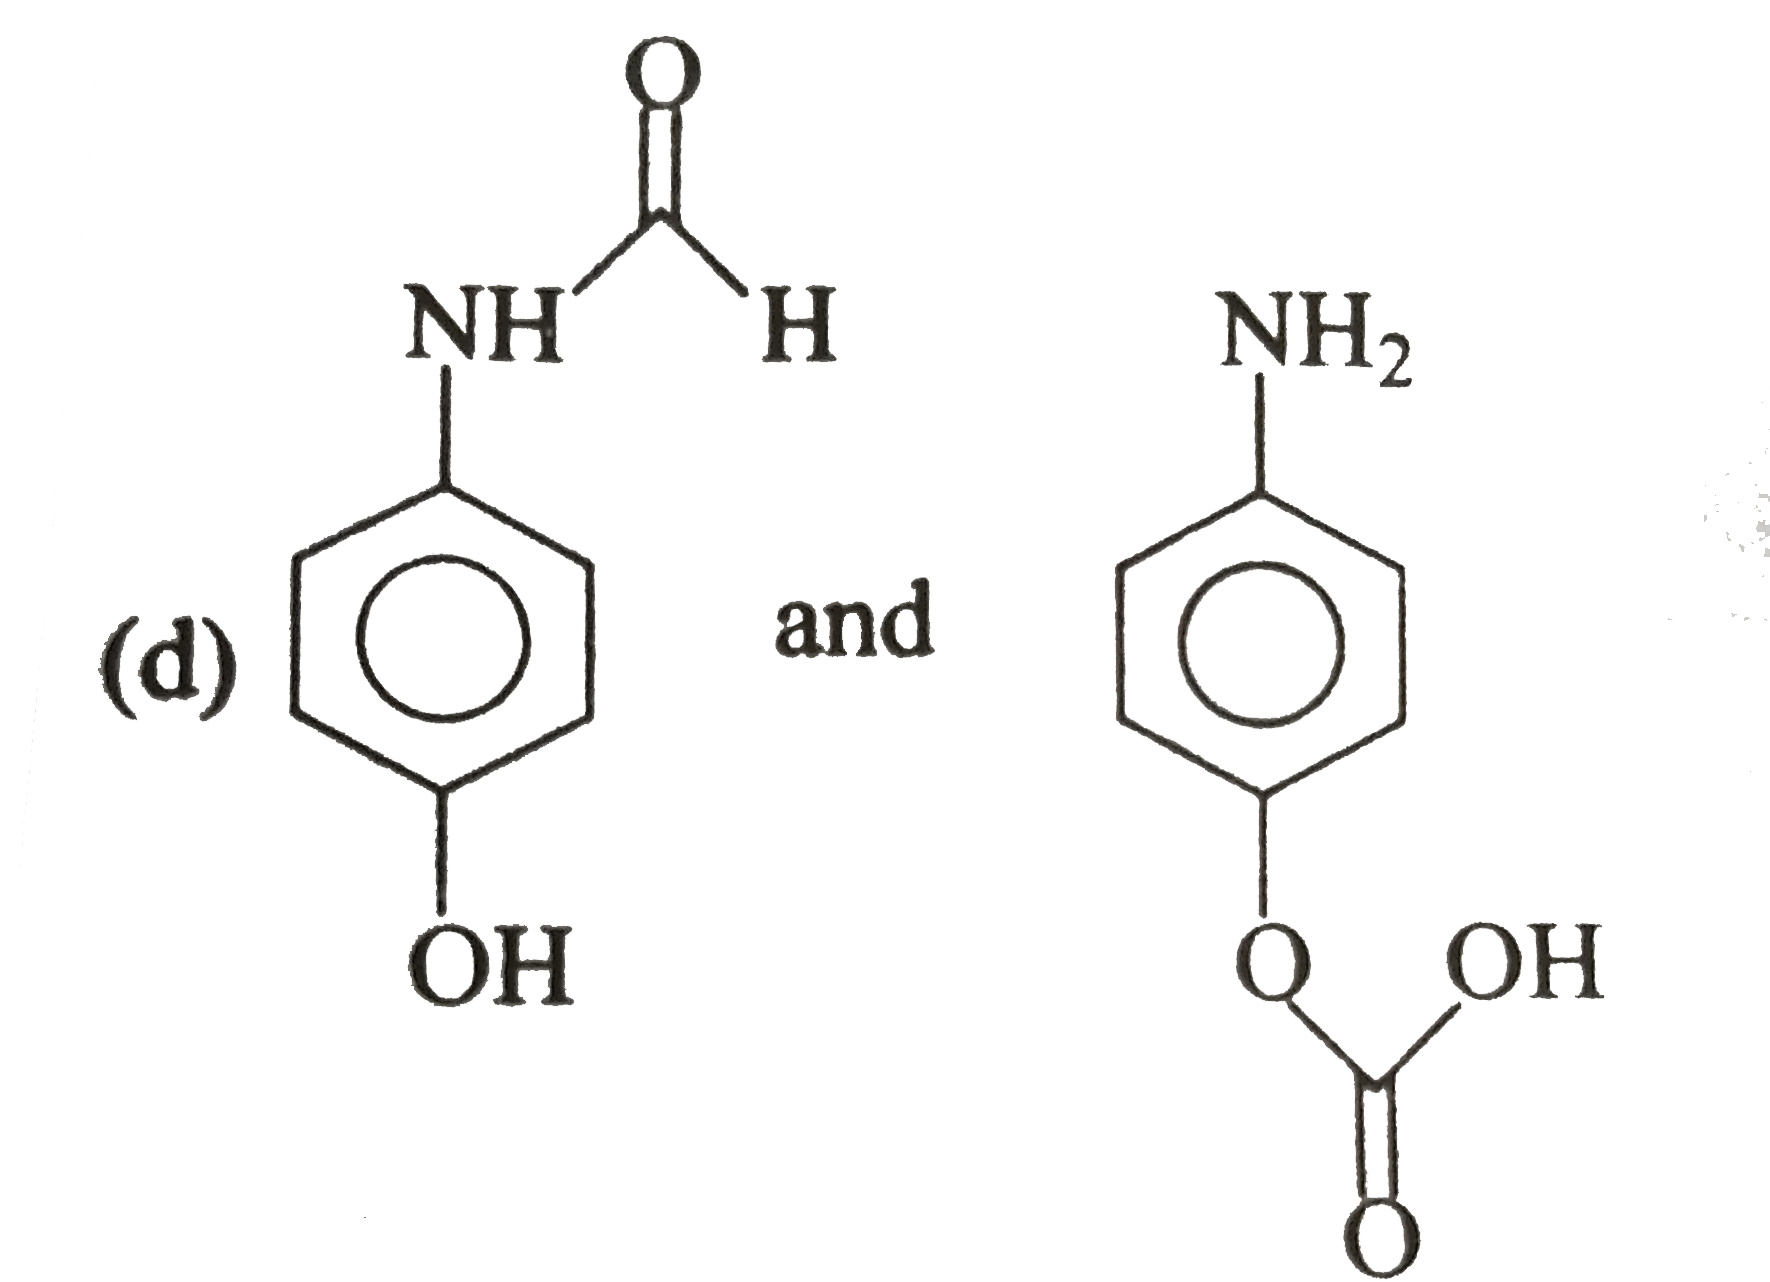

The number of disubstitution products of benzene (I), Dewar benzene (II), and prismane (III) are, respectively.A5,2 and 2B3,2 and 2C3,6 and 3D3,6 and 6
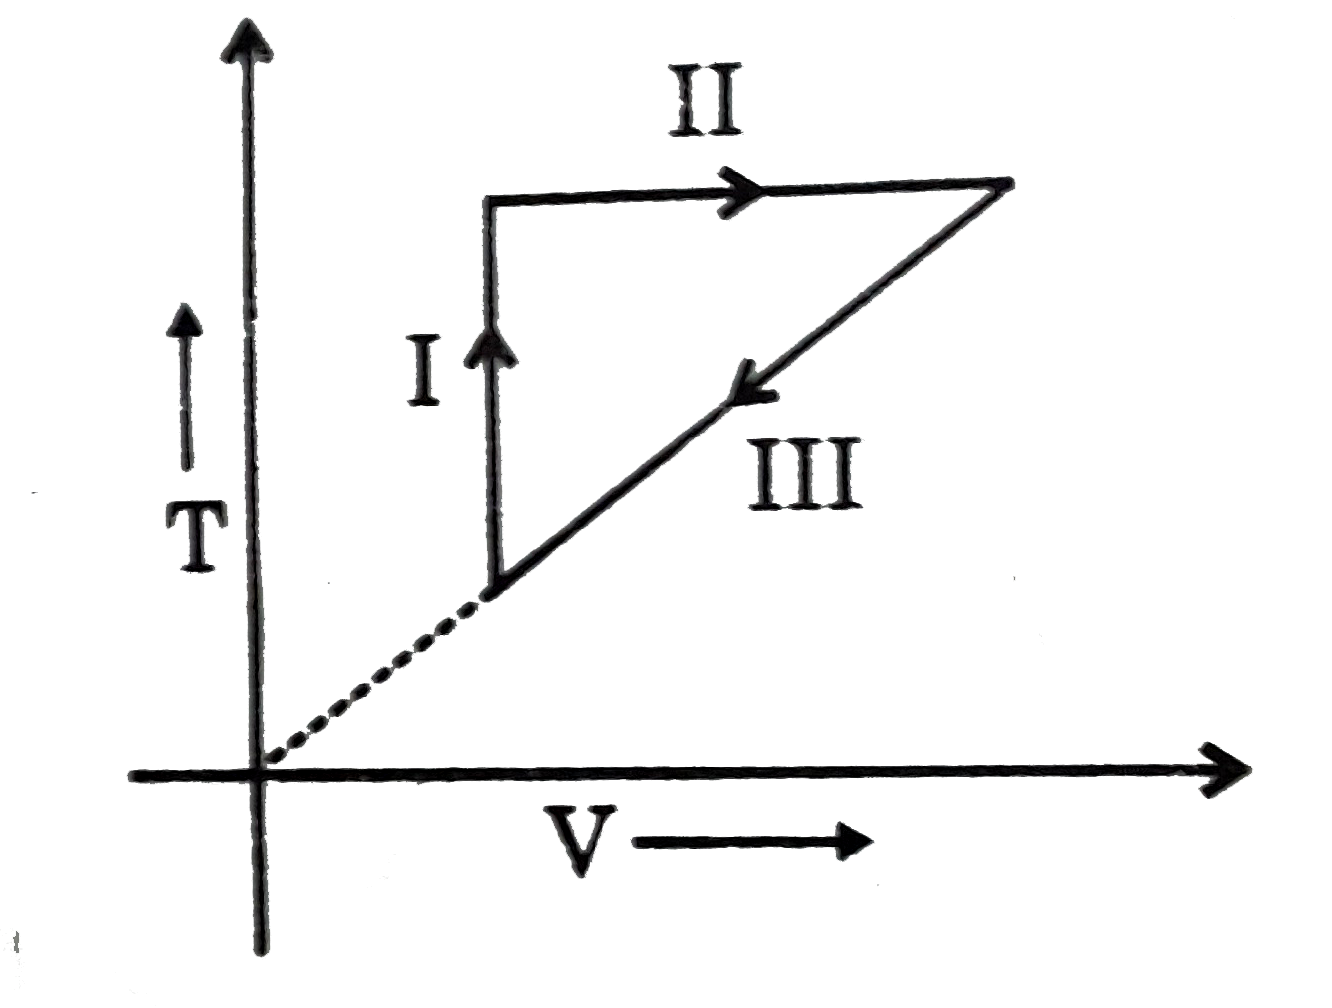
An ideal gas is subjected to various changes which are plotted as following: The correct order of process I, II and III respectively is :
View SolutionThe given illustration represents a human sperm.
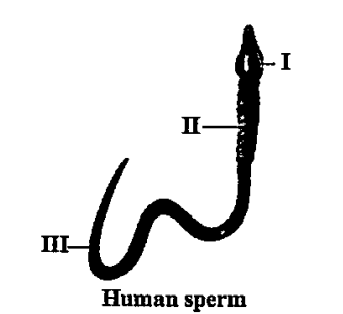
In the given illustration labels I, II and III respectively represents
View SolutionThe diagram shows the human male reproductive system.
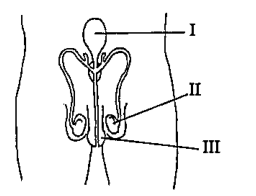
The structures labelled I, II and III respectively refer to
View SolutionIn the phase diagram showns, the point Q corresponds to the triple point of water. The region I, II and III respectively correspond to phases
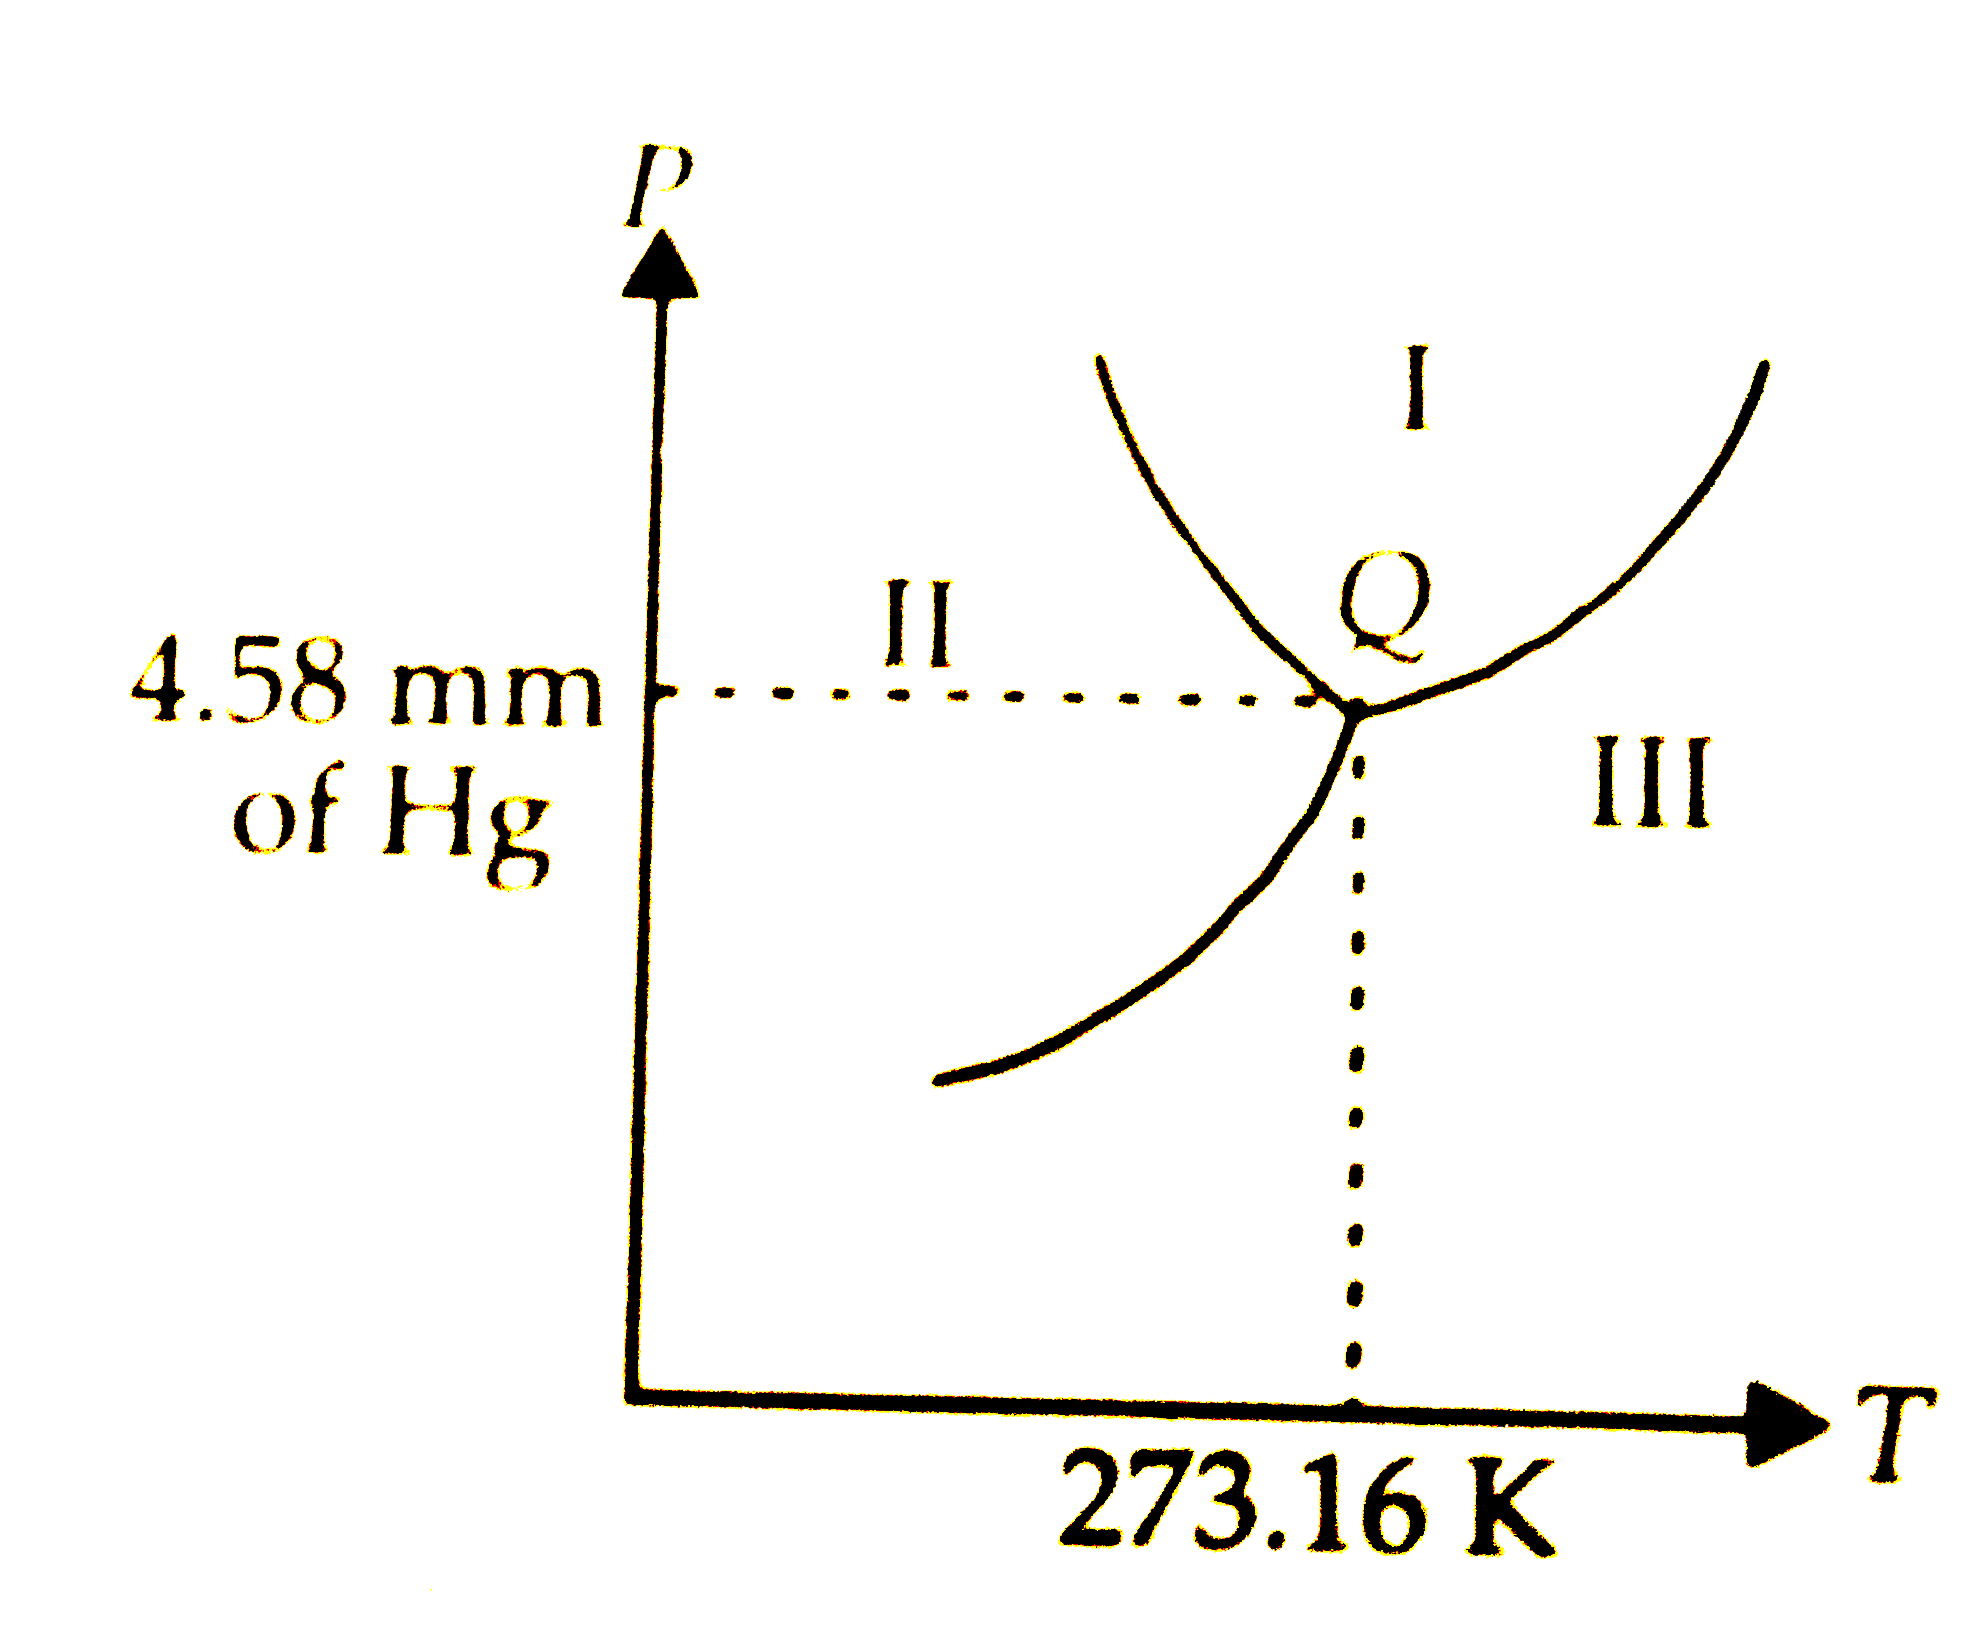
View SolutionConsider the following transformations
I CH−3→
CH−3X→
III CH−3X→
Carbon species formed in I, II and III respectively are
View Solution

