[A]: in mammalian heart there is a very swift conduction of stimulation all over the body.
[R]: Conduction of stimulation is caused by Purkinje fibres and Bundle of His
If both A and R are true and R is the correct explanation of A
If both A and R are true but R is not the correct explanation of A
If A is true and R is false
If both A and R are false
The correct Answer is:A
Step by step video, text & image solution for [A]: in mammalian heart there is a very swift conduction of stimulation all over the body. [R]: Conduction of stimulation is caused by Purkinje fibres and Bundle of His by Biology experts to help you in doubts & scoring excellent marks in Class 12 exams.
Updated on:21/07/2023Topper's Solved these Questions
Similar Questions
Draw diagram of conducting system of human heart. Label SA node and bundle of His.
View SolutionWhich is the correct route through which pulse making, impulse travels in the heart?
(A) SA node - - - - AV node - - - Bundle of His - - - - Purkinje fibres
(B) AV node - - - Bundle of His - - - - SA node - - - Purkinje fibres - - - heart muscles
(C) AV node - - - SA node - - - Purkinje fibres - - - Bundle of His - - - heart muscles
(D) SA node - - - Purkinje fibres - - - Bundle of His - - - AV node - - - heart muscles.
View Solution
Knowledge Check
A : The cardiac impulse which originates from SA node in mammalian heart cannot spread directly from atria to ventricles
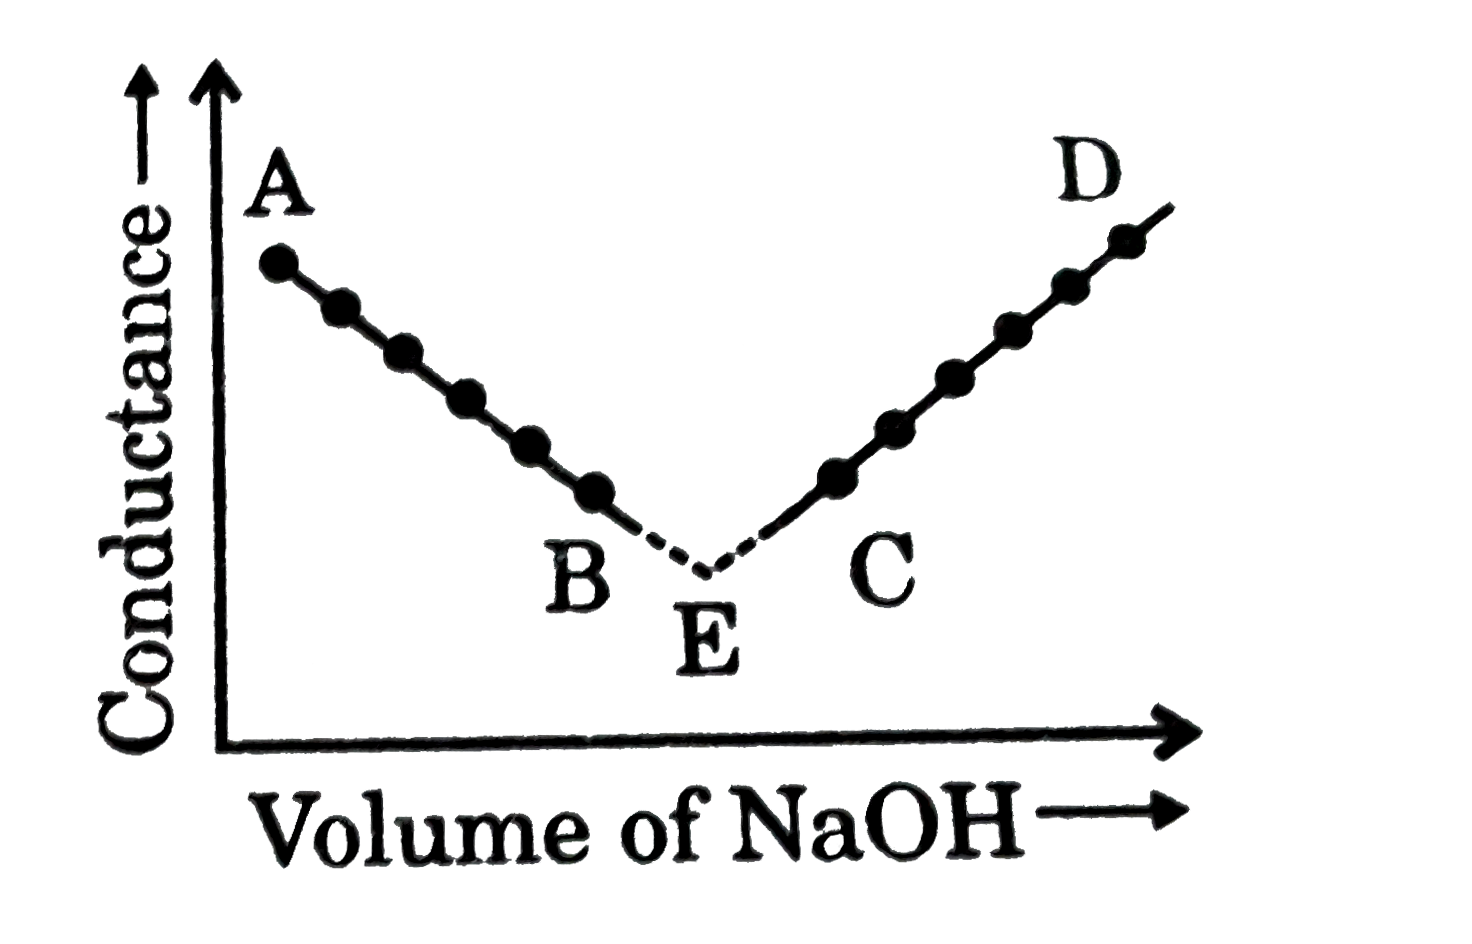
R : In mammalian heart there is no continuity between cardiac muscle fibres of atria and those of ventricles except AV bundles.AIf both Assertion & Reason are true and the reason is the correct explanation of the assertion, then mark (1).BIf both Assertion & Reason are true but the reason is not the correct explanation of the assertion, then mark (2).CIf Assertion is true statement but Reason is false, then mark (3).DIf both Assertion and Reason are false statements, then mark (4).The principle on conductometric titration is based in the fact that during the titration, one of the ions is replaced by the other and invariably thses two ions differ in the ionic conductivity with the result that the conductivity of the solution varies during the course of the titration.Take,for example,the titration between strong acid, say HCl. and a strong base, say NaOH.Before NaOH is added the conuctance of HCl solution has a high value due ti the persence if highly hydrogen ions.As NaOH is added,H+ ions are the replaced by relatively slower moving Na+ ions.Consequently, the conductance of the solution decrease and this continues right upto the enuivalence point where the solution contains only NaCL.Beyond the equivalence point if more of NaOH is added, then the solution contains an excess of the fast moving OH− with the result that its as more of NaoH added, we plot the conductance value vs the amount of NaOH added we get curve of the type shown in figure.The descending portion AB represents the conductance before the equivalence point (solution cintains a mixture if acid HCl and the salt NaCL and the ascending portion CD represents the conductances after the equivalence point (solution contains the salt NaCL and the excess of NaOH). The point E which repersents only the minimum conductance is alkali and thus repersents the equivalence point.This point can, however, be obtained by the extrapoltion of the lines AB and CD and therefore one is not very particular in location this point experimentally as it is in the case of ordinary acid -base involving the acid base indicators
LET us take the specific exaanple of acetic acid being titration against NaOH.Before the addition the of alkali, the solution shows poor conductance due to feeble inization of acetic acid.Initially the addtion of alkali causes not only the replacement of H+ by Na+ but also suppresses the thus the conductance of the solution decrease in the begnning .But very soon the conductance starts increasing as addetion NaOH thus causing neutralizes the undissociated HAc to HAc with strong condutance eletroyte Na+Ac−.The increase in conducting OH− ions gtthe graph near the highly equivalence point actual equivalence point can as usual be ontained by the extrapoiation method
In all thses graphs it been assumed that the vloume change due addition of solution from burette in negligible heane vloume change of the sloution in beaker the conuctance of which is measured is almost constant throughout the measurement
the nature of curve obtained for the titration between weak acid vs strong base as described in the above will beA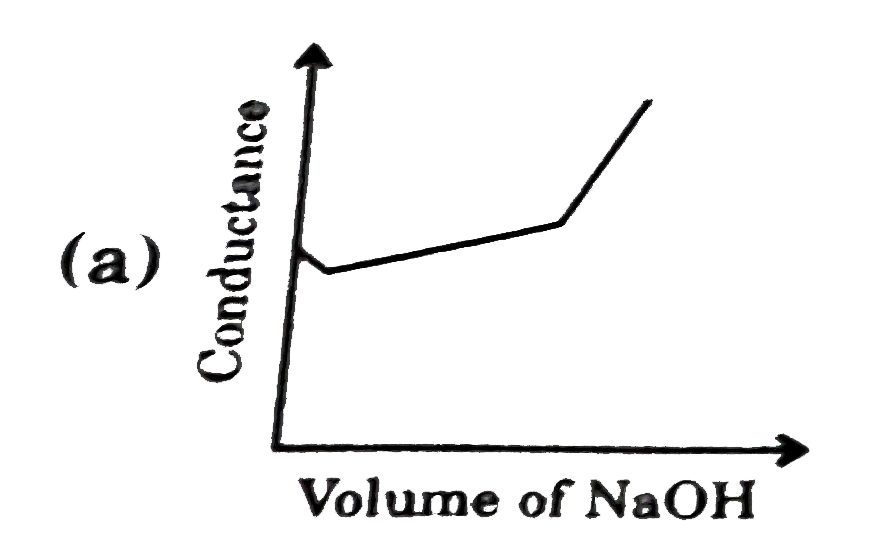 B
B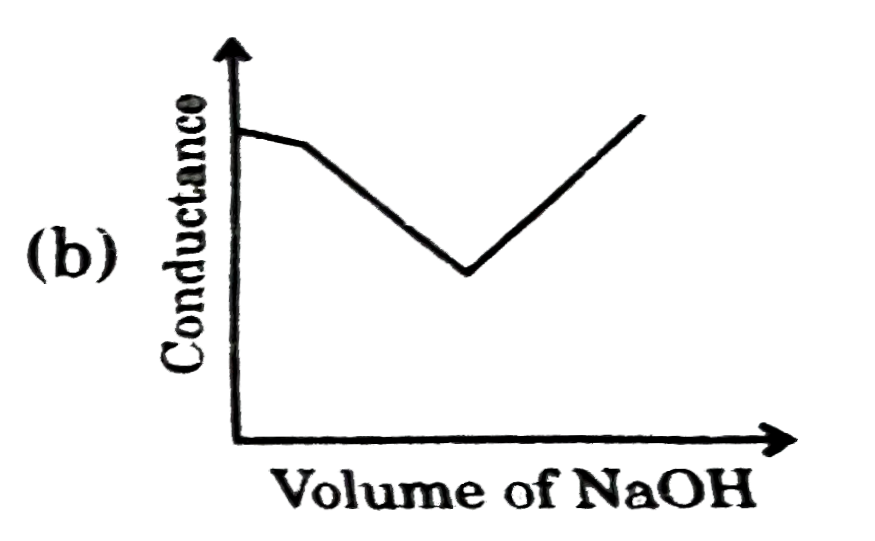 C
C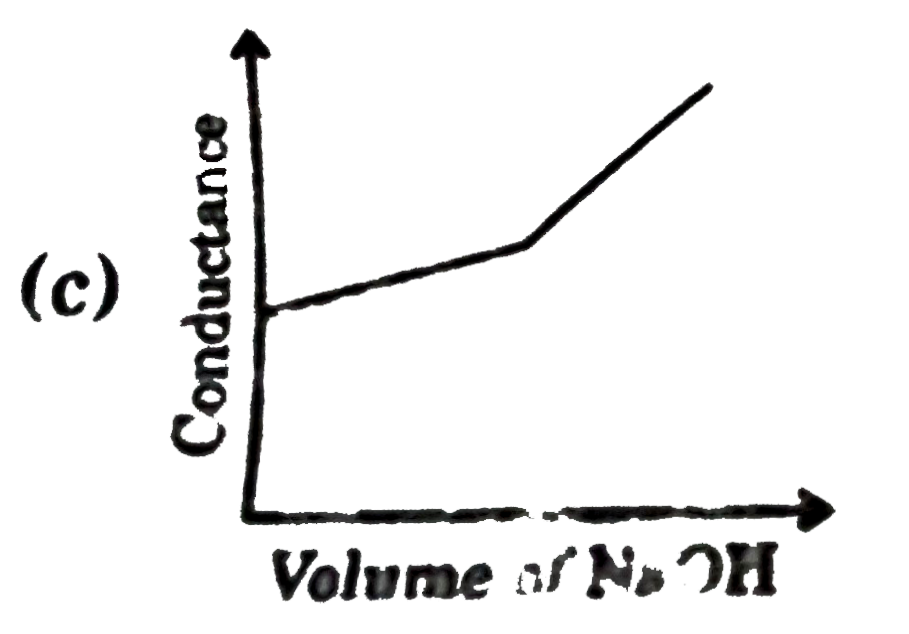 D
D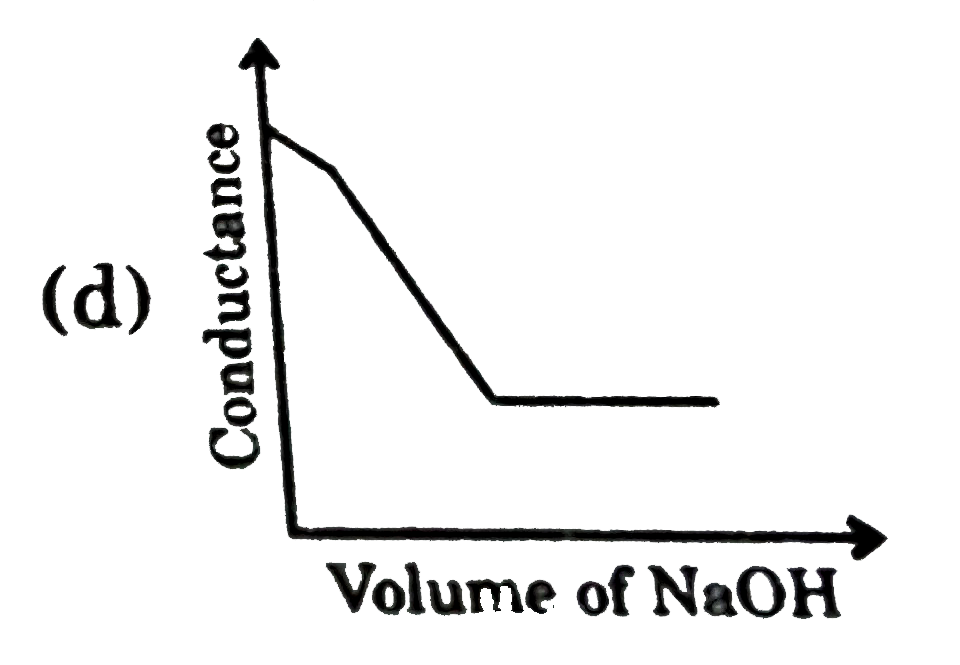
Given these structures of the conduction system of the heart
1. Bundles of His 2. AV node
3. Bundle branches
4. Purkinje fibres
5. SA node
Choose the arrangement that lists the structures in an order of an action potential passes through them.A2,5,3,1,4B5,2,1,3,4C2,5,1,3,4D5,2,4,1,3
In these following correct statement about the heart are
I. The sino-atrial node (SAN) is present in the right top corner of the right atrium
II. Ligamentum arteriosum connects the aorta and pulmonary trunk.
III. Purkinje fibres constituent a portion of the bundle of His .
IV. The pulmonary trunk connects the right ventricle to the lungs
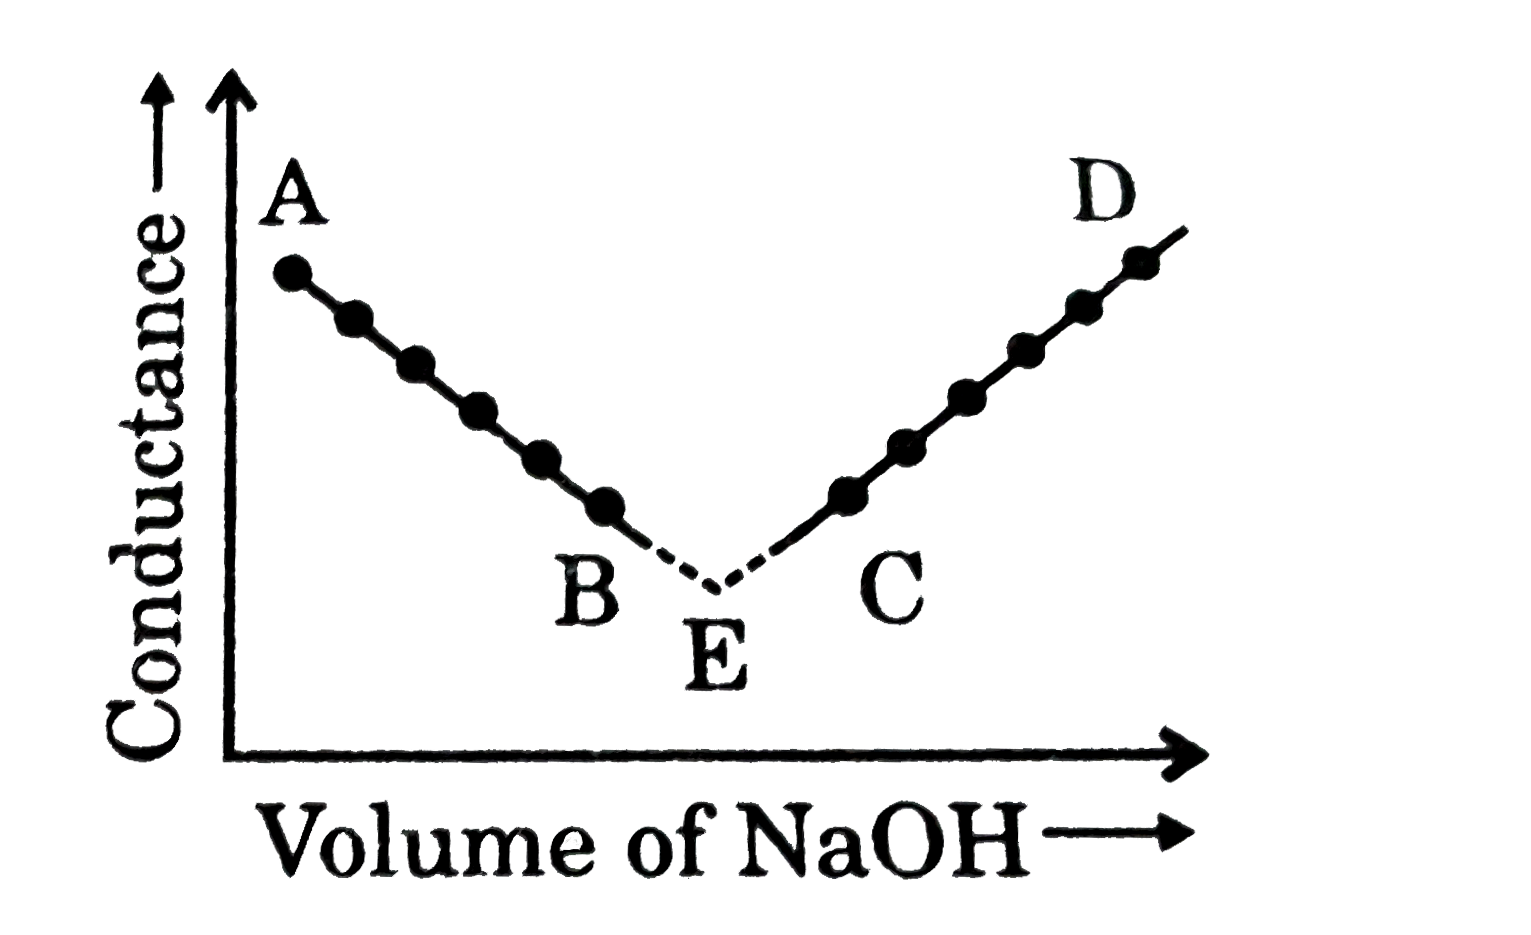
View SolutionThe principle on conductometric titration is based in the fact that during the titration, one of the ions is replaced by the other and invariably thses two ions differ in the ionic conductivity with the result that the conductivity of the solution varies during the course of the titration.Take,for example,the titration between strong acid, say HCl. and a strong base, say NaOH.Before NaOH is added the conuctance of HCl solution has a high value due ti the persence if highly hydrogen ions.As NaOH is added,H+ ions are the replaced by relatively slower moving Na+ ions.Consequently, the conductance of the solution decrease and this continues right upto the enuivalence point where the solution contains only NaCL.Beyond the equivalence point if more of NaOH is added, then the solution contains an excess of the fast moving OH− with the result that its as more of NaoH added, we plot the conductance value vs the amount of NaOH added we get curve of the type shown in figure.The descending portion AB represents the conductance before the equivalence point (solution cintains a mixture if acid HCl and the salt NaCL and the ascending portion CD represents the conductances after the equivalence point (solution contains the salt NaCL and the excess of NaOH). The point E which repersents only the minimum conductance is alkali and thus repersents the equivalence point.This point can, however, be obtained by the extrapoltion of the lines AB and CD and therefore one is not very particular in location this point experimentally as it is in the case of ordinary acid -base involving the acid base indicators
LET us take the specific exaanple of acetic acid being titration against NaOH.Before the addition the of alkali, the solution shows poor conductance due to feeble inization of acetic acid.Initially the addtion of alkali causes not only the replacement of H+ by Na+ but also suppresses the thus the conductance of the solution decrease in the begnning .But very soon the conductance starts increasing as addetion NaOH thus causing neutralizes the undissociated HAc to HAc with strong condutance eletroyte Na+Ac−.The increase in conducting OH− ions gtthe graph near the highly equivalence point actual equivalence point can as usual be ontained by the extrapoiation method
In all thses graphs it been assumed that the vloume change due addition of solution from burette in negligible heane vloume change of the sloution in beaker the conuctance of which is measured is almost constant throughout the measurement
If a 100 ml solution of 0.1 MHBr is titration using a very concentrated solution of NaOH then the conductivity (specific conductance0 of this solution at the equivalence wil be (assume volume change is negligible due addition of NaOH). Report your answer after mulitiplying it with 100 inSm−1
[Given : λ∘(Na+)=8×10⁻³Sm2mol−1,λ∘(Br−)=4×10⁻³Sm2mol−1]
View SolutionFind the correct order of the given jumbled sentences
A. So, what exactly are we eating?
B. They found that the vegetables contained very high, toxic levels of banned pesticides, and the pesticide levels were more than 1000 times the permissible levels.
C. And is our food giving rise to the many health problems today?
D. A survey conducted by the Food Safety and Standards Authority of India under the Union Agriculture Ministry tested random samples of vegetables in markets all over India.
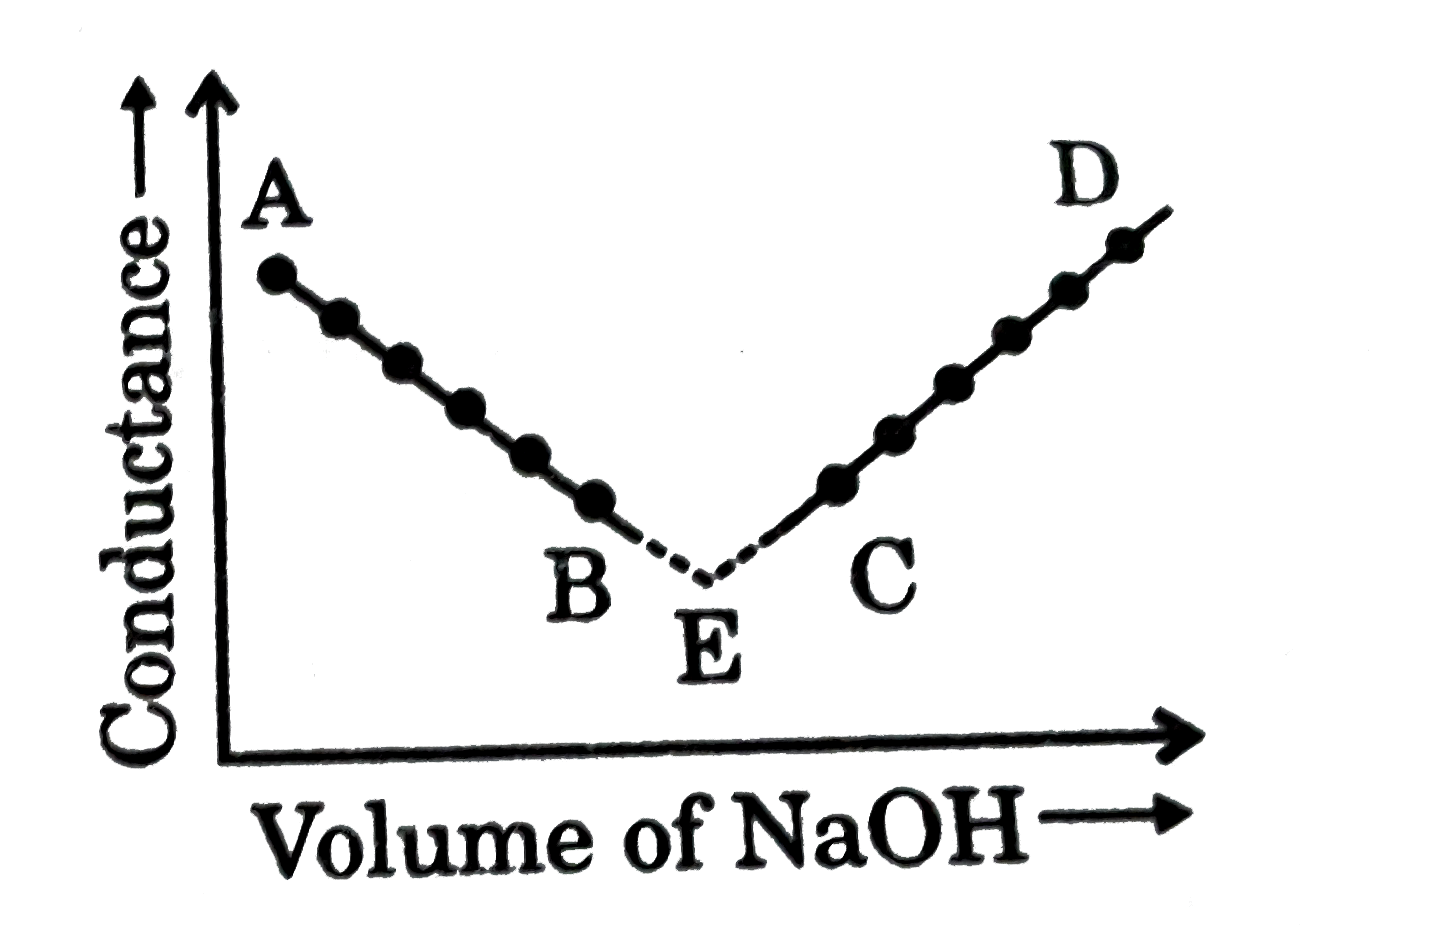
View SolutionThe principle on conductometric titration is based in the fact that during the titration, one of the ions is replaced by the other and invariably thses two ions differ in the ionic conductivity with the result that the conductivity of the solution varies during the course of the titration.Take,for example,the titration between strong acid, say HCl. and a strong base, say NaOH.Before NaOH is added the conuctance of HCl solution has a high value due ti the persence if highly hydrogen ions.As NaOH is added,H+ ions are the replaced by relatively slower moving Na+ ions.Consequently, the conductance of the solution decrease and this continues right upto the enuivalence point where the solution contains only NaCL.Beyond the equivalence point if more of NaOH is added, then the solution contains an excess of the fast moving OH− with the result that its as more of NaoH added, we plot the conductance value vs the amount of NaOH added we get curve of the type shown in figure.The descending portion AB represents the conductance before the equivalence point (solution cintains a mixture if acid HCl and the salt NaCL and the ascending portion CD represents the conductances after the equivalence point (solution contains the salt NaCL and the excess of NaOH). The point E which repersents only the minimum conductance is alkali and thus repersents the equivalence point.This point can, however, be obtained by the extrapoltion of the lines AB and CD and therefore one is not very particular in location this point experimentally as it is in the case of ordinary acid -base involving the acid base indicators
LET us take the specific exaanple of acetic acid being titration against NaOH.Before the addition the of alkali, the solution shows poor conductance due to feeble inization of acetic acid.Initially the addtion of alkali causes not only the replacement of H+ by Na+ but also suppresses the thus the conductance of the solution decrease in the begnning .But very soon the conductance starts increasing as addetion NaOH thus causing neutralizes the undissociated HAc to HAc with strong condutance eletroyte Na+Ac−.The increase in conducting OH− ions gtthe graph near the highly equivalence point actual equivalence point can as usual be ontained by the extrapoiation method
In all thses graphs it been assumed that the vloume change due addition of solution from burette in negligible heane vloume change of the sloution in beaker the conuctance of which is measured is almost constant throughout the measurement
The most appropriate titration curve ibtained when a mixture of a strong acid (say HCl) and a weak acid (sayCH3COOH0 is titration with (say NaOH) will be
View SolutionIn these questions, the 1st and The last sentence of the passage are numbered 1 and 6. The rest of the passage is split into four parts and named P, Q, R and S. These four parts are not given in their proper order. Read the sentences and find out which of the four combinations is correct.
1. 'Acu' means needles in Latin.
P. The needles stimulates specific nerves that transmit electrical impulses via the spinal cord and brain to the affected area.
Q. Quite appropriately, then, acu-puncture consists of inserting very fine needles at specific points on the skin located near nerve endings.
R. Acupuncture also stimulates the release of chemical substances from the brain centres and pitulary glands.
S. These are connected to one an other by lines called channels or meridians.
6. Known as endorphins and encephalins, which are released and carried across the blood stream, these chemicals are the body's own pain-relief mechanism.
View Solution
