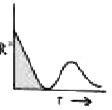
Draw probability distribution curves for 1s and 2s electrons. What observations are made from the graph ?
To solve the question of drawing probability distribution curves for 1s and 2s electrons and making observations from the graphs, we can follow these steps:
1. Understanding Probability Distribution:
- The probability distribution of an electron in an atom describes the likelihood of finding an electron at a certain distance from the nucleus. This is represented by the square of the wave function (ψ²).
2. Drawing the 1s Probability Distribution Curve:
- For the 1s electron, the probability density function is highest at the nucleus and decreases as the distance from the nucleus increases.
- The graph is plotted with the radial distance (r) on the x-axis and the probability density (ψ²) on the y-axis. The curve starts high at the origin (nucleus) and decreases smoothly towards zero as r increases.
3. Drawing the 2s Probability Distribution Curve:
- The 2s electron also has a probability distribution that is highest near the nucleus but has a different shape due to the presence of nodes.
- The graph for 2s starts high at the nucleus, decreases to zero at a certain distance (node), then increases again before decreasing to zero again. This results in a curve with a node (a point where the probability is zero).
4. Labeling the Graphs:
- Clearly label the 1s and 2s curves on the graph. The 1s curve will show a single peak, while the 2s curve will show two peaks with a node in between.
5. Observations from the Graphs:
- 1s Curve: The probability of finding an electron is maximum near the nucleus and decreases rapidly with distance.
- 2s Curve: The probability also starts high near the nucleus, but has a node where the probability is zero, indicating a region where the electron is not likely to be found.
- The 2s electron has a more complex distribution compared to the 1s electron, indicating the presence of nodes.
Observations:
- The 1s electron is most likely to be found close to the nucleus, while the 2s electron has a more complex distribution with regions of higher and lower probability.
- The presence of nodes in the 2s distribution indicates that there are specific distances from the nucleus where the electron cannot be found.
- The probability distribution for 2s shows that as the distance from the nucleus increases, the likelihood of finding the electron can increase again after the first node.
- The probability distribution of an electron in an atom describes the likelihood of finding an electron at a certain distance from the nucleus. This is represented by the square of the wave function (ψ²).
- For the 1s electron, the probability density function is highest at the nucleus and decreases as the distance from the nucleus increases.
- The graph is plotted with the radial distance (r) on the x-axis and the probability density (ψ²) on the y-axis. The curve starts high at the origin (nucleus) and decreases smoothly towards zero as r increases.
- The 2s electron also has a probability distribution that is highest near the nucleus but has a different shape due to the presence of nodes.
- The graph for 2s starts high at the nucleus, decreases to zero at a certain distance (node), then increases again before decreasing to zero again. This results in a curve with a node (a point where the probability is zero).
- Clearly label the 1s and 2s curves on the graph. The 1s curve will show a single peak, while the 2s curve will show two peaks with a node in between.
- 1s Curve: The probability of finding an electron is maximum near the nucleus and decreases rapidly with distance.
- 2s Curve: The probability also starts high near the nucleus, but has a node where the probability is zero, indicating a region where the electron is not likely to be found.
- The 2s electron has a more complex distribution compared to the 1s electron, indicating the presence of nodes.
- The 1s electron is most likely to be found close to the nucleus, while the 2s electron has a more complex distribution with regions of higher and lower probability.
- The presence of nodes in the 2s distribution indicates that there are specific distances from the nucleus where the electron cannot be found.
- The probability distribution for 2s shows that as the distance from the nucleus increases, the likelihood of finding the electron can increase again after the first node.
Topper's Solved these Questions
- STRUCTURE OF ATOMBOOK - PRADEEPCHAPTER - STRUCTURE OF ATOMEXERCISE - Additional Questions (Long Answer Questions)
16 Videos
- STRUCTURE OF ATOMBOOK - PRADEEPCHAPTER - STRUCTURE OF ATOMEXERCISE - Analytical Questions And Problems with Answers/solutions (Questions)
25 Videos
- STRUCTURE OF ATOMBOOK - PRADEEPCHAPTER - STRUCTURE OF ATOMEXERCISE - Additional Questions (Very Short Answer Questions)
51 Videos
- STATES OF MATTER: SOLID MATTERBOOK - PRADEEPCHAPTER - STATES OF MATTER: SOLID MATTEREXERCISE - COMPETITION FOCUS (ASSERTION-REASON)
17 Videos
- THERMODYNAMICSBOOK - PRADEEPCHAPTER - THERMODYNAMICSEXERCISE - MULTIPLE CHOICE QUESTION ( BASED ON PRACTICAL CHEMISTRY)
3 Videos
Similar Questions
Probability density curve for 3s orbital
View Solution(a) What is radial probability distribution curve ? Draw radial probability distribution curves for 1s and 2s orbitals.
(b) Discuss the similarities and difference between 1s and 2s orbitals.
(c ) How many nodes are present in 1s and 2s orbitals ?
View Solution
Knowledge Check
The probability density curve for 2s electron appears like
A B
B C
C D
D
The probability density curve for 2s electron appears like
A B
B C
C D
D

Radial probability distribution curve is shown for s-orbital. The curve is:A1sB2sC3sD4s
In Maxwell’s velocity distribution curve area under the graph
View SolutionFor a mutielectron atom, the maximum of 2p-orbital in radial probability distribution graph is nearer the nucleus than that of 2s-orbital . Therefore, 2p-orbital should be closer to the nucleus and lower in energy than 2s-orbital. But 2s-orbital has lower energy than 2p-orbital. Explain.
View SolutionDraw the electron dot structures for
H2S
View SolutionThe prodensity curve for 2s electrons appears like
View SolutionThe radial distribution curve of 2s sub-level consists of x nodes. Value of x is :
View Solution
