Semilog of per minutes growing bacteria is plotted against time. What will be shape of graph?
Sigmoid
Hyperbolic
Ascending straight line
Descending straight line
The correct Answer is:C
Rate of increase of bacteria →dNdt

dNdt=μN⇒N=N0eμt
⇒ log N = log N0+μt
(y =mx +c , y=log N , m=μ, x=t)
Topper's Solved these Questions
- NEETBOOK - NEET PREVIOUS YEAR (YEARWISE + CHAPTERWISE)CHAPTER - NEETEXERCISE - BIOLOGY
306 Videos
- NEETBOOK - NEET PREVIOUS YEAR (YEARWISE + CHAPTERWISE)CHAPTER - NEETEXERCISE - QUESTION
187 Videos
- NEETBOOK - NEET PREVIOUS YEAR (YEARWISE + CHAPTERWISE)CHAPTER - NEETEXERCISE - MCQ
184 Videos
- MORPHOLOGY OF FLOWERING PLANTSBOOK - NEET PREVIOUS YEAR (YEARWISE + CHAPTERWISE)CHAPTER - MORPHOLOGY OF FLOWERING PLANTSEXERCISE - Exercise
91 Videos
- NEET 2018BOOK - NEET PREVIOUS YEAR (YEARWISE + CHAPTERWISE)CHAPTER - NEET 2018EXERCISE - Exercise
90 Videos
Similar Questions
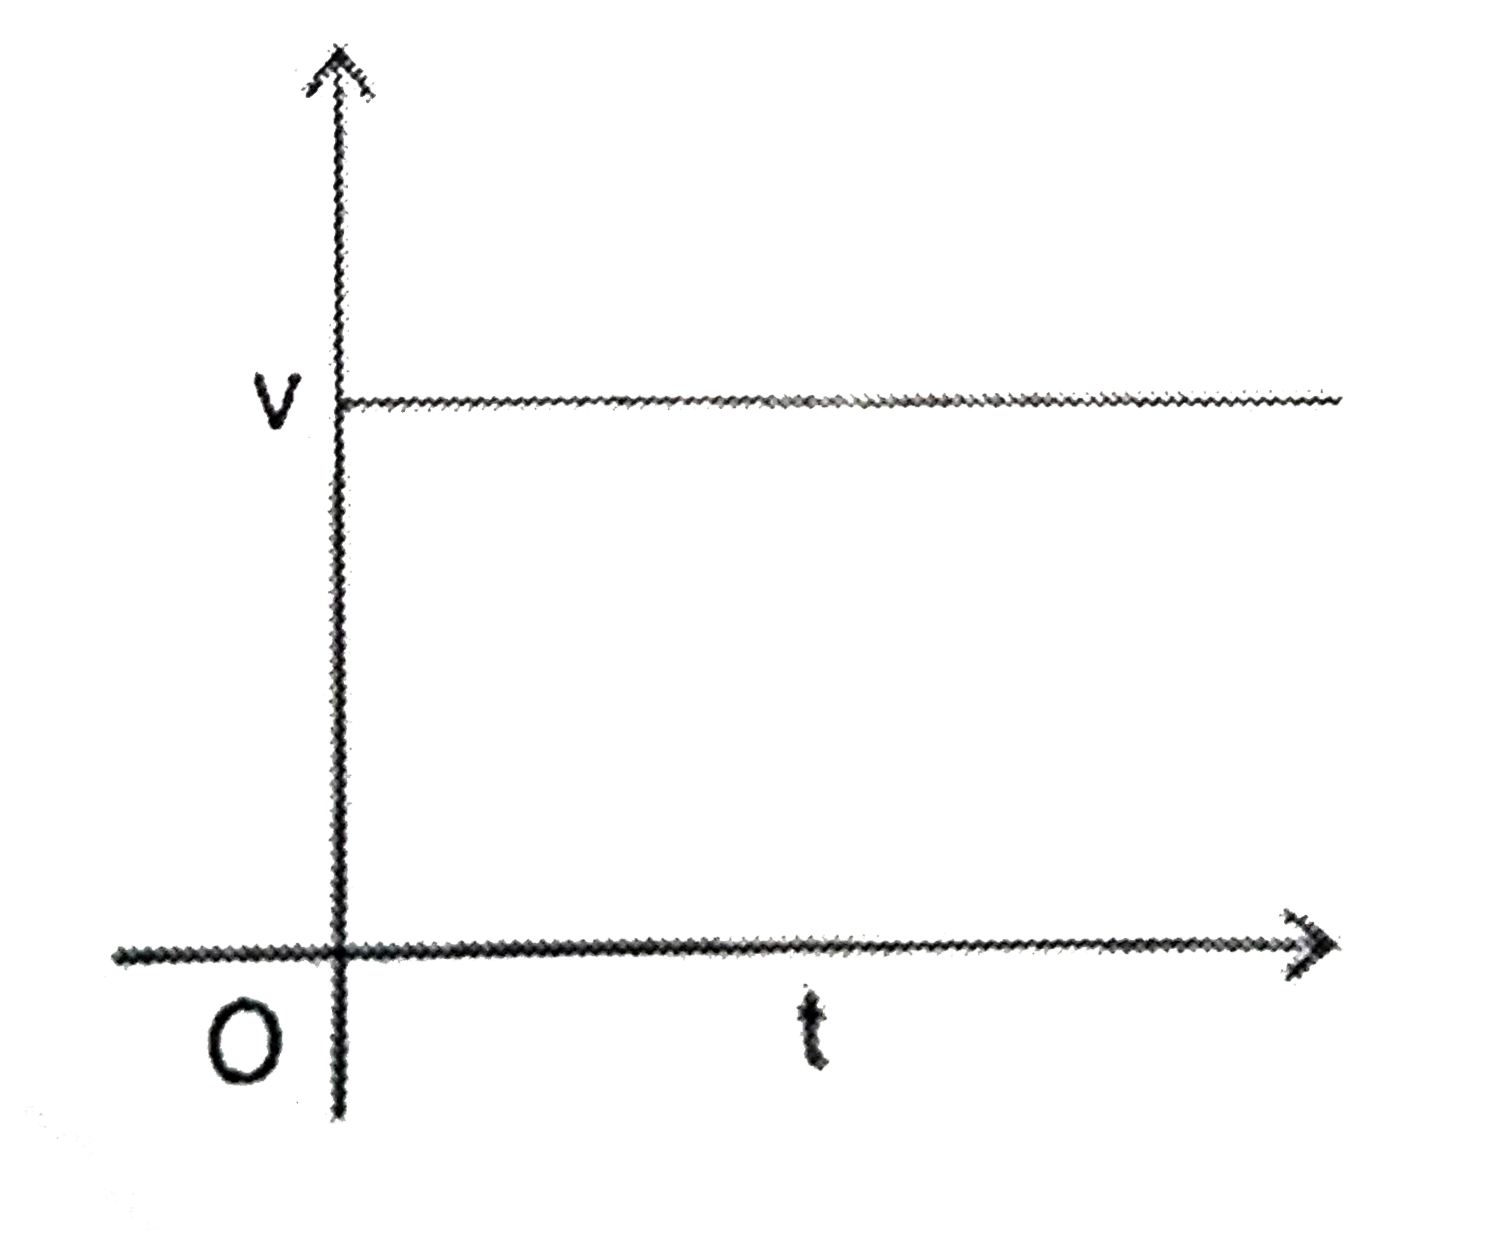
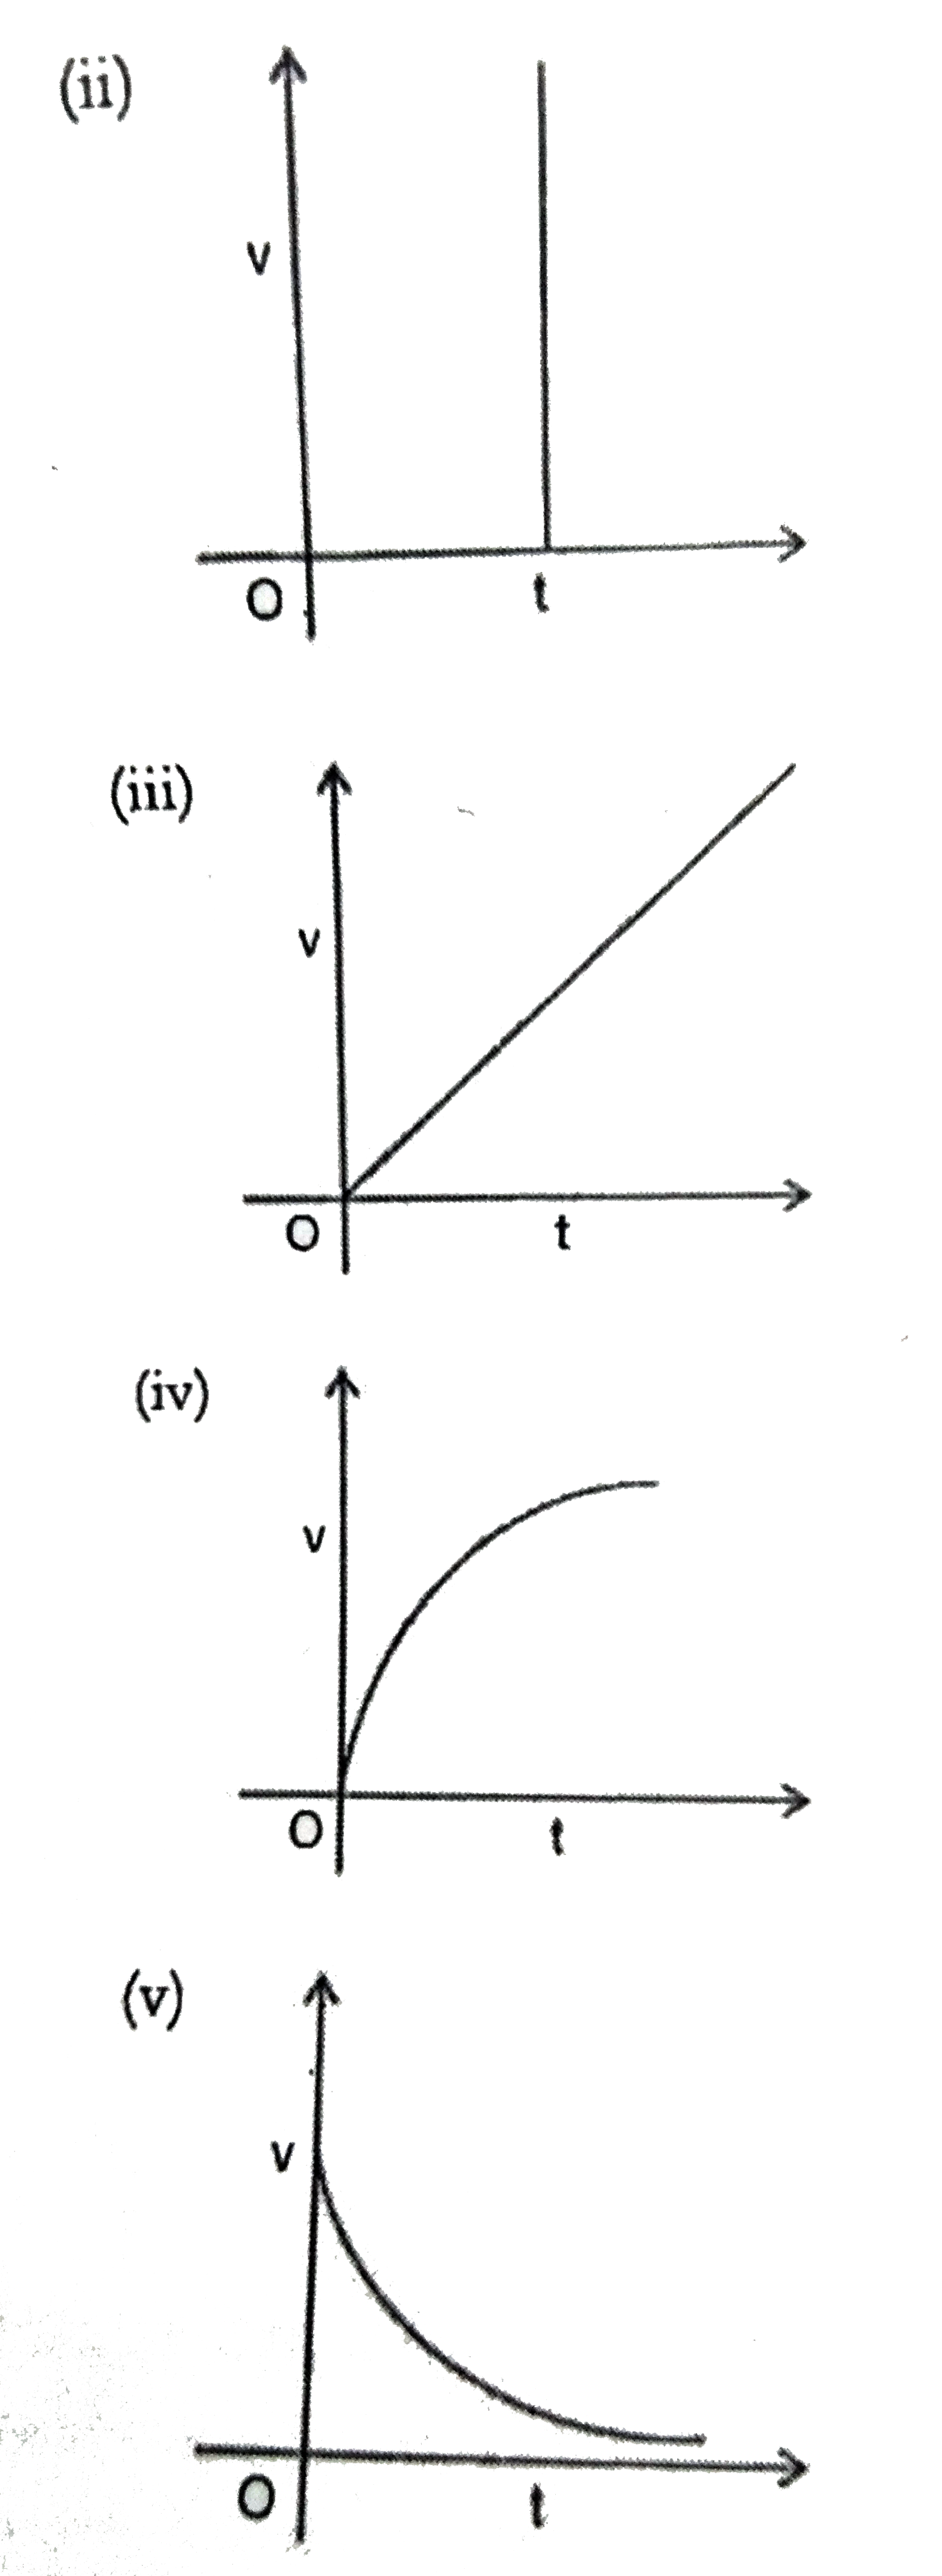
In the following graphs, the velocity of linearly moving body is against its time of travel. Analyse each of the given graphs and disecus the type of motion of the body


View SolutionIn the following graphs, the velocity of linearly moving body is against its time of travel. Analyse each of the given graphs and disecus the type of motion of the body


View Solution
Knowledge Check
The growth curve of bacterial population is lab is plotted against time. What will be the shape of graph ?
ASigmoidBHyperbolicCAscending straight lineDJ-shapedGrowth plotted against time gives a
AParabolic curveBSigmoid curveCUpright lineDHorizontal line.Growth plotted against time gives a
AParabolic curveBSigmoid curveCUpright lineDHorizontal line
In the following graphs, the velocity of linearly moving body is against its time of travel. Analyse each of the given graphs and disecus the type of motion of the body


View SolutionIn the following graphs, the velocity of linearly moving body is against its time of travel. Analyse each of the given graphs and disecus the type of motion of the body


View SolutionA sound source, emitting sound of constant frequency, moves with a constant speed and crosses a stationary observer. The frequency (n) of sound heard by the observer is plotted against time (t). Which of the following graphs represents the correct variation :-
View SolutionA sound source, emitting sound of constant frequency, moves with a constant speed and crosses a stationary observer. The frequency (n) of sound heard by the observer is plotted against time (t). Which of the following graphs represents the correct variation :-
View SolutionOne capacitor and ammeter connected in series are connected to an ideal battery. Reading of the ammeter is plotted against time. Which graph represents it the best?
View Solution