Graph of y=f(x) is as shown in the following figure.
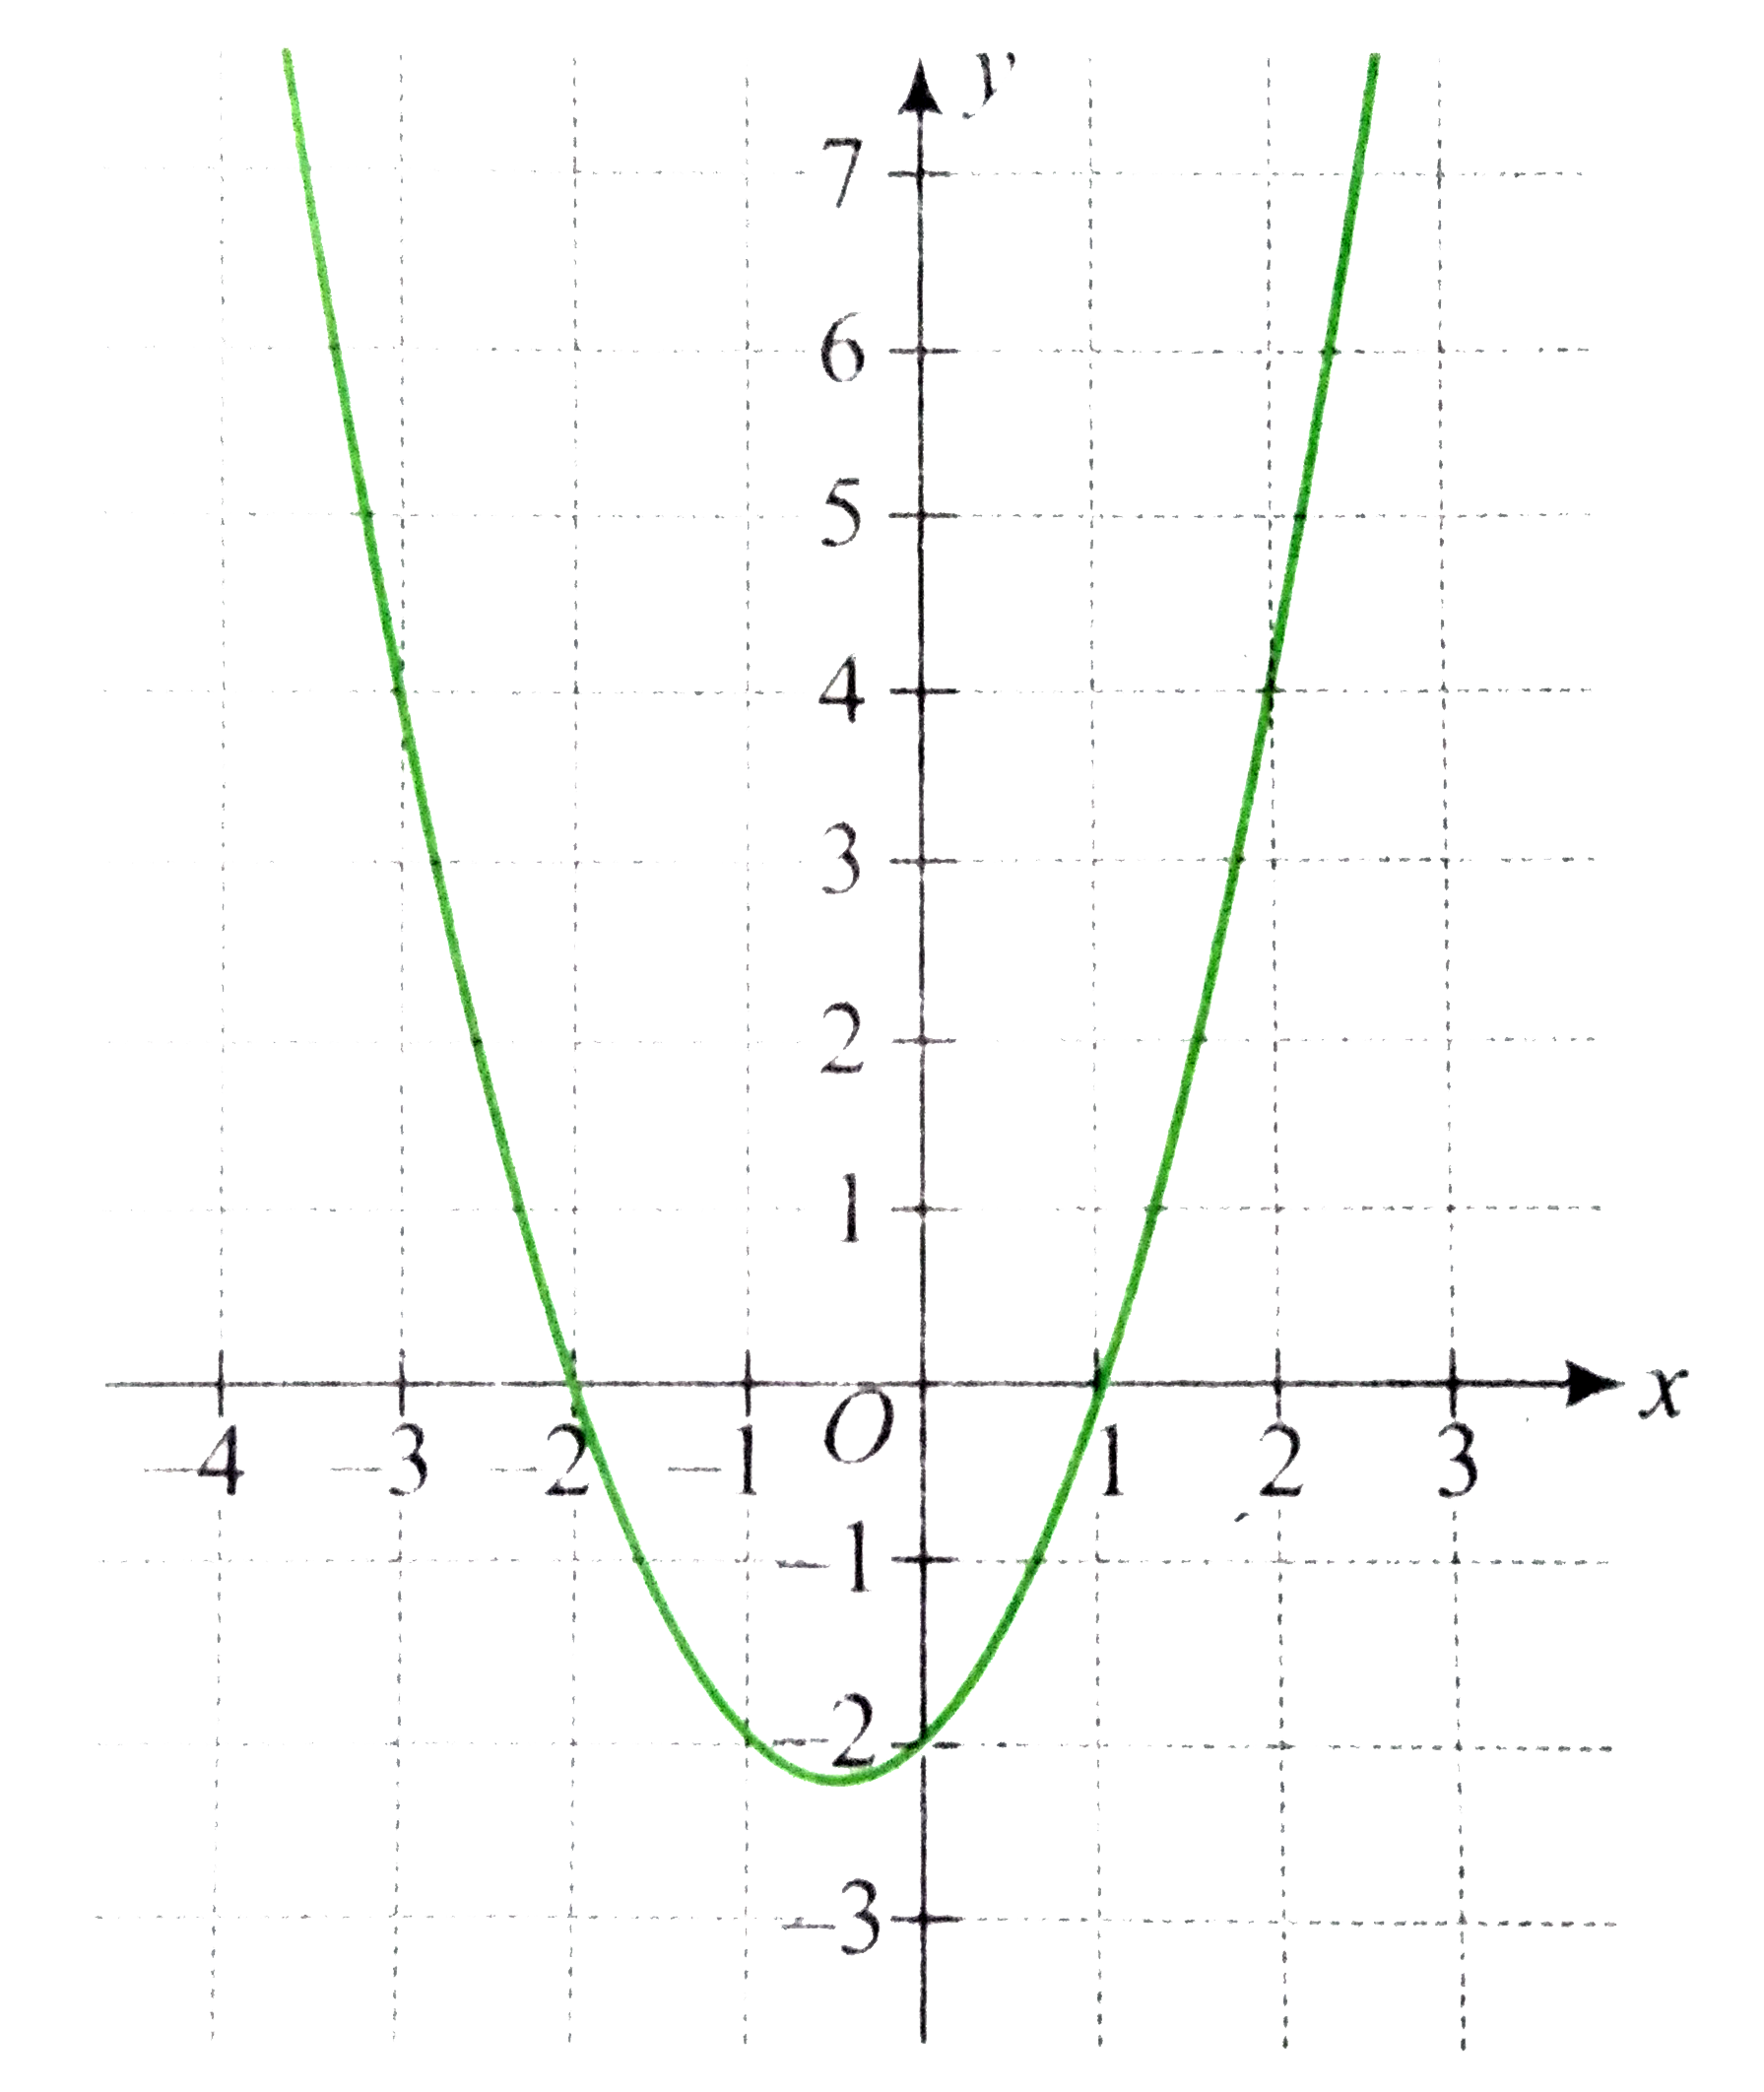
Find the roots of the following equations
f(x)=0
f(x)=4
f(x)=x+2
The correct Answer is:(a) x=−2andx=1
(b) x=−3andx=2
(c) x=2andx=−2
Graphs of y=f(x) intersect x-axis at x = -2 and x = 1, Which are roots of the equation (x)=0
(b) Graph of y = f(x) intersect the line y = 4 intersect at points whose x-value are - 3 and 2, which are the roots of the equation f(x) = 4
(c) For the roots of the equation f(x) = x + 2, we draw the graph of y=x=2, which passes through the points (2, 4) and (-2, 0) which lies on the graph of y = f(x) also.
so, roots of the equation f(x) = x + 2 are x = 2 and x = -2
Topper's Solved these Questions
- THEORY OF EQUATIONSBook:CENGAGEChapter:THEORY OF EQUATIONSExercise:Exercise 2.5
Explore 4 Videos
- THEORY OF EQUATIONSBook:CENGAGEChapter:THEORY OF EQUATIONSExercise:Exercise 2.6
Explore 4 Videos
- THEORY OF EQUATIONSBook:CENGAGEChapter:THEORY OF EQUATIONSExercise:Exercise 2.3
Explore 3 Videos
- STRAIGHT LINESBook:CENGAGEChapter:STRAIGHT LINESExercise:JEE Advanced Previous Year
Explore 4 Videos
- THREE DIMENSIONAL GEOMETRYBook:CENGAGEChapter:THREE DIMENSIONAL GEOMETRYExercise:Question Bank
Explore 20 Videos
Similar Questions
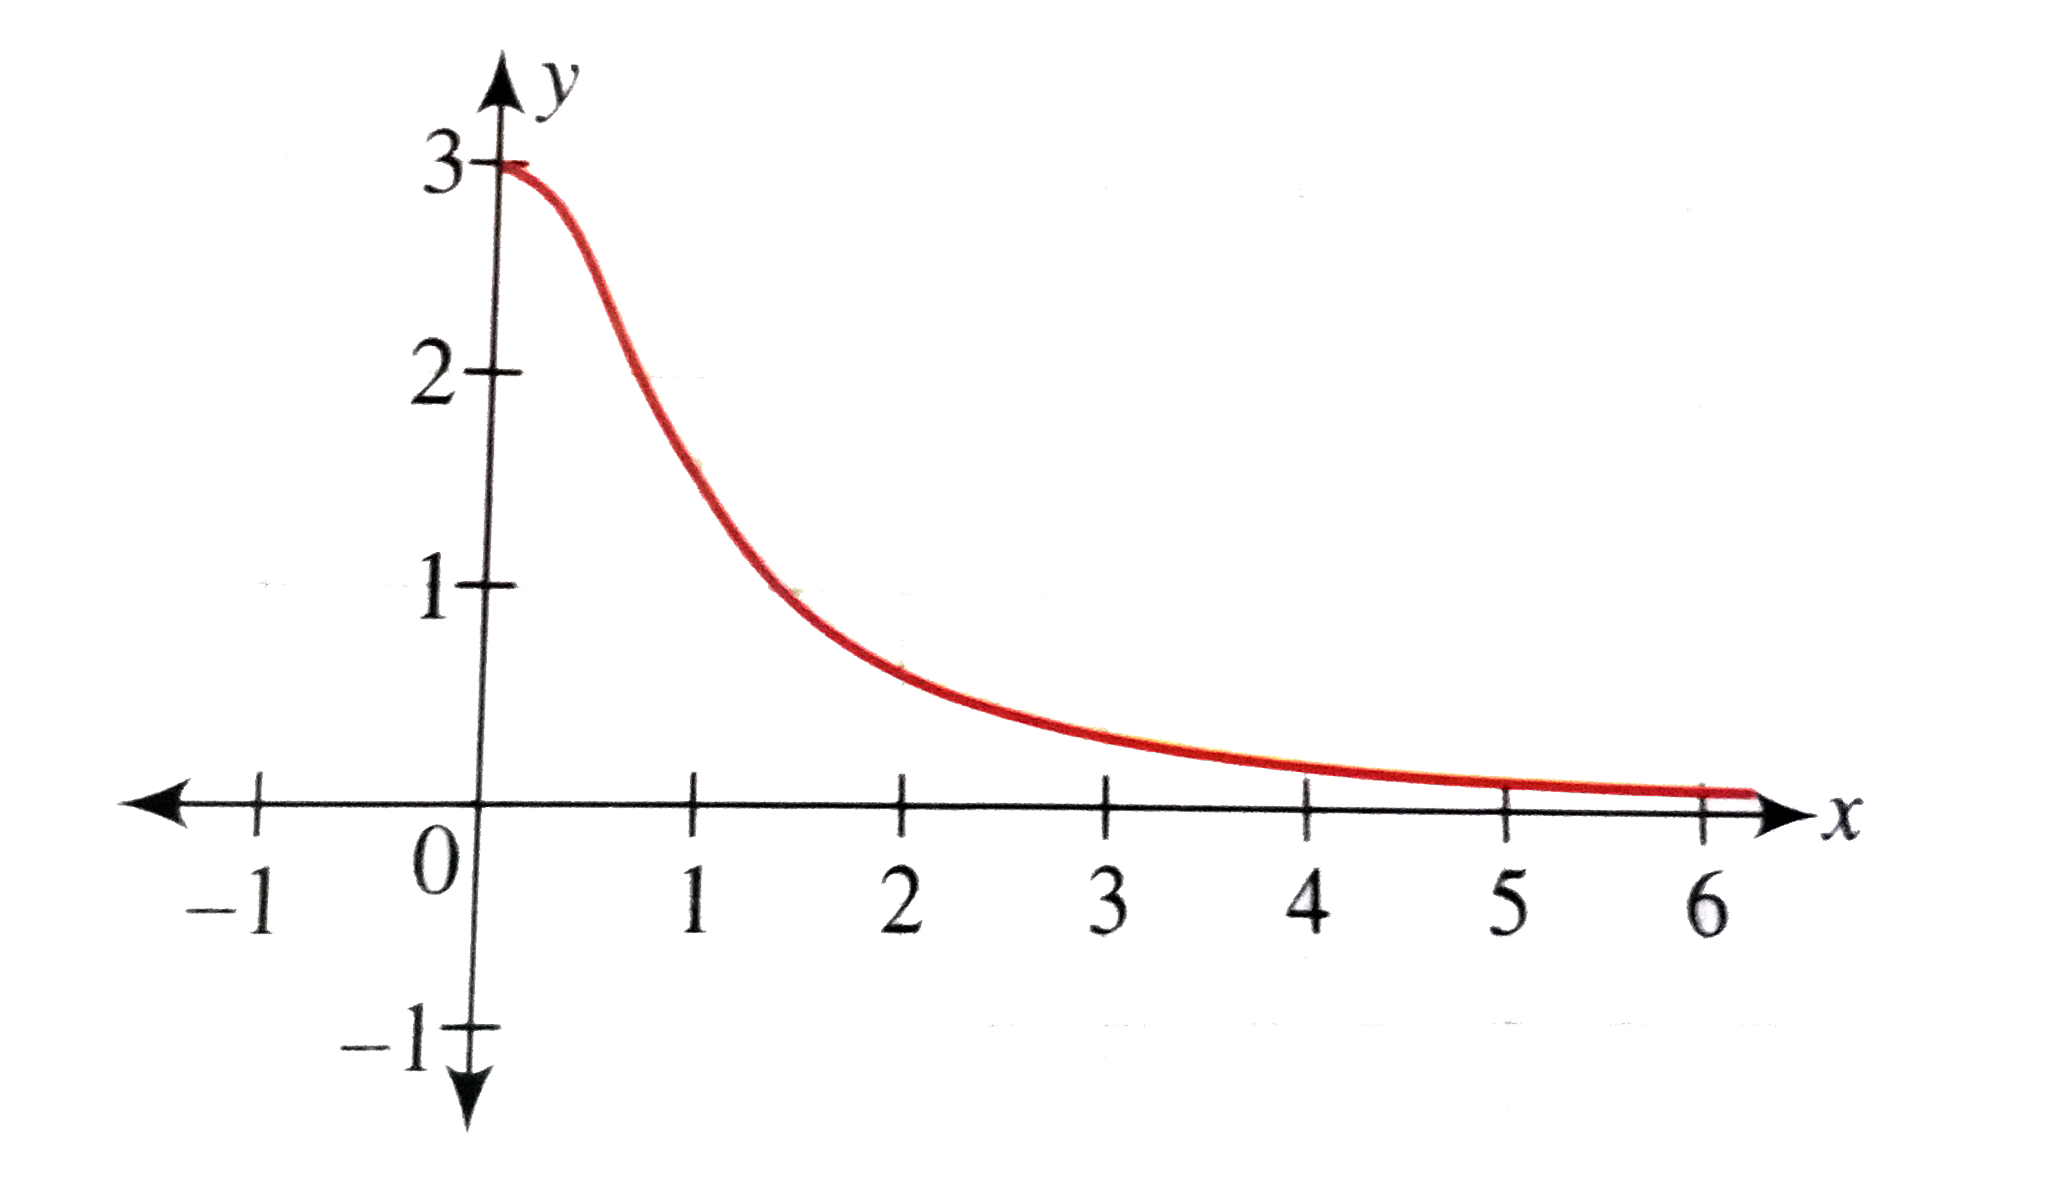
The graph of y=f(x) is as shown in the following figure. Draw the graph of y=[f(x)].
View SolutionGraph of y=f(x) is given as shown in the following figure. Draw the graph of y=sgn(f(x)).
View SolutionConsider the graph of y = f(x) as shown in the following figure.
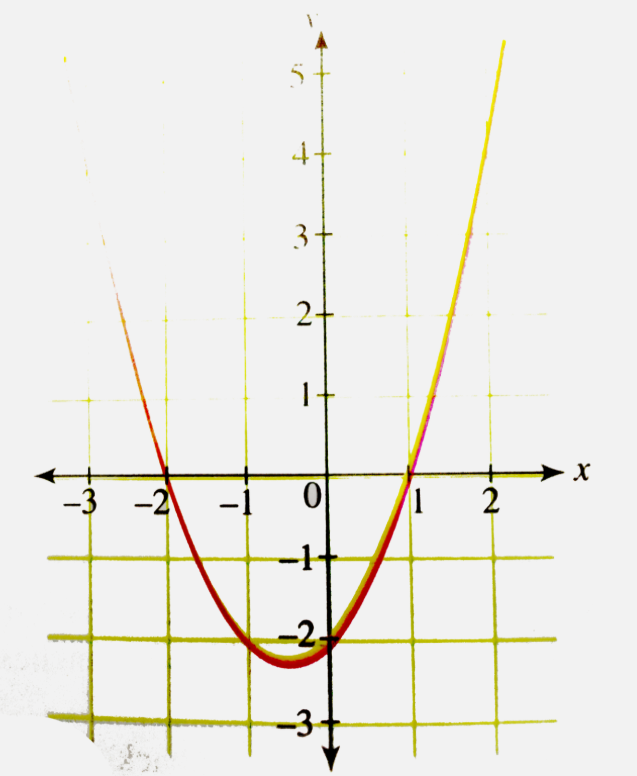
(i) Find the sum of the roots of the equation f (x) = 0.
(ii) Find the product of the roots of the equation f(x) = 4.
(iii) Find the absolute value of the difference of the roots of the equation f(x) = x+2 .
View SolutionSketch the graphs of the following functions : (a) (i) f(x)=2x+3 (ii) f(x)=4−2x
View SolutionThe graph of y = f(x) is as shown in the following figure.
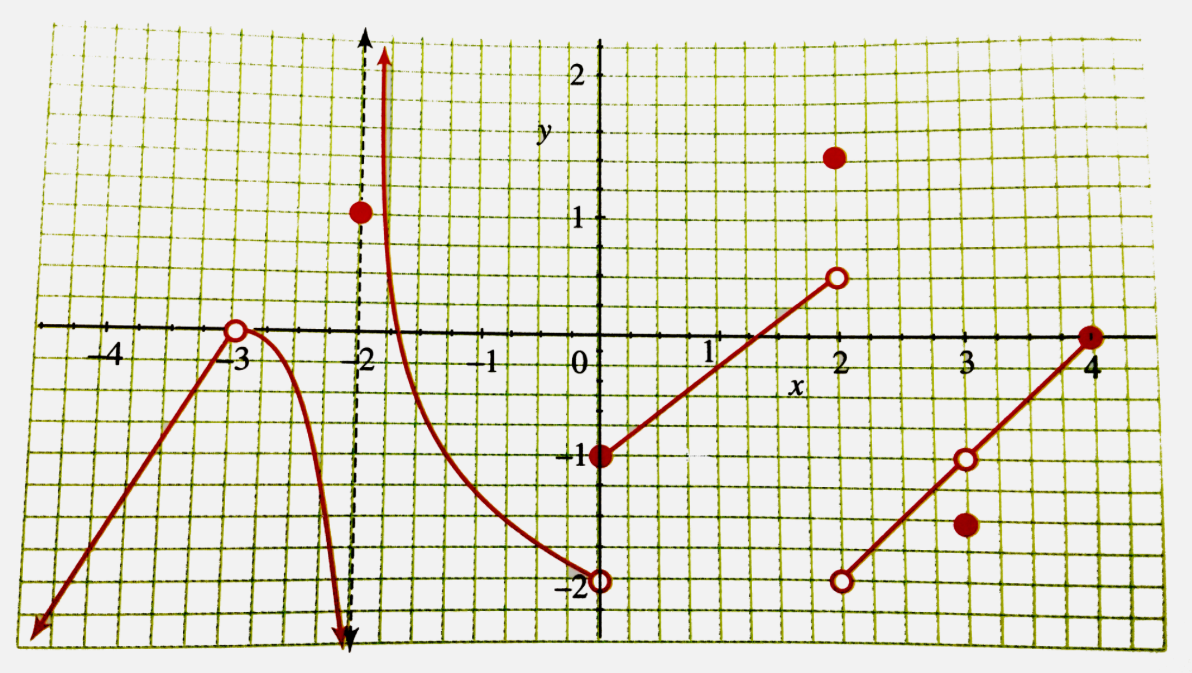
Find the following values
(i)f(−3) (ii)f(−2) (iii)f(0)
(iv)f(2) (v)f(3) (vi)limx→−3f(x)
(vii)limx→0f(x) (viii)limx→2f(x) (ix)limx→3f(x)
(x)limx→2−f(x) (ξ)limx→−2+f(x) (xii)limx→0−f(x)
(x iii) limx→0+f(x)
View SolutionThe graph of y=|f(x)| is as shown in the following figure Fig Graph of y=f(x) may be a, b, c d is fig
View SolutionThe graph of y=f(x) is shown in the figure.Which of the following could be the graph of y=f(|x|)
View SolutionIf graph of y= f(x) is as shown in figure, then which of the following options is/are correct?
View SolutionThe graph y = f (x) is as shown:
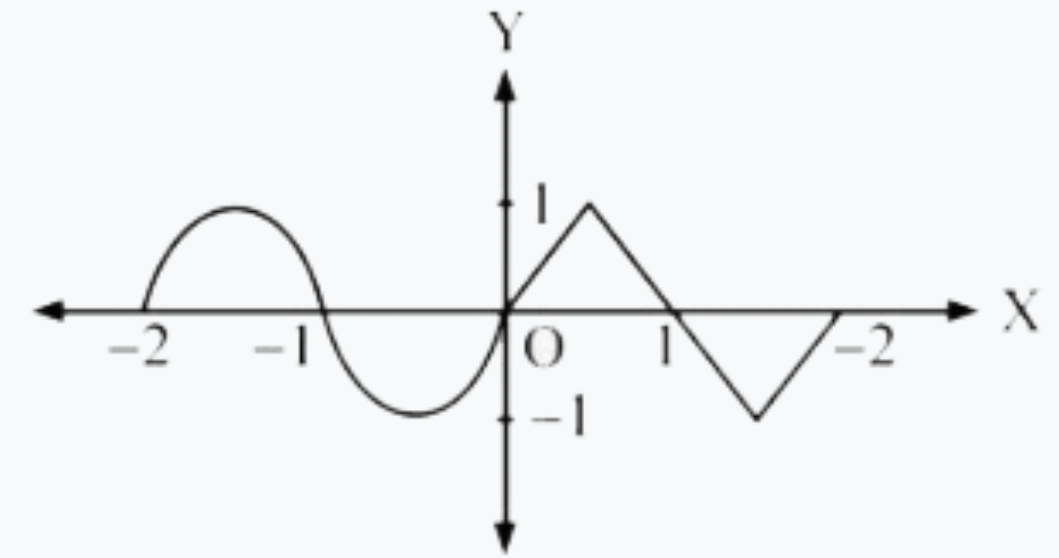
The graph of y = f (–|x|) is:
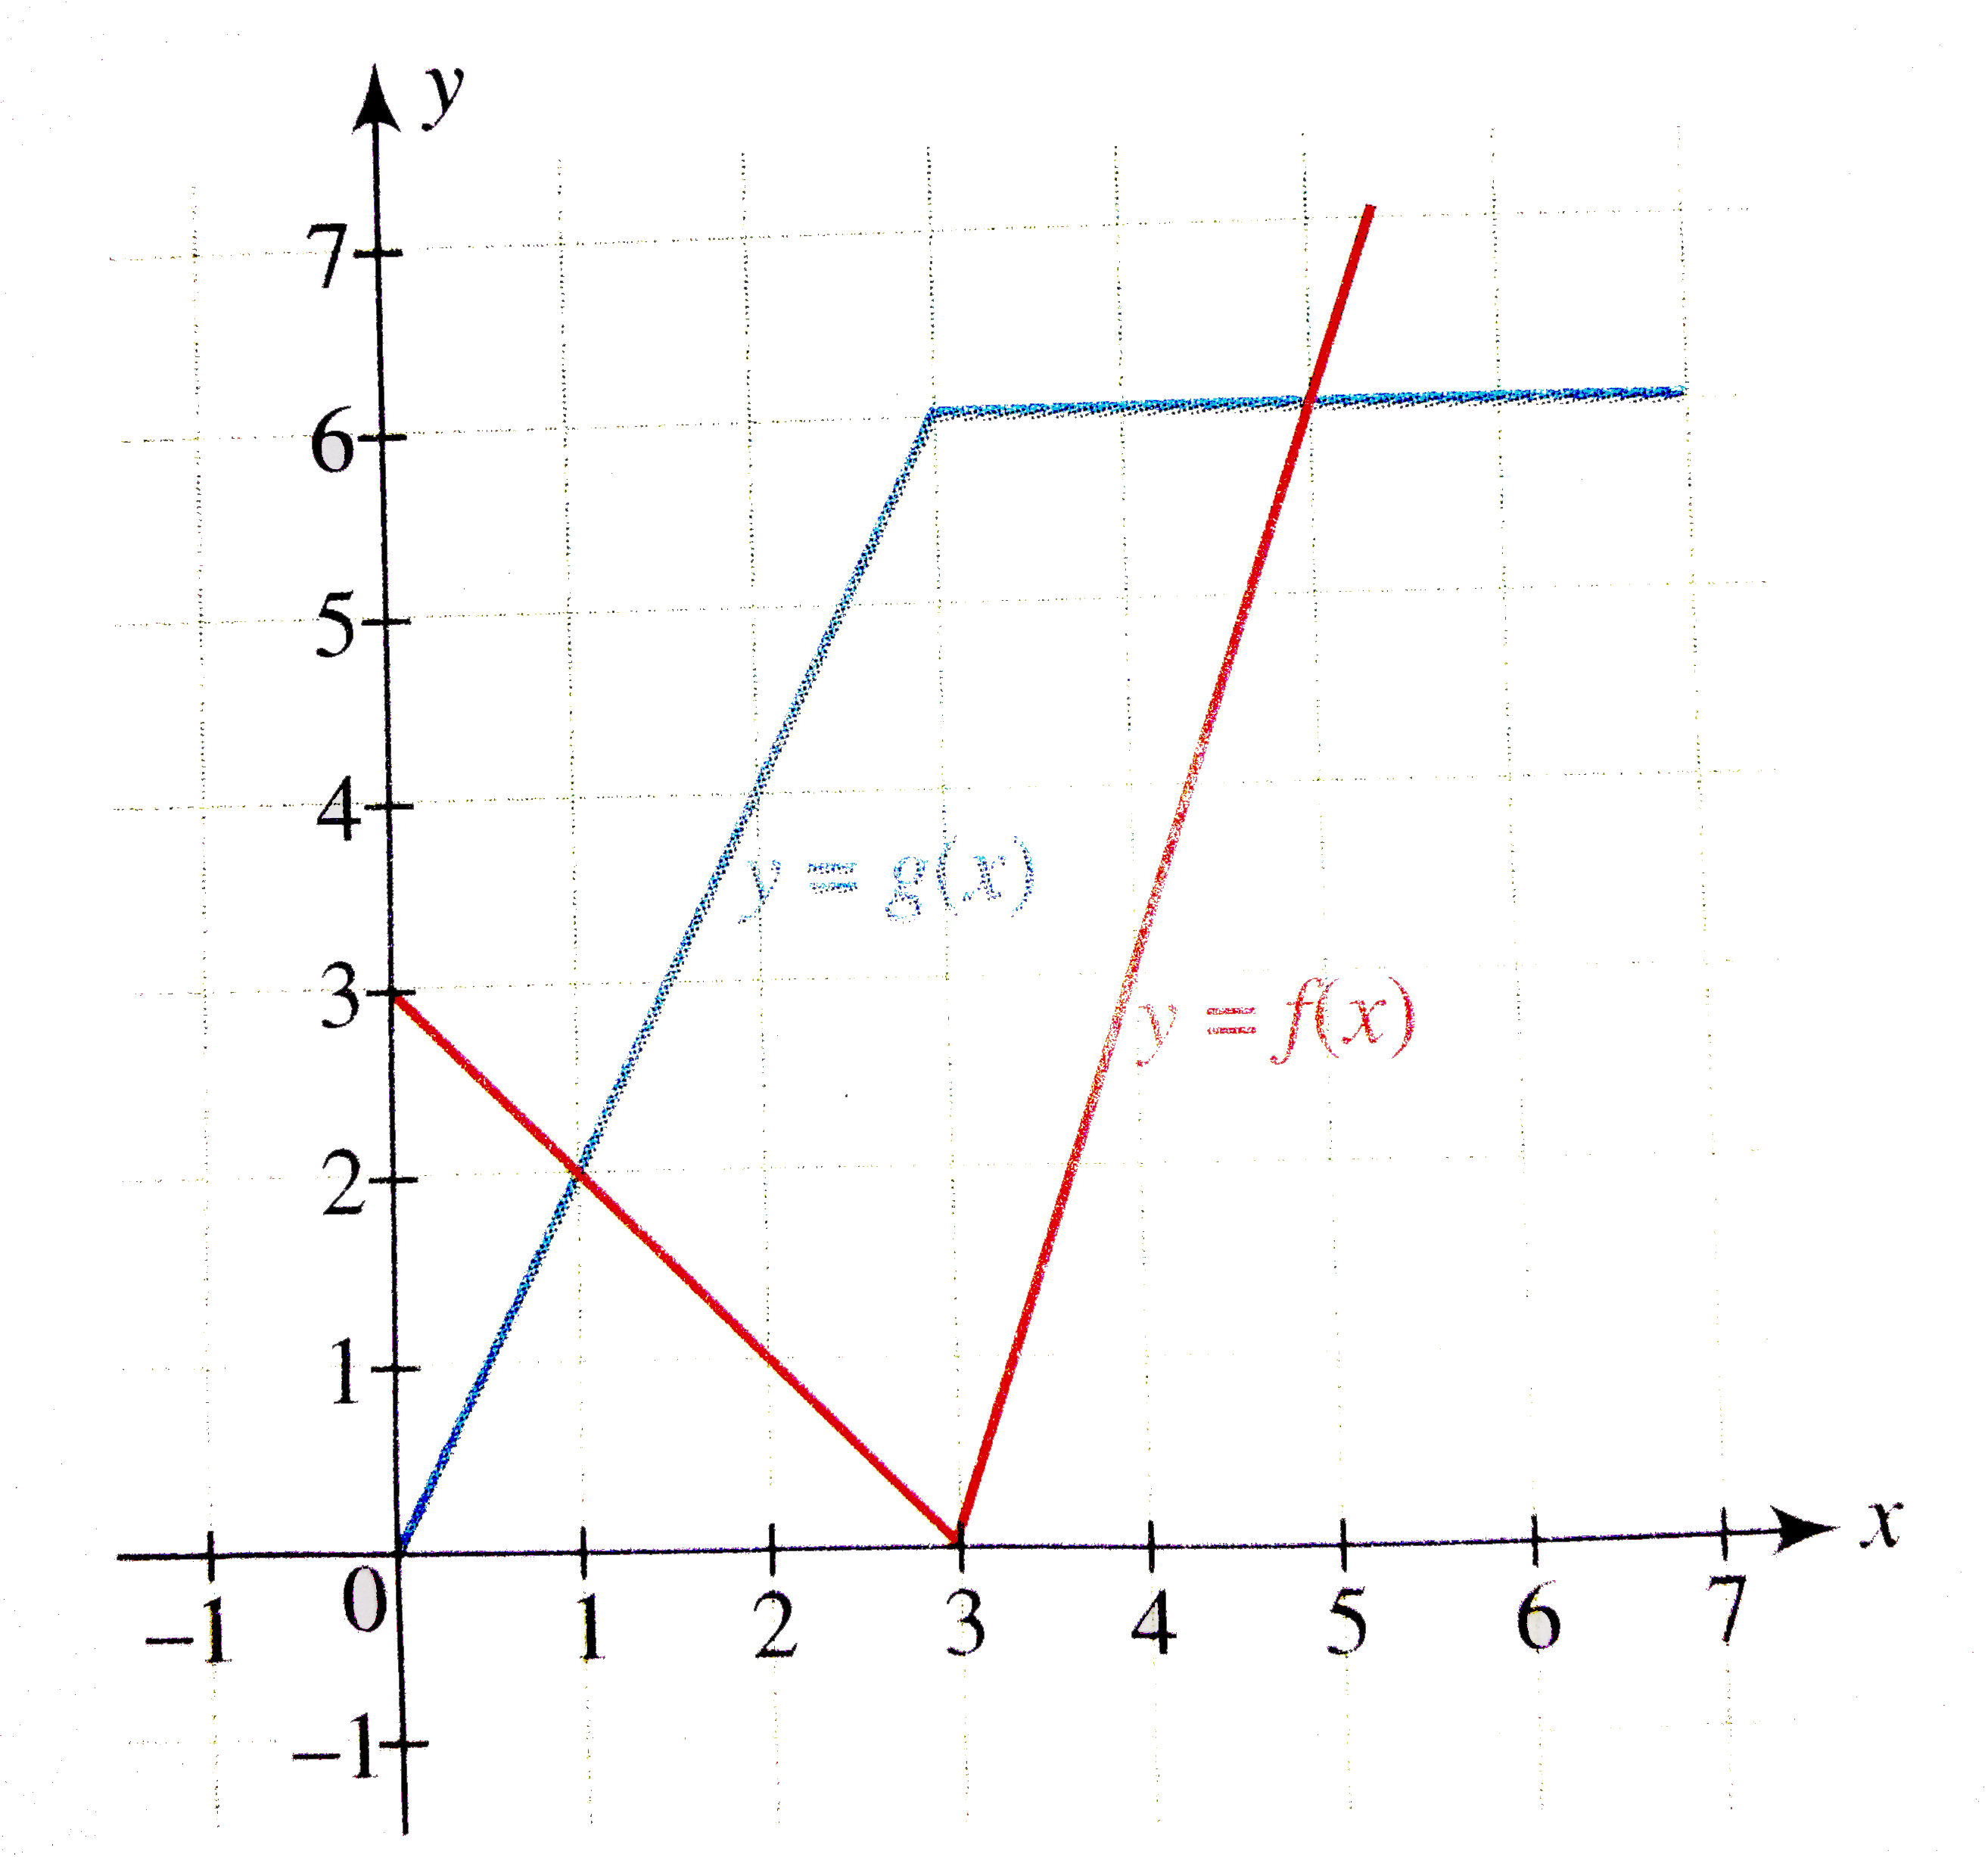
View SolutionGraph of y=f(x)andy=g(x) is given in the following figure. If h(x)=f(g(x)), then find the value of h'(2).
View Solution

