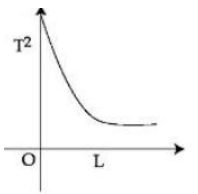
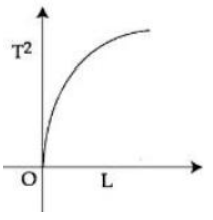
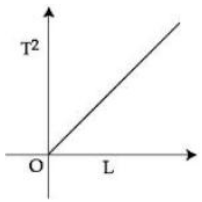
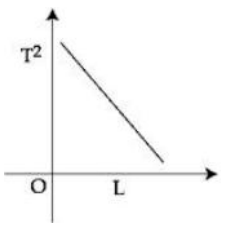
Choose the correct length (L) versus square of time period (T2) graph for a simple pendulum executing simple harmonic motion.
 ,
,
 ,
,


The correct Answer is:C
To determine the correct graph of length (L) versus the square of the time period (T²) for a simple pendulum executing simple harmonic motion, we can follow these steps:
Step 1: Understand the formula for the time period (T) of a simple pendulum
The time period T of a simple pendulum is given by the formula:
T=2π√Lg
where L is the length of the pendulum and g is the acceleration due to gravity.
Step 2: Square the time period formula
To find the relationship between T2 and L, we square both sides of the equation:
T2=(2π)2Lg
This simplifies to:
T2=4π2gL
Step 3: Identify the relationship between T² and L
From the equation T2=4π2gL, we can see that T2 is directly proportional to L. This means that if we plot T2 on the y-axis and L on the x-axis, the relationship will be linear.
Step 4: Determine the characteristics of the graph
Since T2 is directly proportional to L, the graph will be a straight line that passes through the origin (0,0). This indicates that as the length L increases, the square of the time period T2 also increases linearly.
Step 5: Choose the correct graph
Based on the analysis, the correct graph will be a straight line that starts from the origin and has a positive slope. Any graph that does not meet these criteria (e.g., curves or does not pass through the origin) would be incorrect.
Conclusion
Thus, the correct length (L) versus square of time period (T²) graph for a simple pendulum executing simple harmonic motion is a straight line passing through the origin.
---
The time period T of a simple pendulum is given by the formula:
T=2π√Lg
where L is the length of the pendulum and g is the acceleration due to gravity.
To find the relationship between T2 and L, we square both sides of the equation:
T2=(2π)2Lg
This simplifies to:
T2=4π2gL
From the equation T2=4π2gL, we can see that T2 is directly proportional to L. This means that if we plot T2 on the y-axis and L on the x-axis, the relationship will be linear.
Since T2 is directly proportional to L, the graph will be a straight line that passes through the origin (0,0). This indicates that as the length L increases, the square of the time period T2 also increases linearly.
Based on the analysis, the correct graph will be a straight line that starts from the origin and has a positive slope. Any graph that does not meet these criteria (e.g., curves or does not pass through the origin) would be incorrect.
Thus, the correct length (L) versus square of time period (T²) graph for a simple pendulum executing simple harmonic motion is a straight line passing through the origin.
Topper's Solved these Questions
Similar Questions
Knowledge Check
If a body is executing simple harmonic motion, then
Aat extreme positions, the total energy is zeroBat equilibrium position, the total energy is in the form of potential energyCat equilibrium position, the total energy is in the form of kinetic energyDat extreme position, the total energy is infiniteWhile a particle executes linear simple harmonic motion
Aits linear velocity and acceleration pass through their maximum and minimum values once in each oscillation.BIts linear velocity and acceleration pass through their maximum and minimum values twice in each oscillation.Cits linear velocity and acceleration pass through their maximum and minimum values four times in each oscillation.Dits linear velocity and acceleration always attain their peak values simlataneaously.The velocity of a particle executing simple harmonic motion is
Aω2√A2+x2Bω√A2−x2Cω√A2+x2Dω2√A2−x2
When will the motion of a simple pendulum be simple harmonic?
View SolutionThe total energy of a particle executing simple harmonic motion is
View SolutionThe graph of time period (T) of a simple pendulum versus its length (I) is
View SolutionThe graph of time period (T) of simple pendulum versus its length (l) is
View SolutionThe graph of l against T for a simple pendulum is
View Solution
