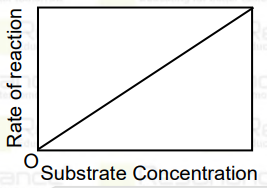
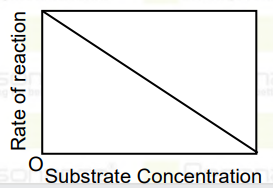
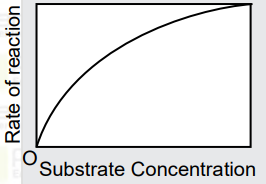
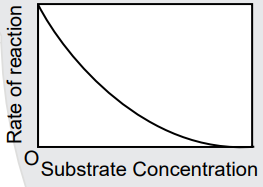
The variation of the rate of an enzyme catalysed reaction with substrate concentration is correctly represented by graph


The correct Answer is:D
To solve the question regarding the variation of the rate of an enzyme-catalyzed reaction with substrate concentration, we can follow these steps:
1. Understanding Enzyme-Catalyzed Reactions:
- Enzymes are biological catalysts that increase the rate of chemical reactions without being consumed in the process. The rate of an enzyme-catalyzed reaction typically depends on the concentration of the substrate.
2. Analyzing the Relationship:
- Initially, as the substrate concentration increases, the rate of the reaction also increases. This is because more substrate molecules are available for the enzyme to act upon.
3. Identifying the Saturation Point:
- However, there comes a point where all the active sites of the enzyme molecules are occupied. This is known as the saturation point. Beyond this point, adding more substrate does not increase the rate of reaction because the enzyme is already working at its maximum capacity.
4. Graphical Representation:
- The correct graph representing this relationship will show an initial increase in the rate of reaction with increasing substrate concentration, followed by a plateau where the rate remains constant despite further increases in substrate concentration.
5. Choosing the Correct Option:
- Among the given options, the graph that shows an initial rise followed by a plateau (constant rate) is the correct representation of the enzyme-catalyzed reaction with respect to substrate concentration. This corresponds to option 3.
Conclusion:
The correct answer is option 3, which illustrates the characteristic curve of an enzyme-catalyzed reaction where the rate increases with substrate concentration up to a certain point and then levels off.
- Enzymes are biological catalysts that increase the rate of chemical reactions without being consumed in the process. The rate of an enzyme-catalyzed reaction typically depends on the concentration of the substrate.
- Initially, as the substrate concentration increases, the rate of the reaction also increases. This is because more substrate molecules are available for the enzyme to act upon.
- However, there comes a point where all the active sites of the enzyme molecules are occupied. This is known as the saturation point. Beyond this point, adding more substrate does not increase the rate of reaction because the enzyme is already working at its maximum capacity.
- The correct graph representing this relationship will show an initial increase in the rate of reaction with increasing substrate concentration, followed by a plateau where the rate remains constant despite further increases in substrate concentration.
- Among the given options, the graph that shows an initial rise followed by a plateau (constant rate) is the correct representation of the enzyme-catalyzed reaction with respect to substrate concentration. This corresponds to option 3.
The correct answer is option 3, which illustrates the characteristic curve of an enzyme-catalyzed reaction where the rate increases with substrate concentration up to a certain point and then levels off.
Topper's Solved these Questions
Similar Questions
Knowledge Check
The first step of an enzyme catalysed reaction is :
AThe enzyme breaks the chemical bond of the substrate .BThe enzyme releases the product of the reaction.CThe substrate binds to the active site of the enzyme.DThe binding site reacts with the substrate forming the enzyme product complex.How do enzymes catalyse the reaction ?
ABy holding the substrate molecule for chemical reactionBBy providing functional groups which will attack the substrate to carry out chemical reactionCBoth (1) & (2)DNeither (1) & (2)The reactant in an enzyme-catalysed reaction is called the
AhormoneBsubstrateCcofactorDinhibitor
Km value of enzyme is substrate concentration at
View SolutionWhat is the effect of an enzyme in an enzyme-catalysed reaction?
View SolutionRate of reaction (r ) is plotted against temperature (T) for an enzyme catalysed reaction. Which of the following is correct representation ?
View SolutionRate of reaction (r ) is plotted against temperature (T) for an enzyme catalysed reaction. What of the following is correct representation ?
View SolutionWhich of the following graph is correctly represented?
View Solution
