Which one of the following volume (V)- temperature (T) plots represents the behaviour of one mole of an ideal gas at one atmosphere?
A
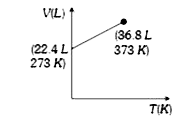
B
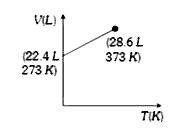
C
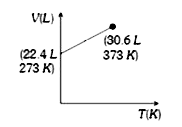
D
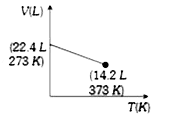
Video Solution
Text Solution
The correct Answer is:B
V1V2=T1T2∴V2=V1.T2T1=22.4×373273=30.6L
|
Similar Questions
Which of the following volume (V) - temperature (T) plots represents the behaviour of one mole of an ideal gas at one atmospheric pressure?
View SolutionWhich of the following volume (V)-temperature (T) plots represents the behaviour of one mole of an ideal gas at one atmoshperic pressure?
View Solution
Knowledge Check
Which of the following volume (V) - temperature (T) plots represents the behaviour of one mole of an ideal gas at one atmospheric pressure?
A B
B C
C D
D
Which one of the following volume (V)- temperature (T) plots represents the behaviour of one mole of an ideal gas at one atmosphere?
A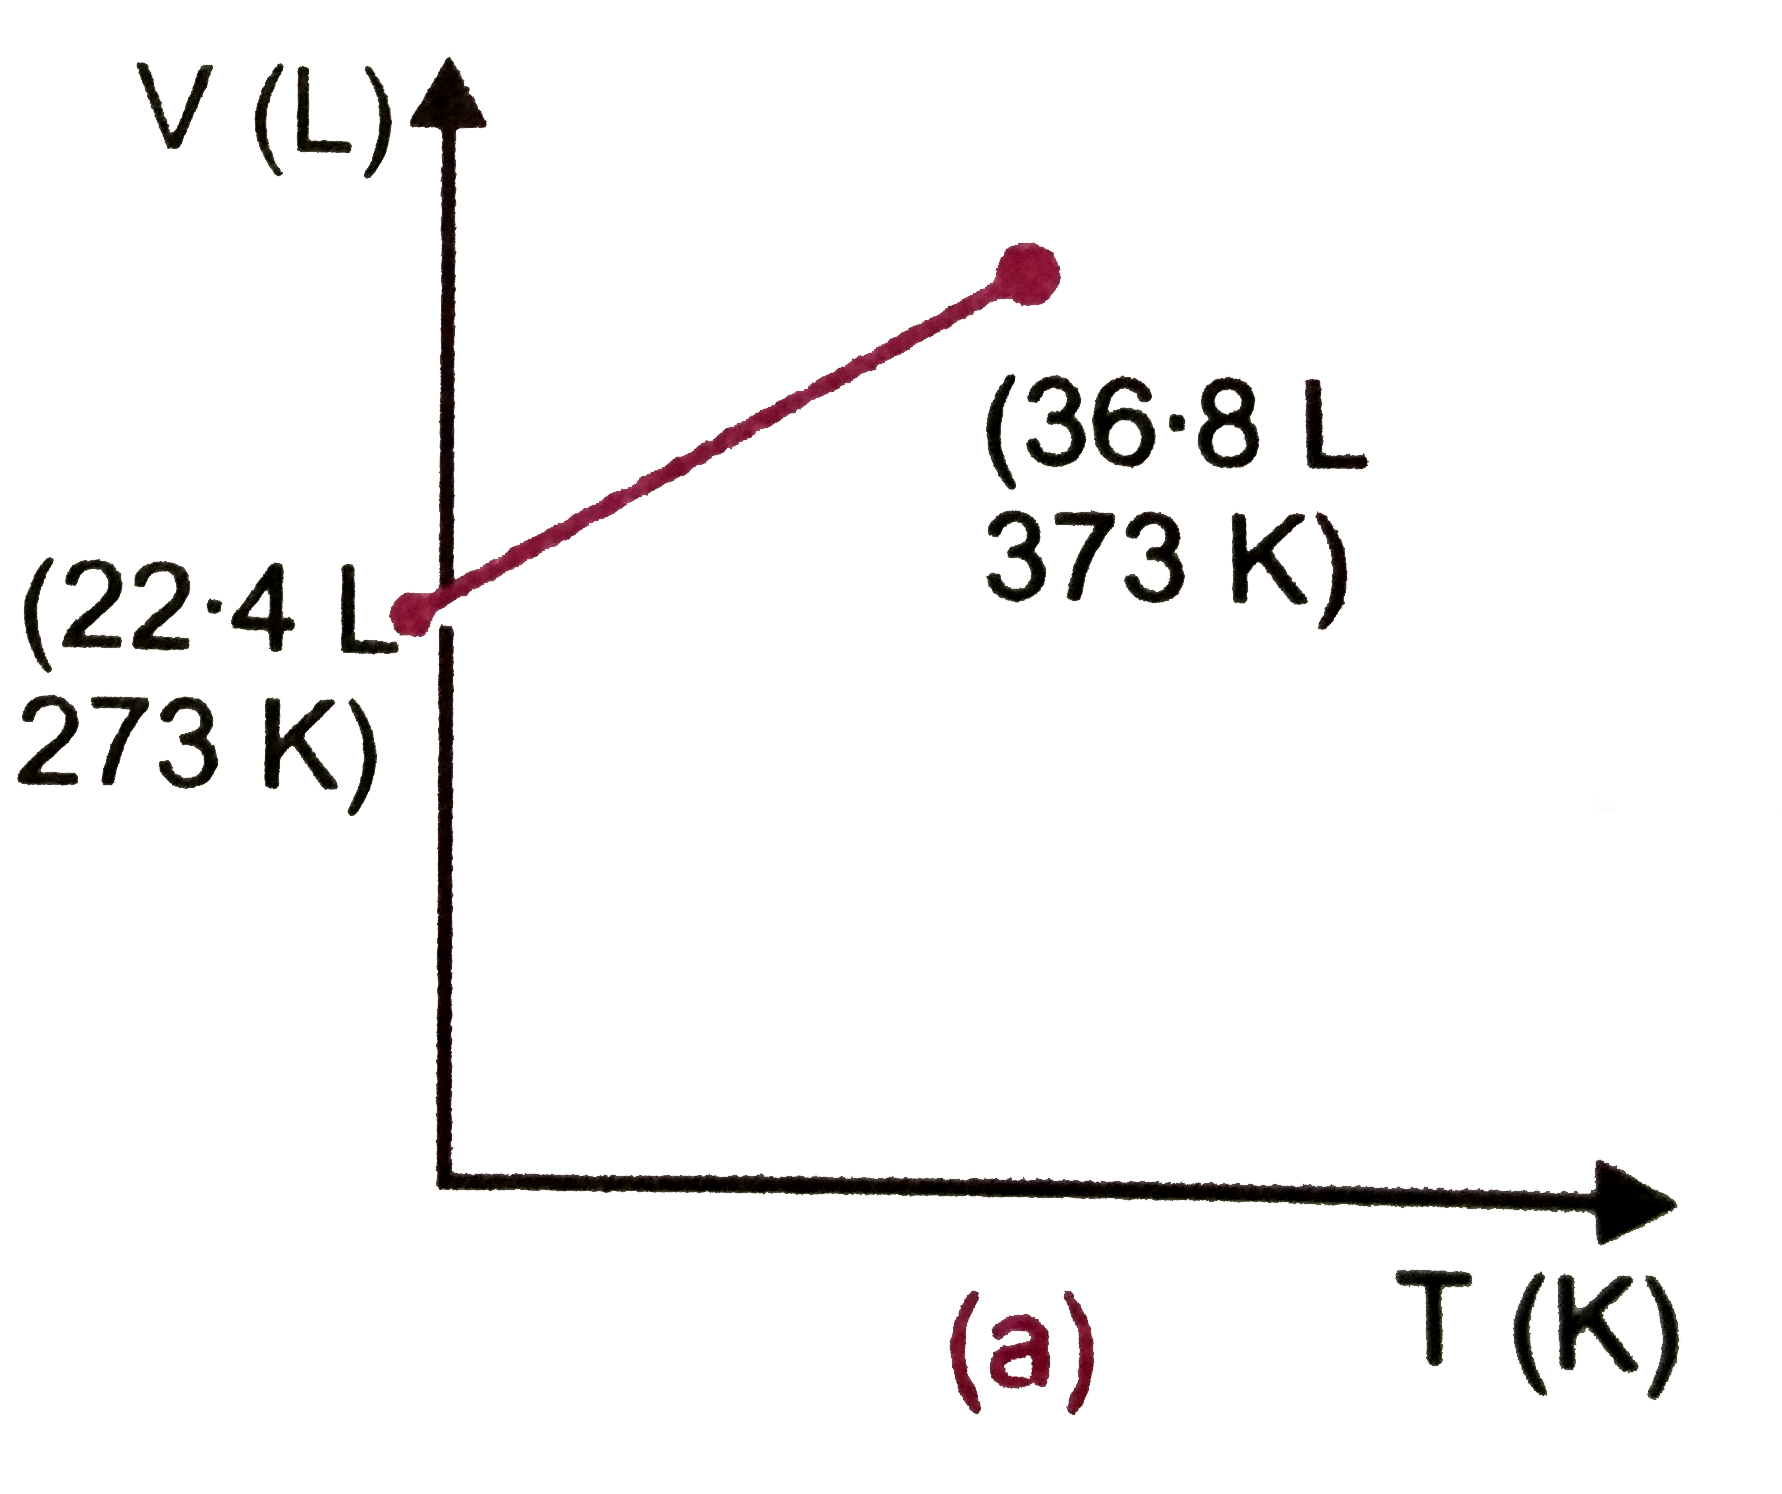 B
B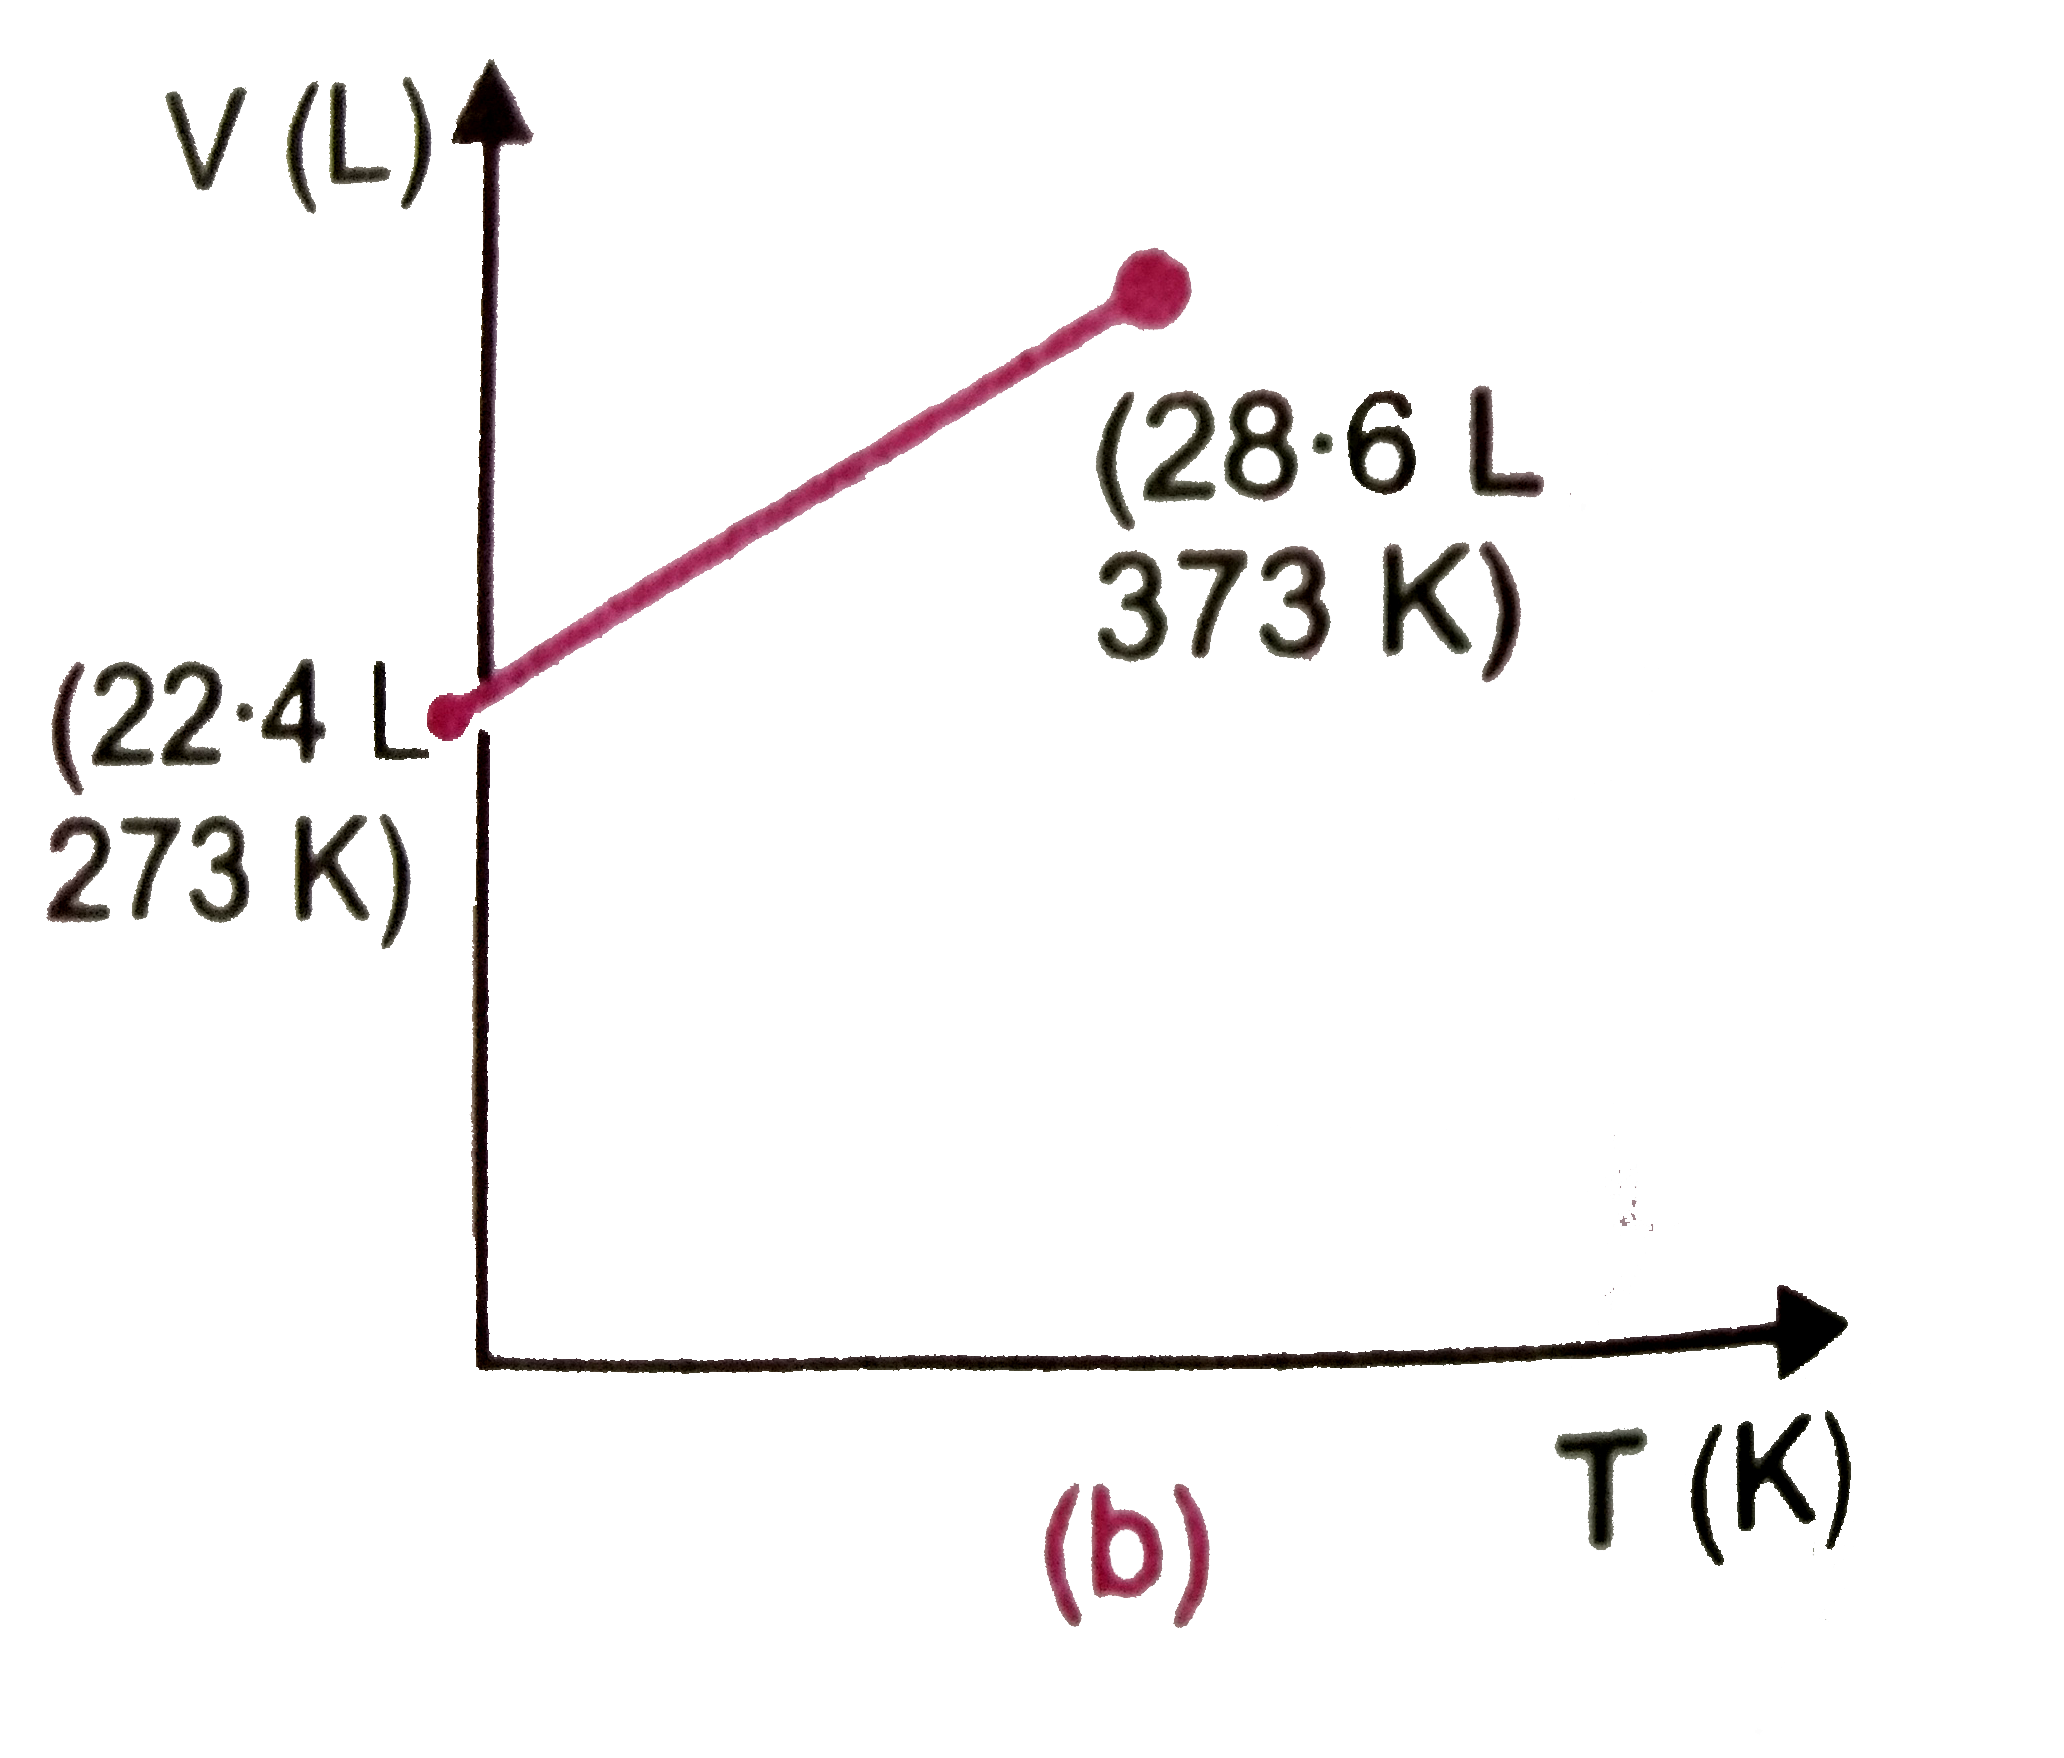 C
C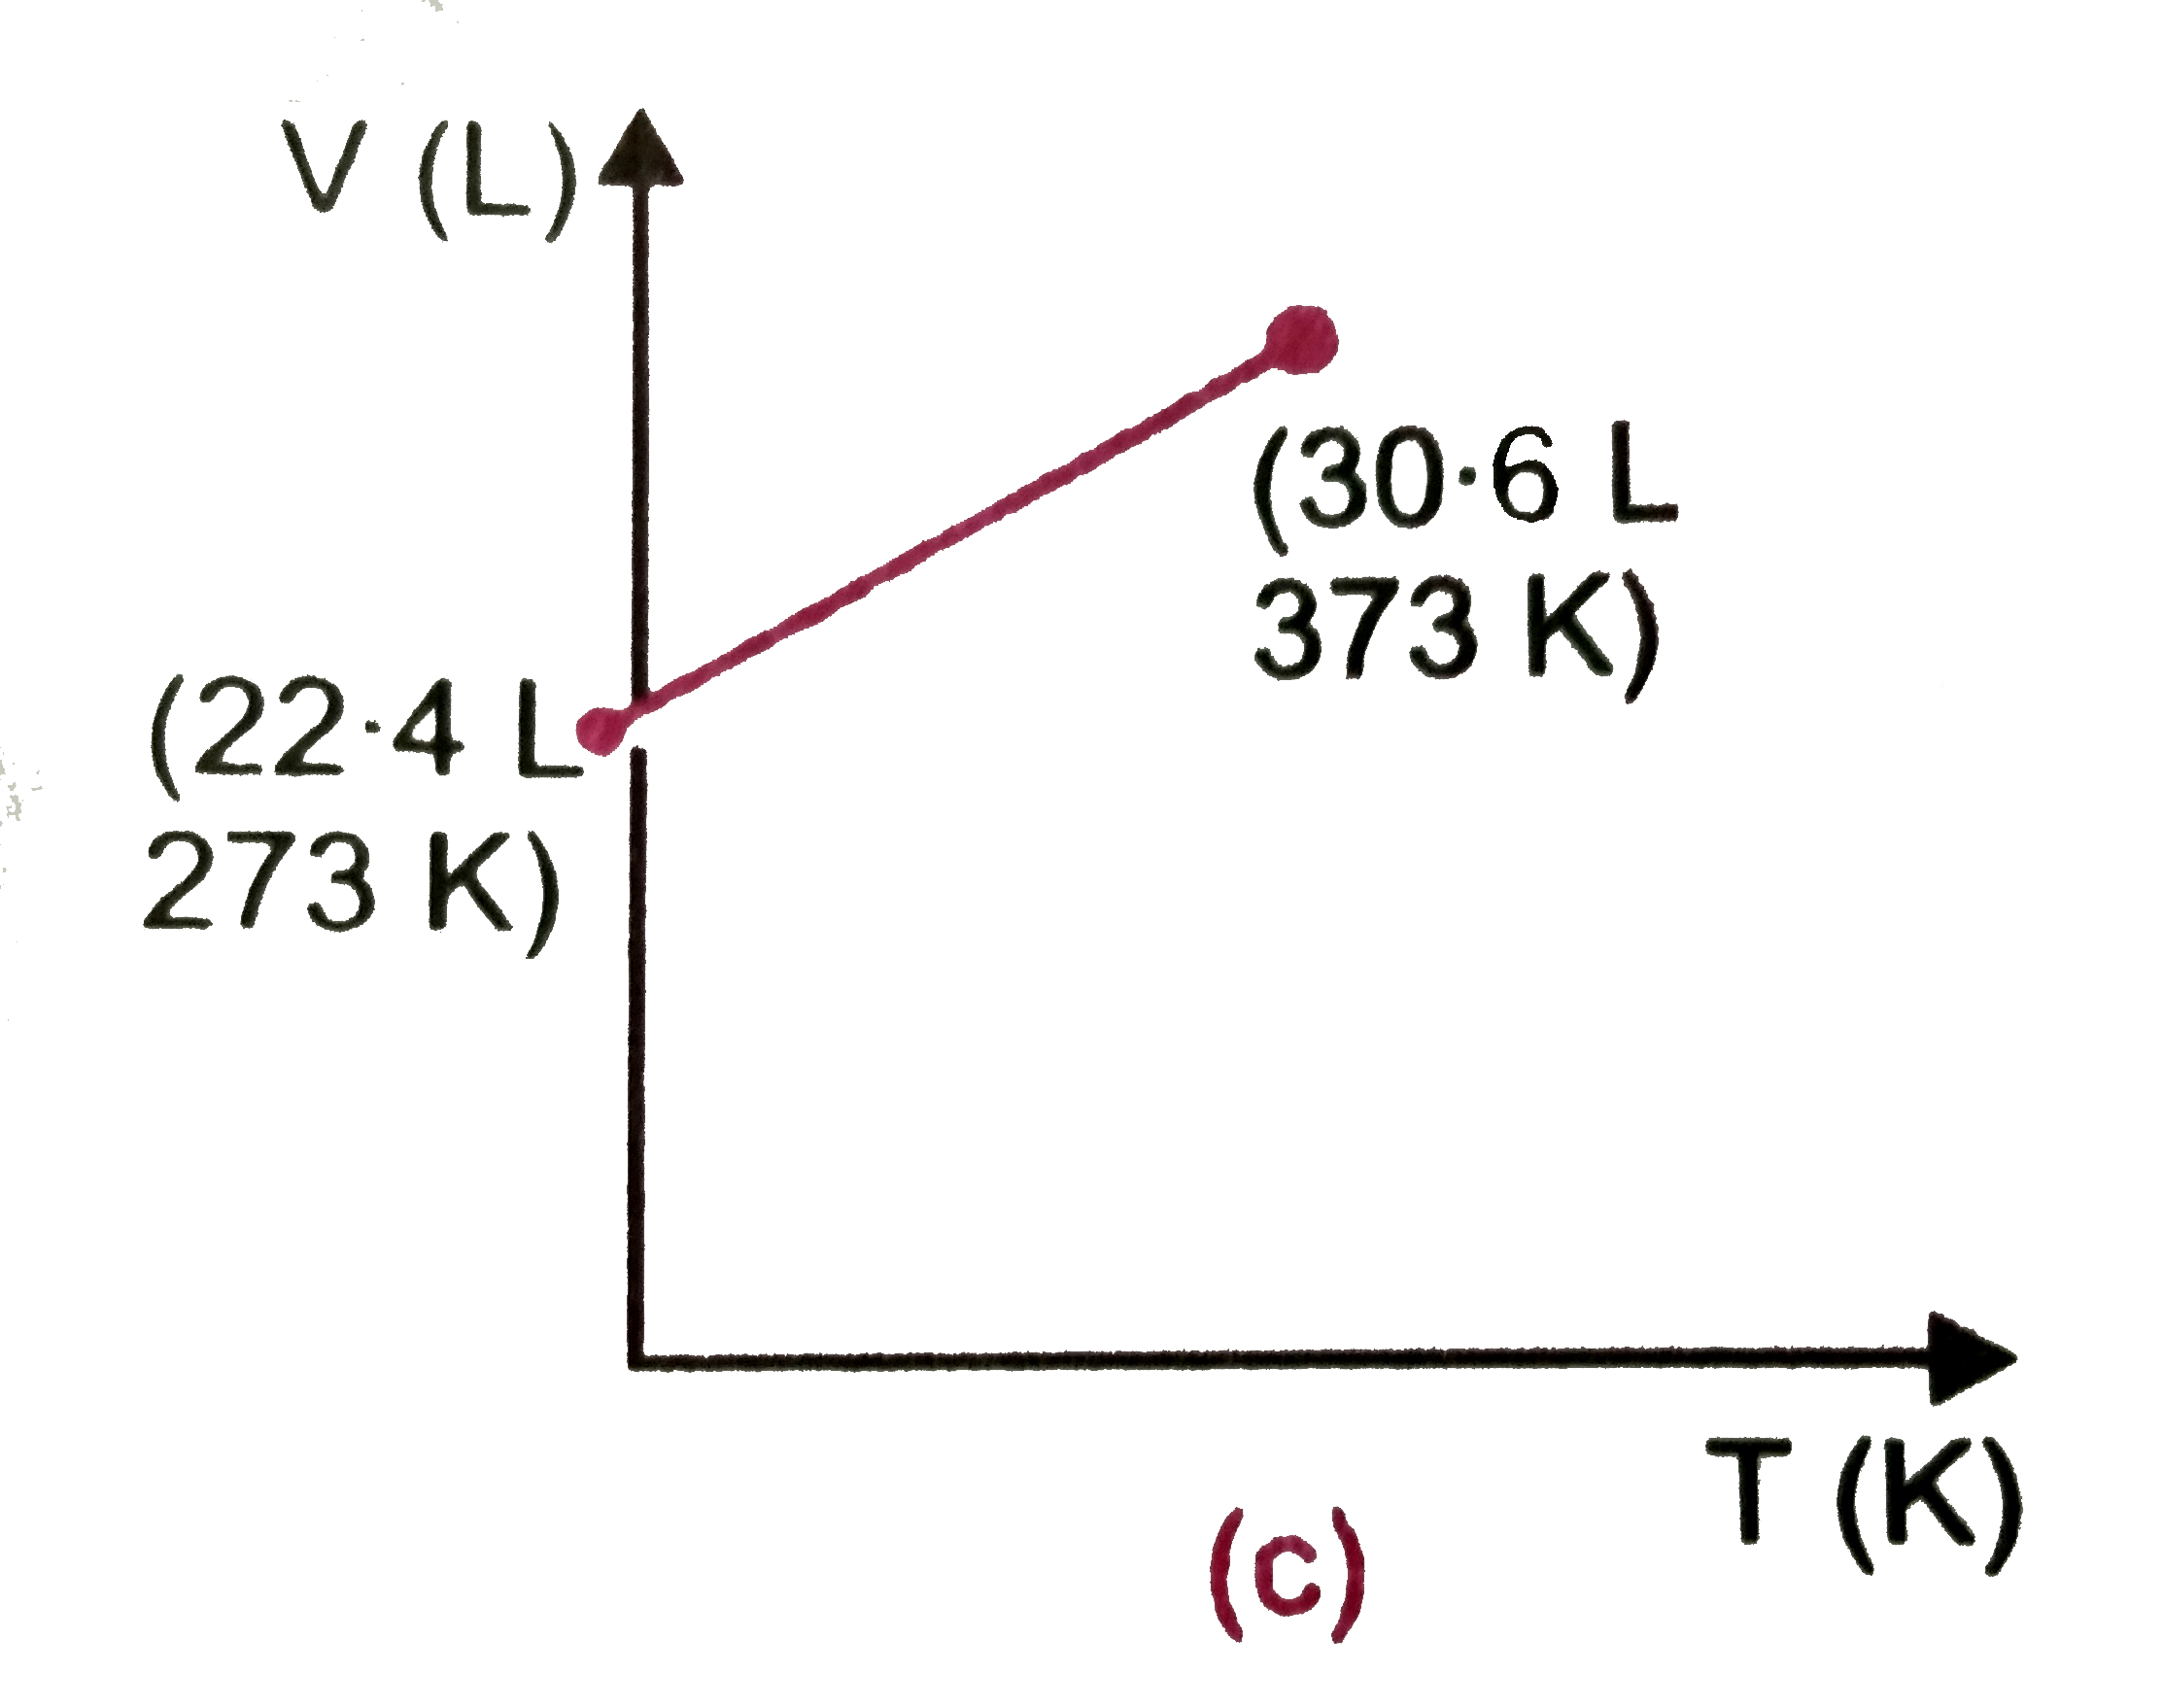 D
D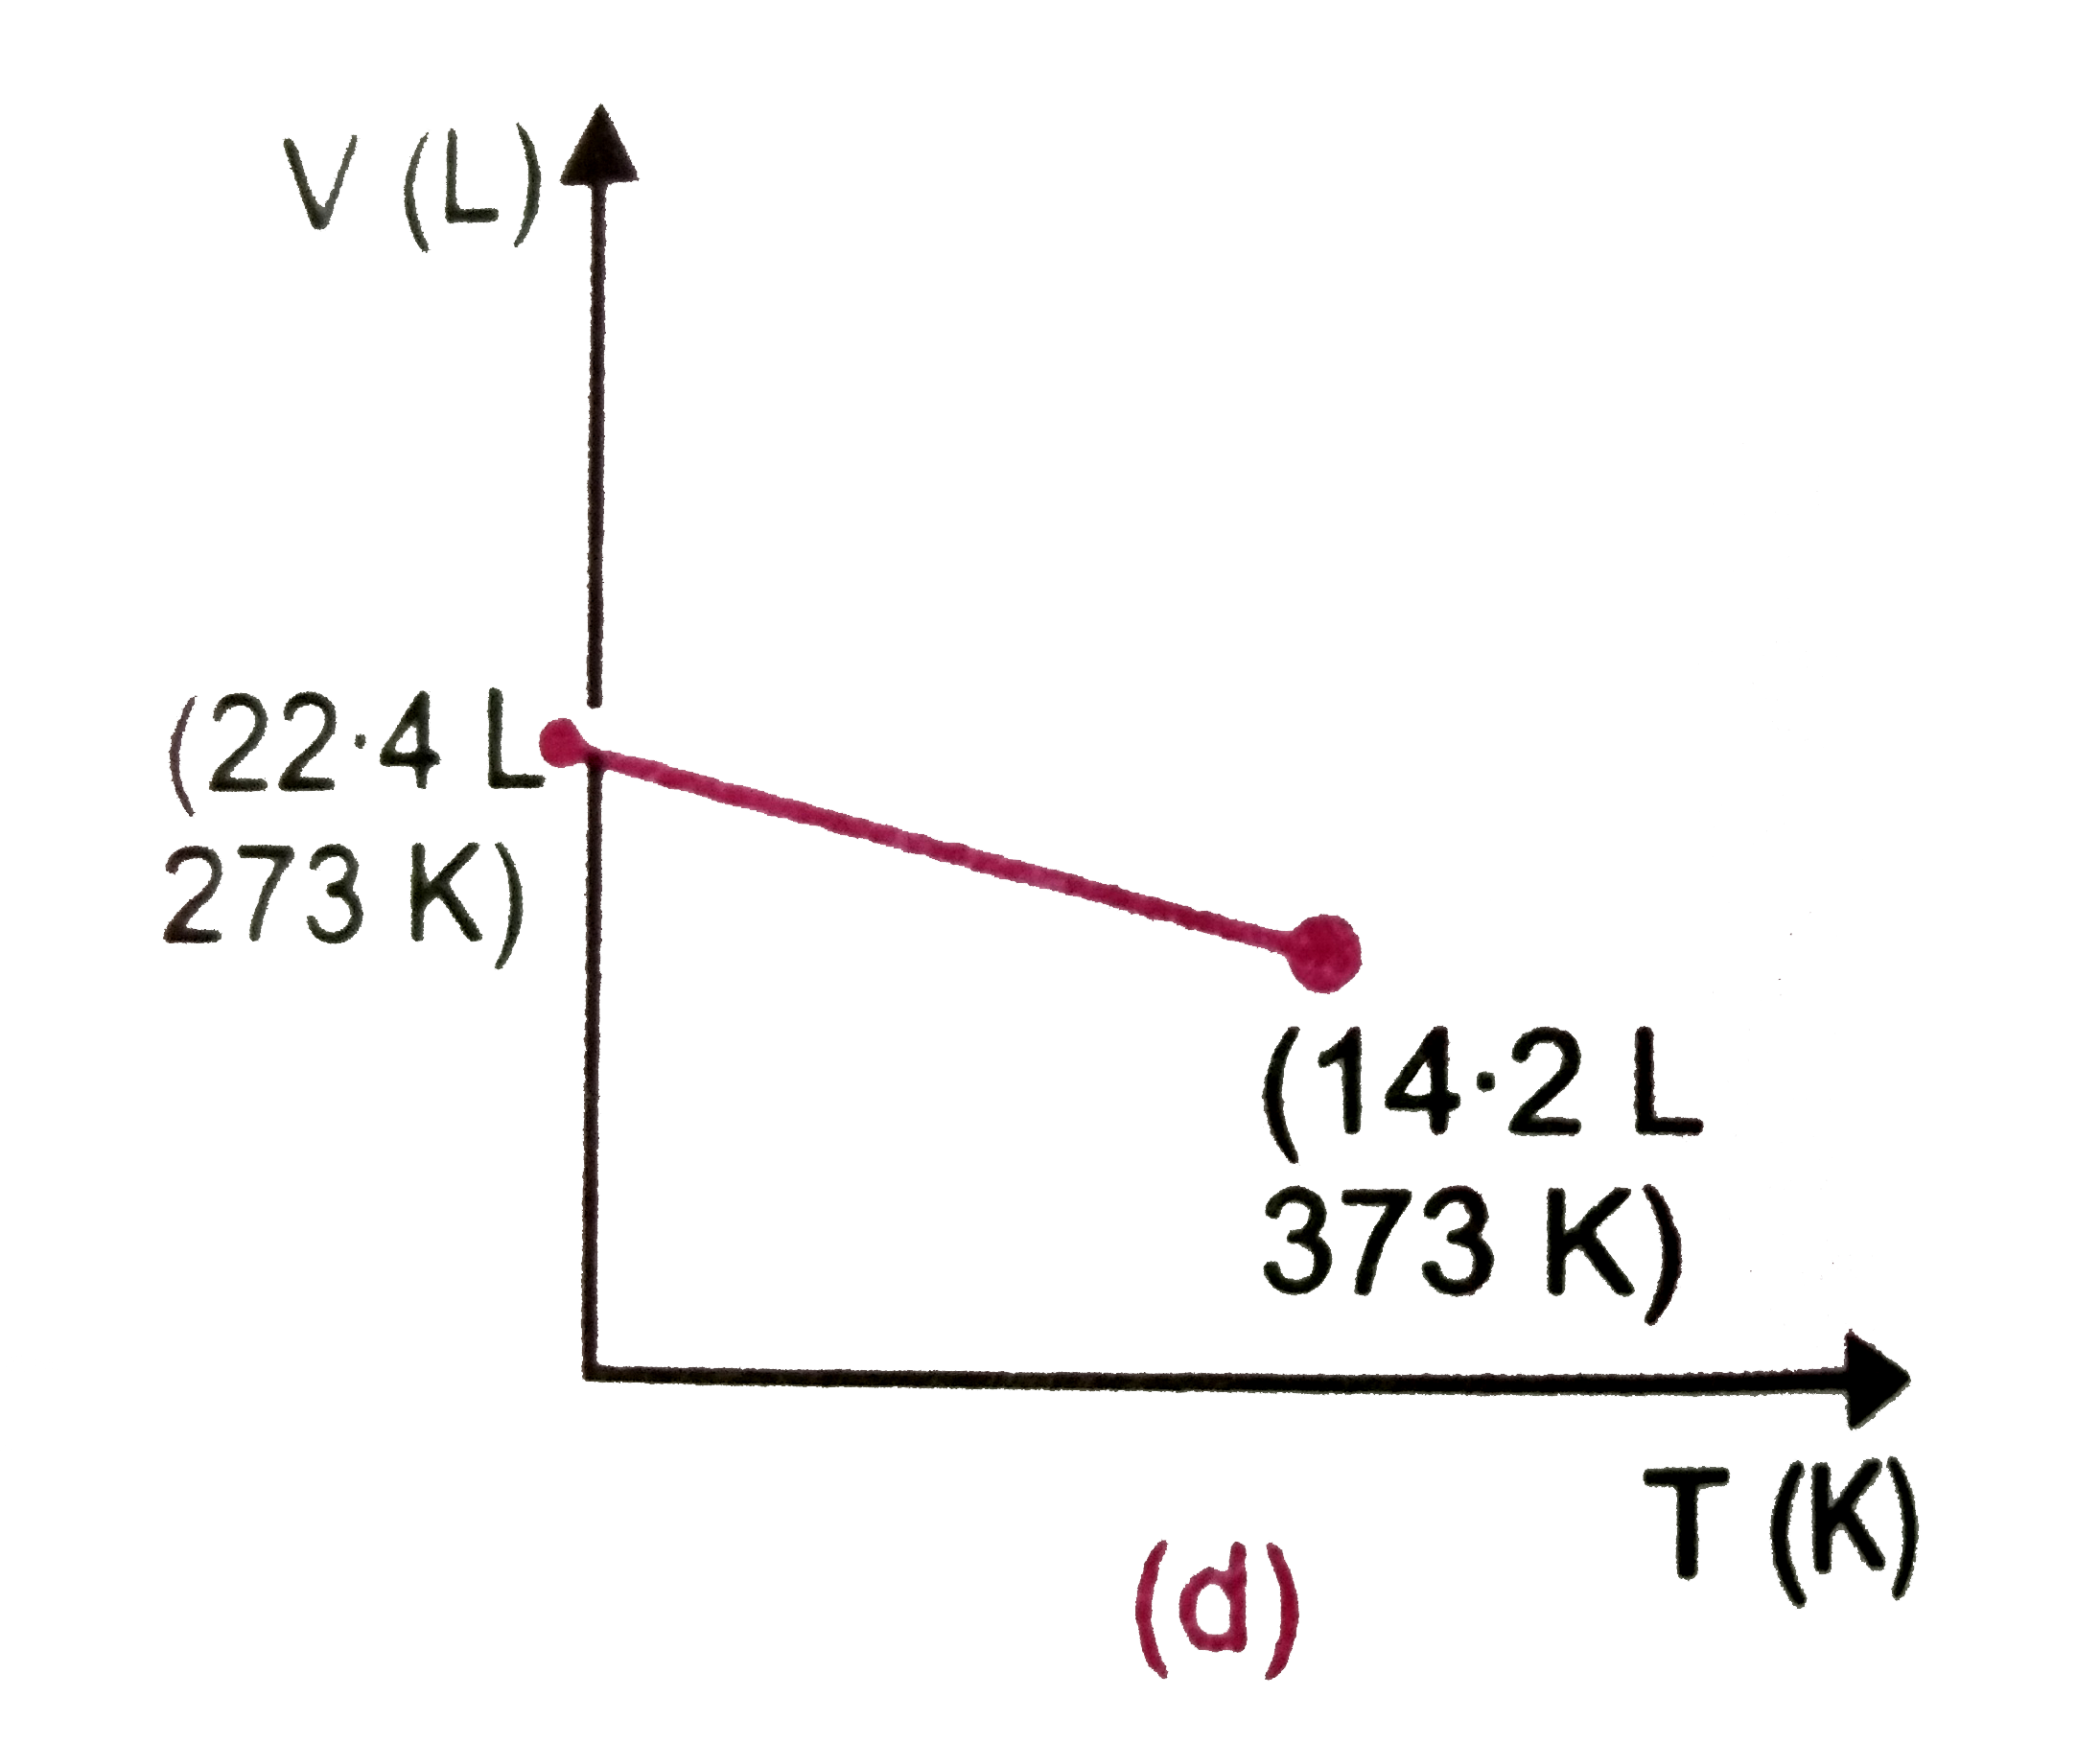
Which of the following volume (V) temperature (T) plots represents the behaviour of one mole of an ideal gas at one atmospheric pressure:
A B
B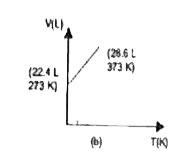 C
C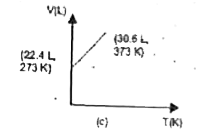 D
D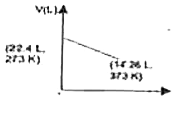
Which of the following volume-temperature (V−I) plots represents the behaviour of 1mole of an ideal gas at the atmospheric pressure?
View SolutionWhich of the following volume-temperature (V−I) plots represents the behaviour of 1mole of an ideal gas at the atmospheric pressure?
View SolutionThe K.E. of one mole of an ideal gas is
View SolutionThe kinetic energy of one mole of an ideal gas
View SolutionThe kinetic energy of one mole of an ideal gas
View Solution
