The curves (a),(b),(c) and (d) show the variation between the applied potential difference (V) and the photoelectric current (i) , at two different intensities of light (I1>I2). In which figure is the correct variation shown ?
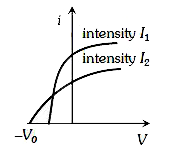
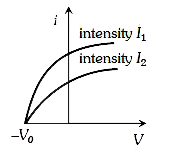
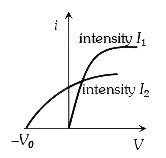
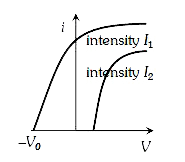
The correct Answer is:B
V0 does not depend on intensity and current ∝ intensity ,
∴i1>i2
Similar Questions
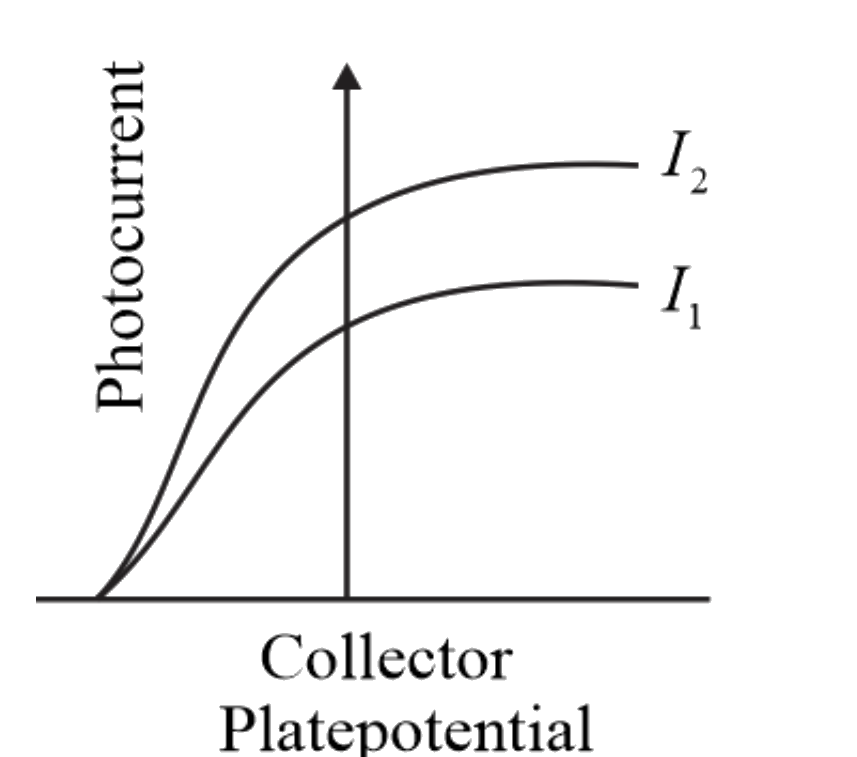
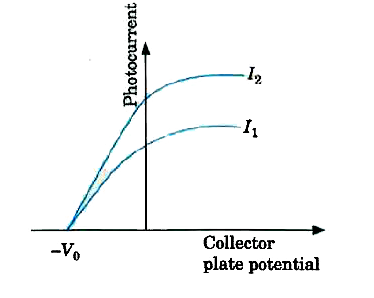
From the following graph of photocurrent against collector plate potential for two different intensities of light I1andI2 one can , conclude
View SolutionPlot a graph showing the variation of photoelectric current with anode potential for two light beam of same wavelength but different intensity.
View Solution
Knowledge Check
The curve between current (i) and potential difference (V) for a photo cell will be
A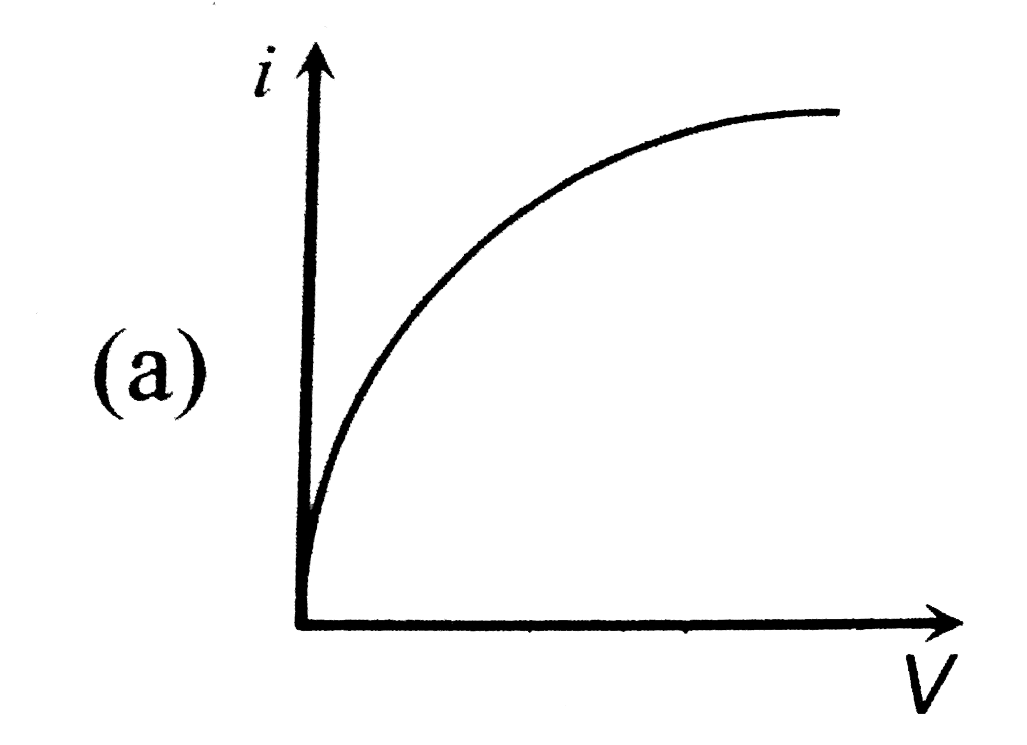 B
B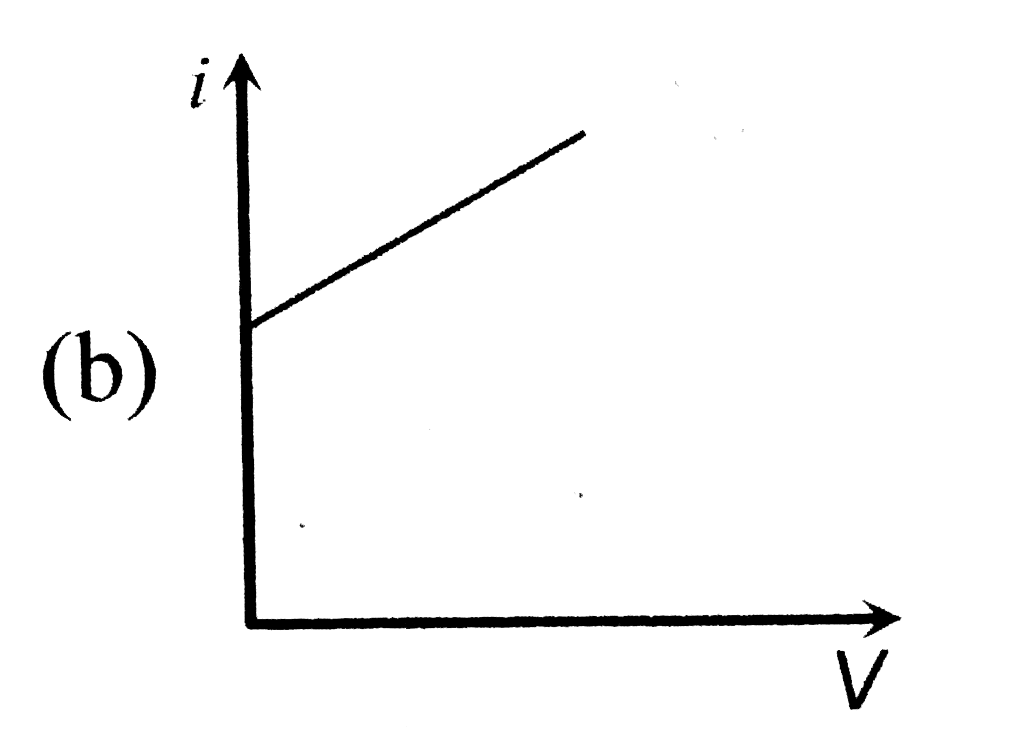 C
C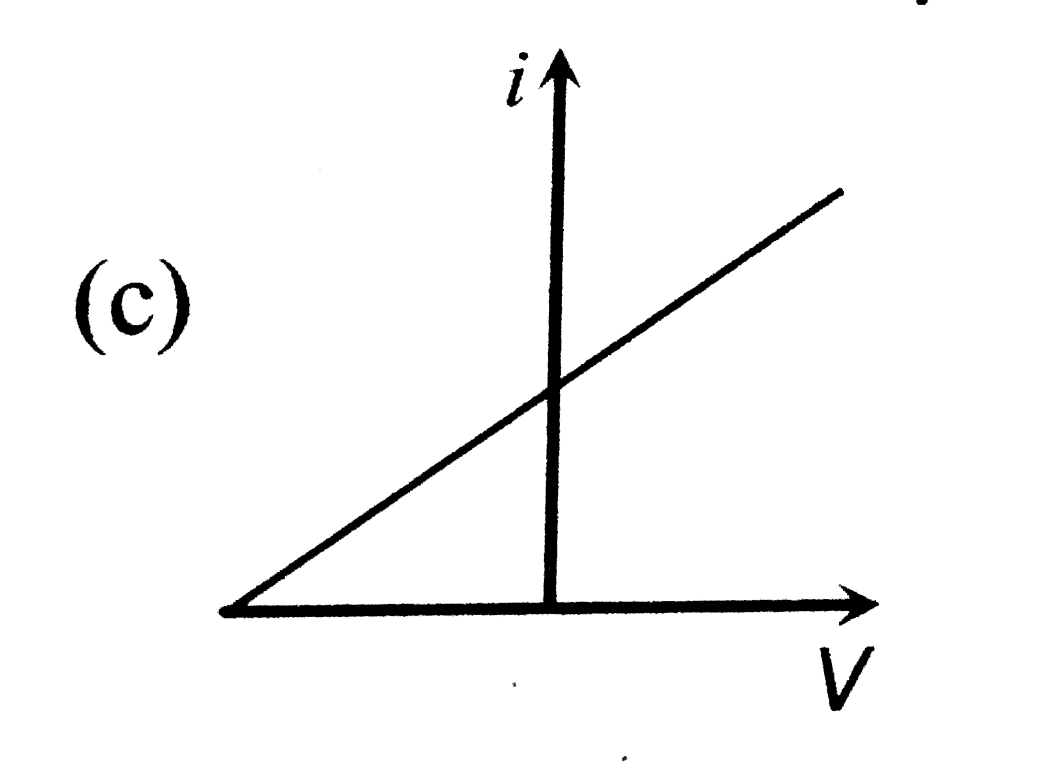 D
D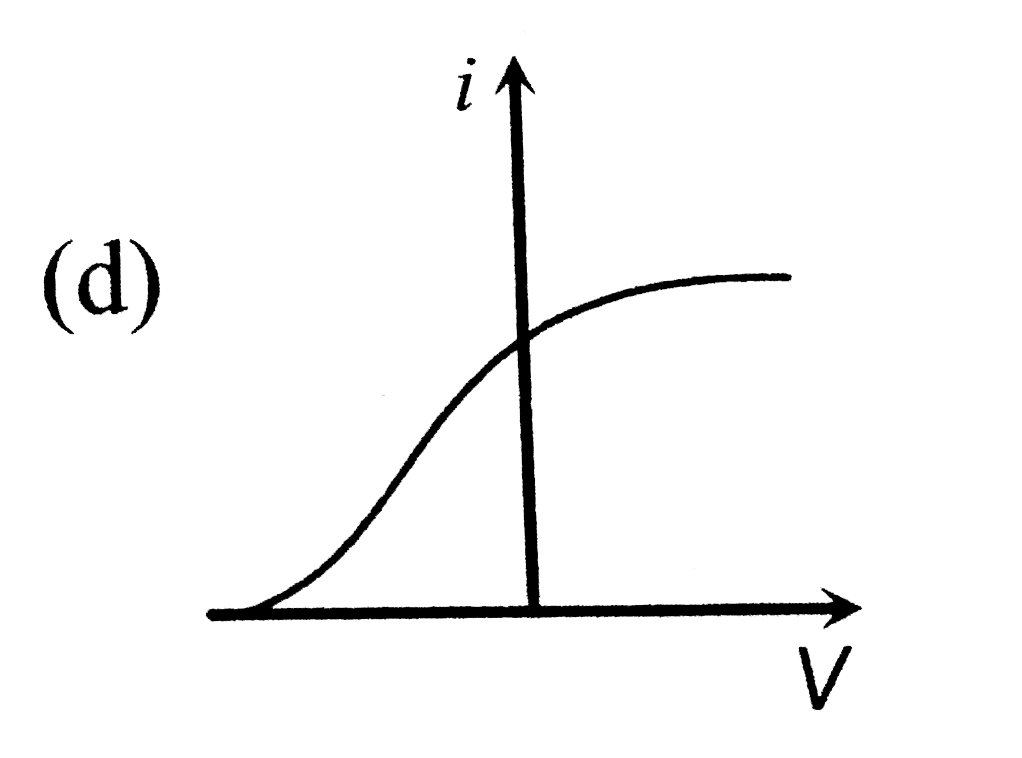
For a metallic wire, the ratio Vi(V=applied potential difference and i= current flowing)is
Aindependent of temperatureBincreases as the temperature risesCdecreases as the temperature risesDincreases or decreases as temperature rises depending upon the metalFor a metallic wire, the ratio Vi(V=applied potential difference and i= current flowing)is
Aindependent of temperatureBincreases as the temperature risesCdecreases as the temperature risesDincreases or decreases as temperature rises depending upon the metal
For a metallic wire, the ratio Vi ( V= applied potential difference and i= current flowing ) is
View SolutionThe potential difference (VA−VB) between the point A and B as shown in the figure is
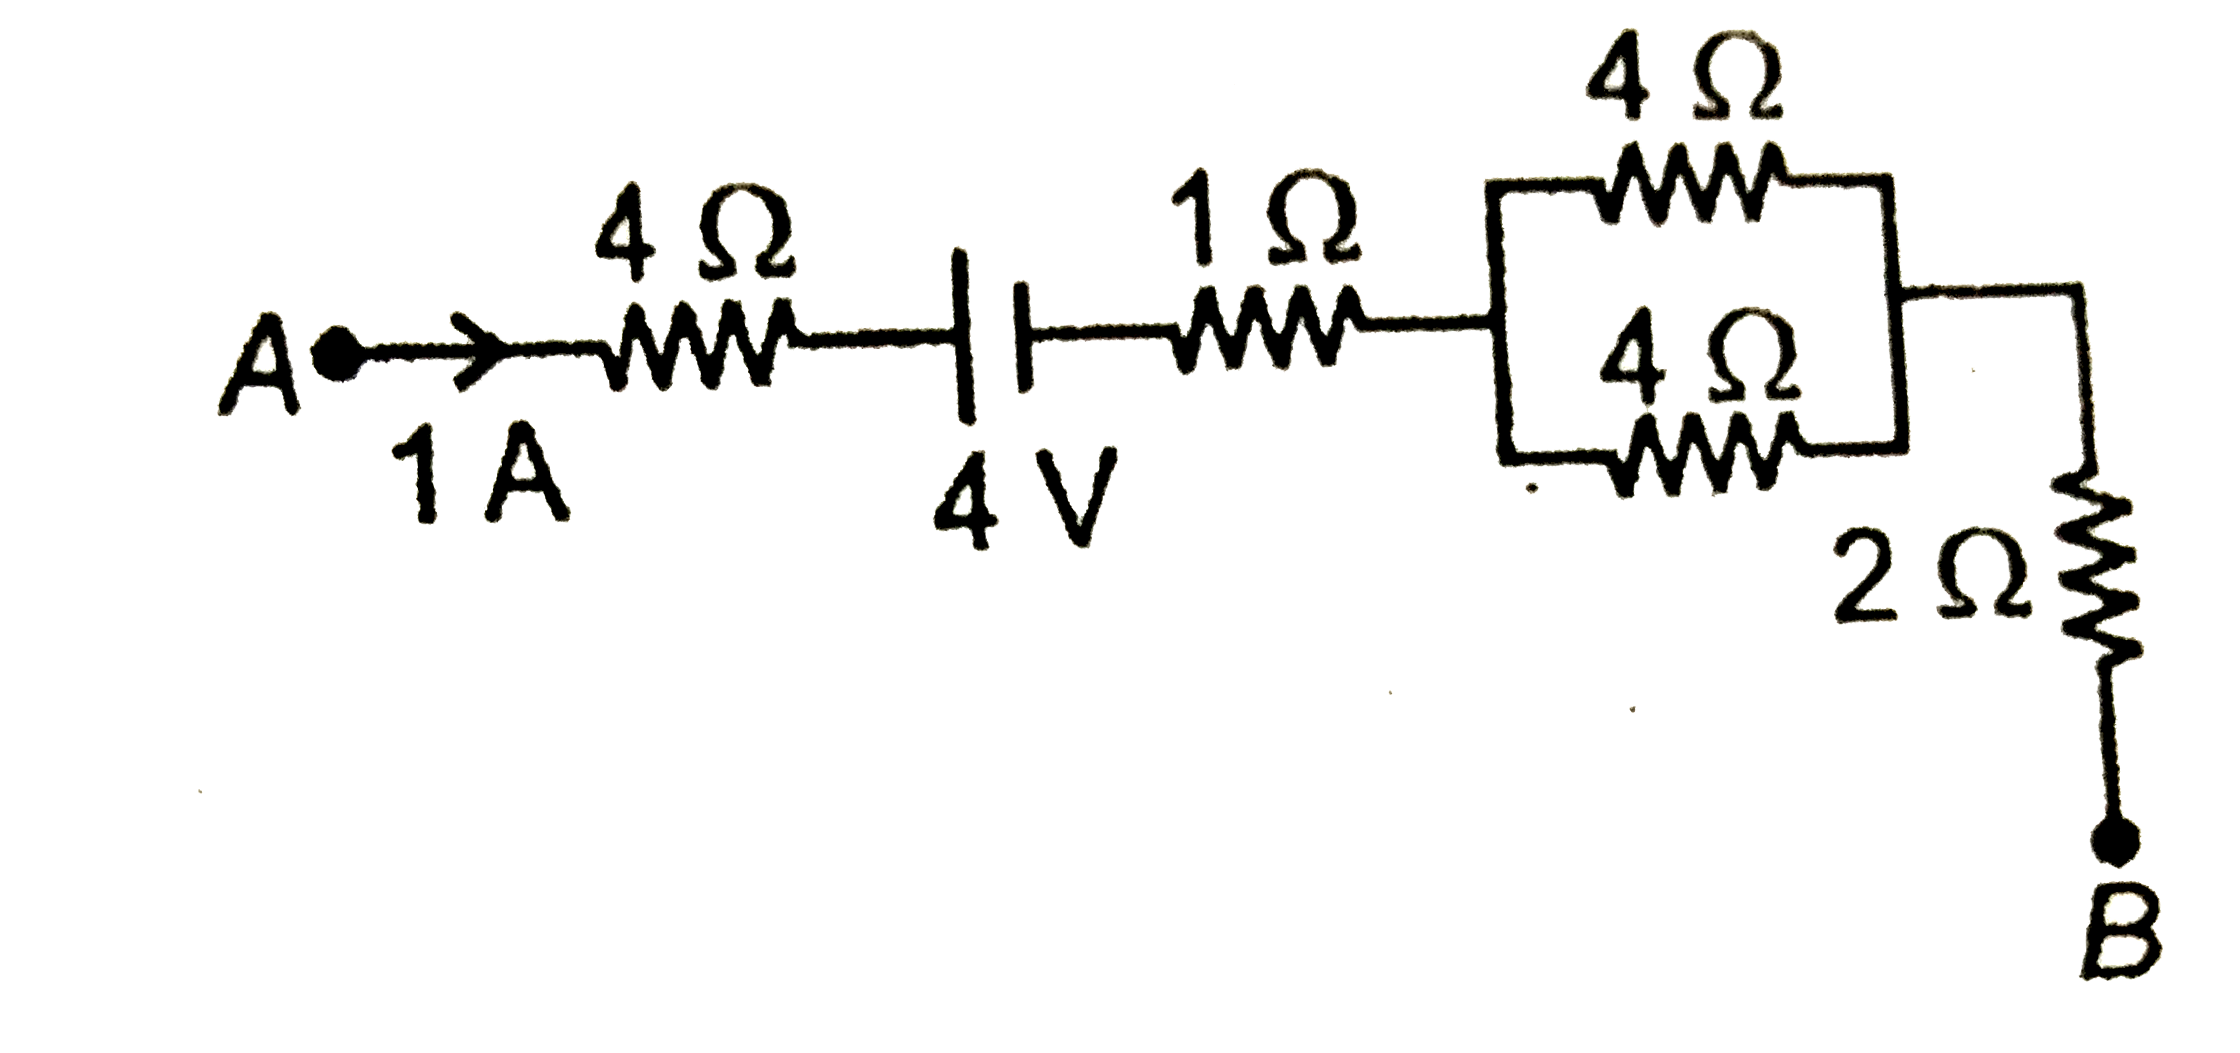
View SolutionThe relation between potential difference (V) and current (I) was discovered by:
A) Pascal
B) Tesla
C) Newton
D) Ohm
View SolutionFrom the following graph of photocurrent against collector plate potential, for two different intensities of light I1andI2 one can conclude.
View SolutionIn photoelectric effect , the curve between photoelectric current and anode potential V (for different frequencies ) is shown in figure , then
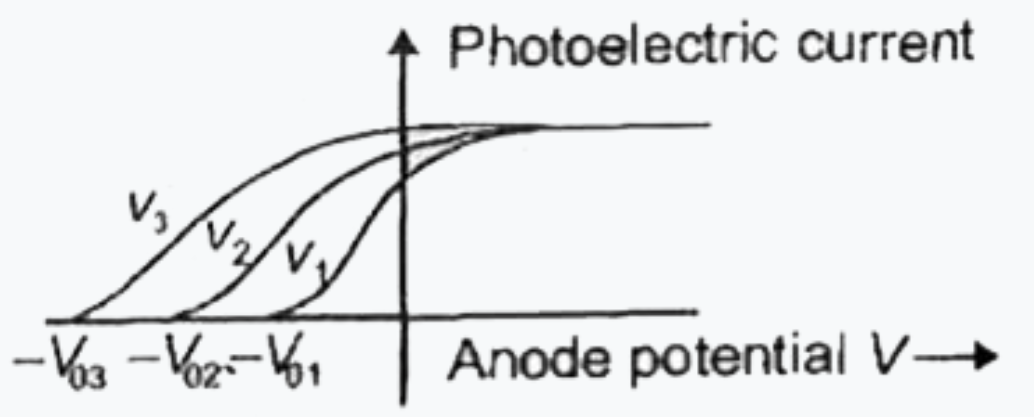
View Solution
