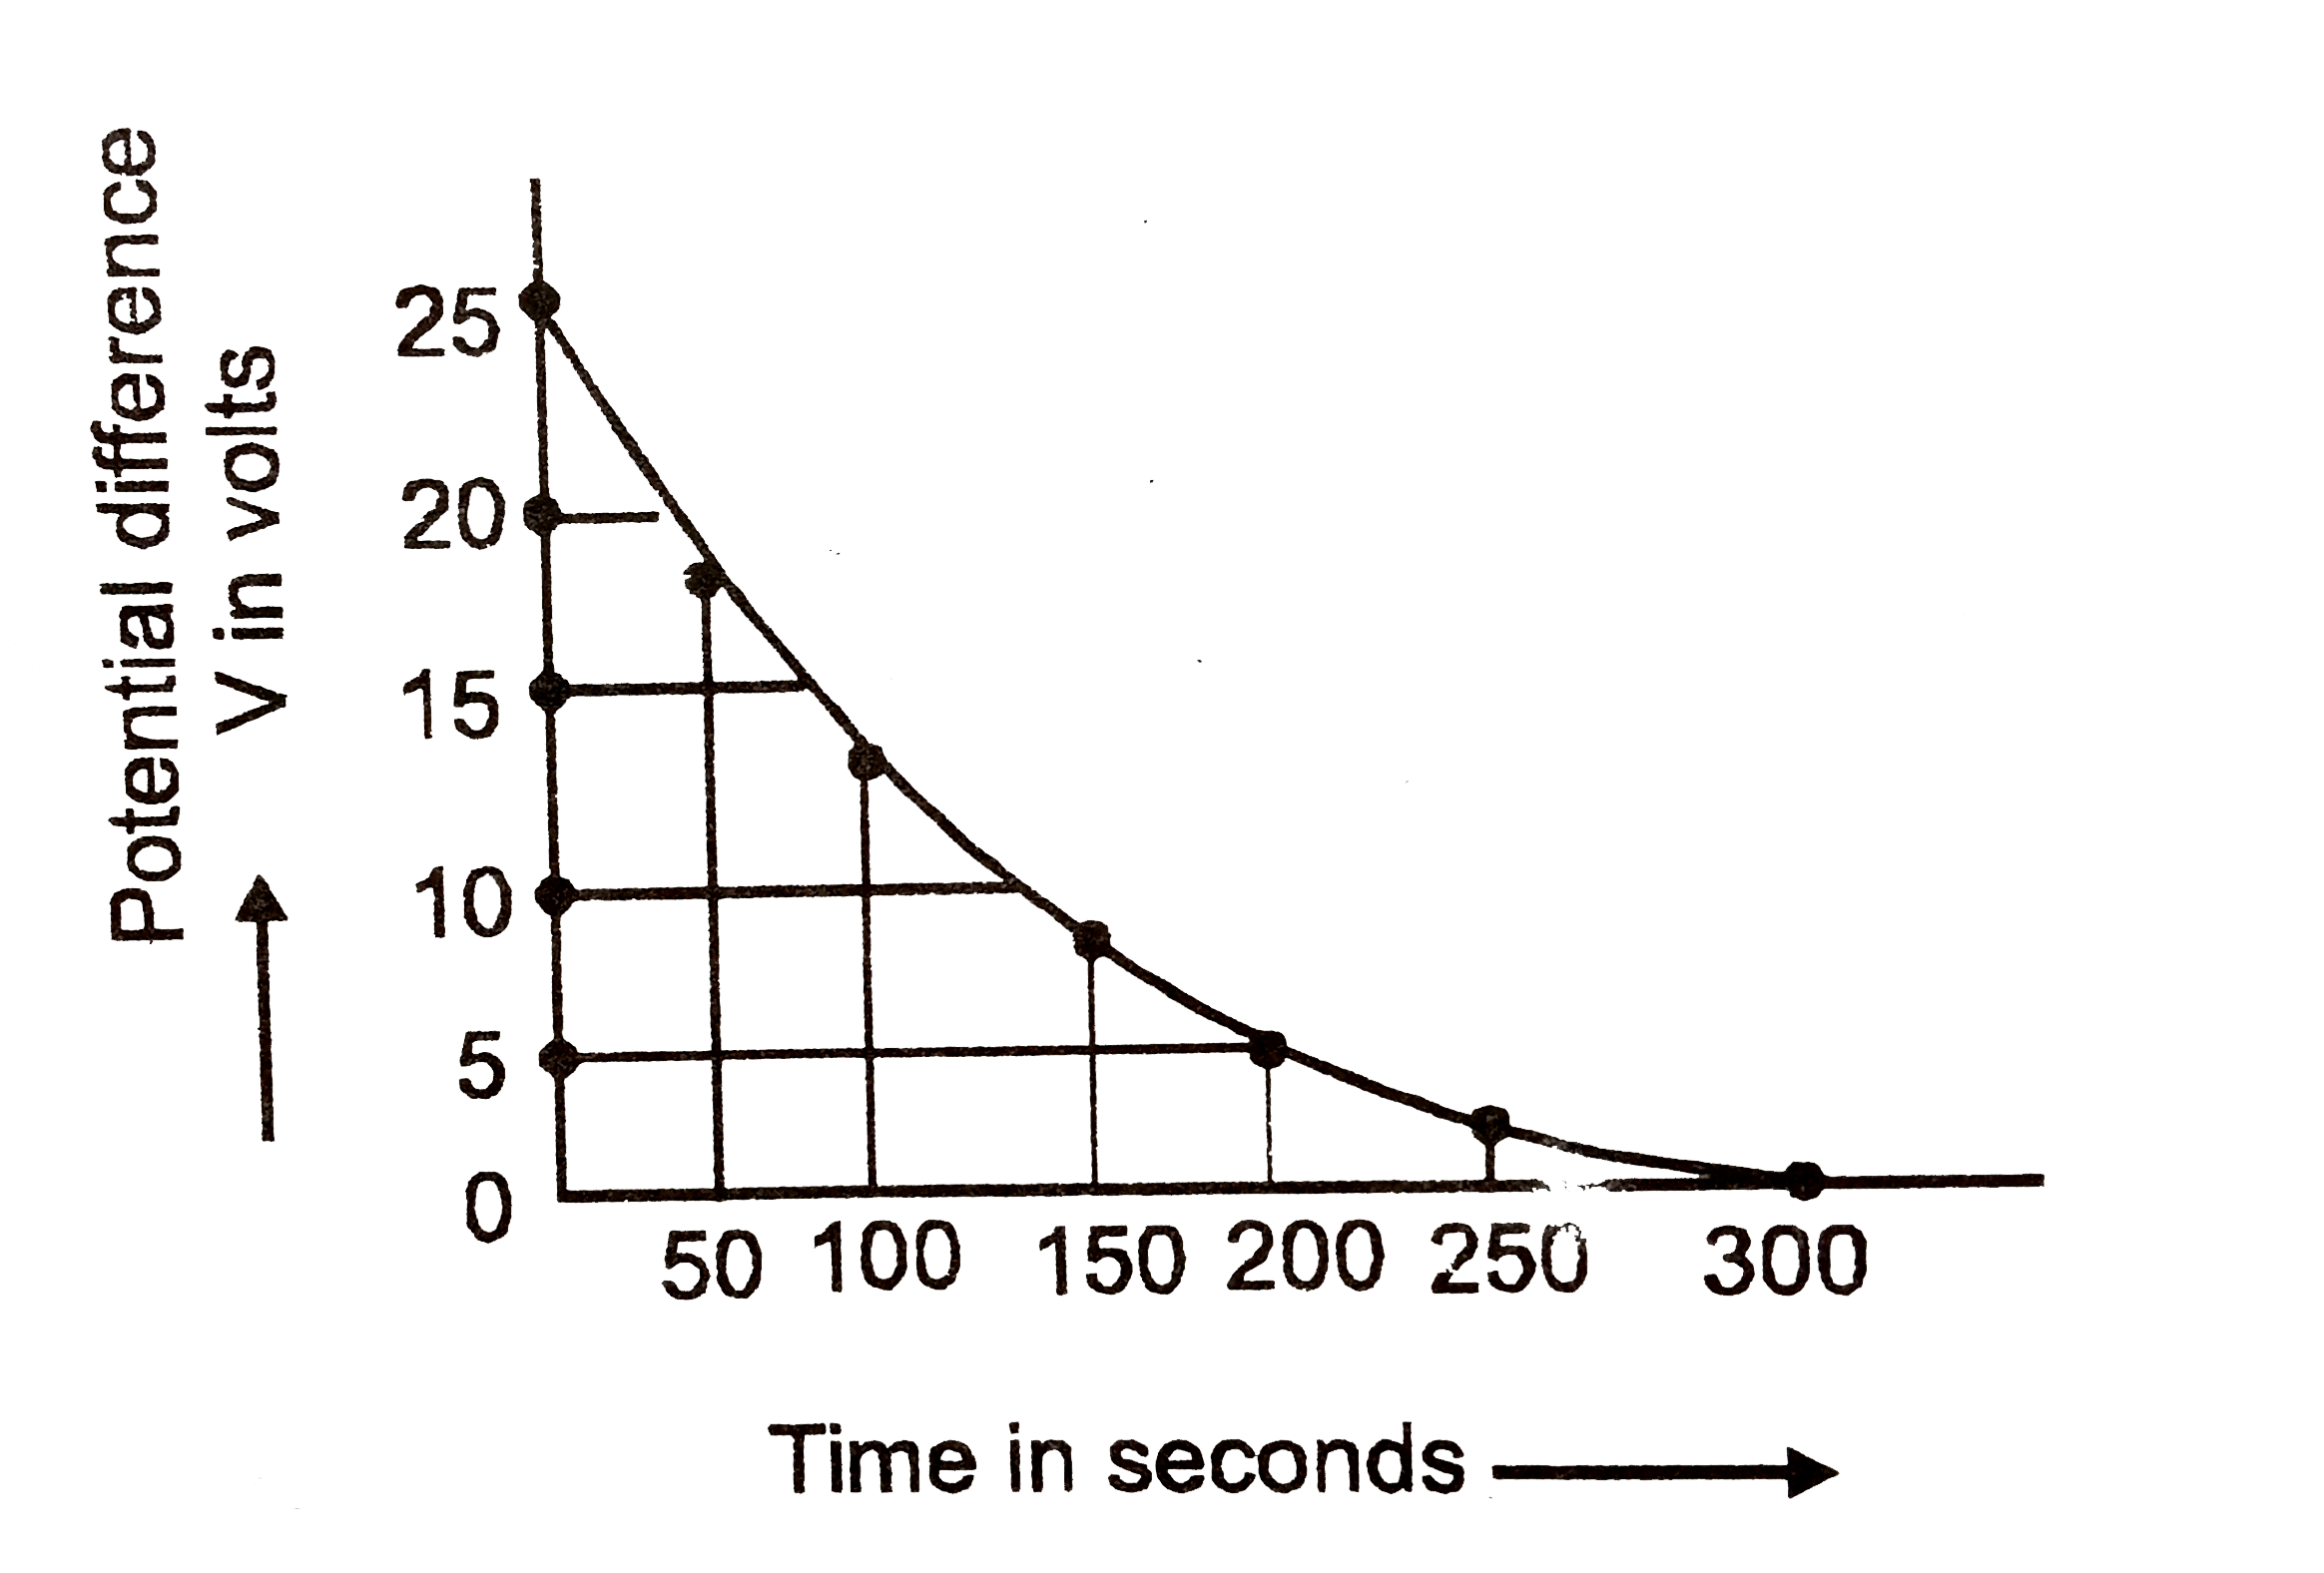
The figure shows an experimental plot discharging of a capacitor in an RC circuit. The time constant of this circuit lies between:

A
150 sec and 200 sec
B
0 and 50 sec
C
50 sec and 100 sec
D
100 sec and 150 sec
Video Solution
Text Solution
The correct Answer is:D
For discharging of an RC circuit,
V=V0e−t/τ
So, when V=V02
V02=V0e−t/τ
ln12=−tτ⇒τ=1ln2
From graph when V=V02,t=100s
∴τ=100ln2=144.3sec.
So, time constant (τ) lies between 100 and 150 sec.
|
Similar Questions
IN A CHARGING RC CIRCUIT, CHARGE ON A CAPACITOR AFTER 1 TIME CONSTANT IS
View SolutionHow many time constants will elapse before the charge on a capacitor falls to 0.1%of its maximum value in a discharging RC circuit.
View SolutionThe figure shows an experimental plot discharging of a capacitor in an RC circuit. The time constant of this circuit lies between:
View Solution
चित्र एक R-C परिपथ में संधारित्र के अनावेशित होने का प्रायोगिक प्लॉट दर्शाता है। इस परिपथ का समय स्थिरांक τ इसके बीच में पड़ता है।
View SolutionCharging and Discharging OF Capacitors||RC- Circuits||Examples
View SolutionRC Circuit #!#Charging of Capacitor
View SolutionDischarging of Capacitor in a RC Circuit
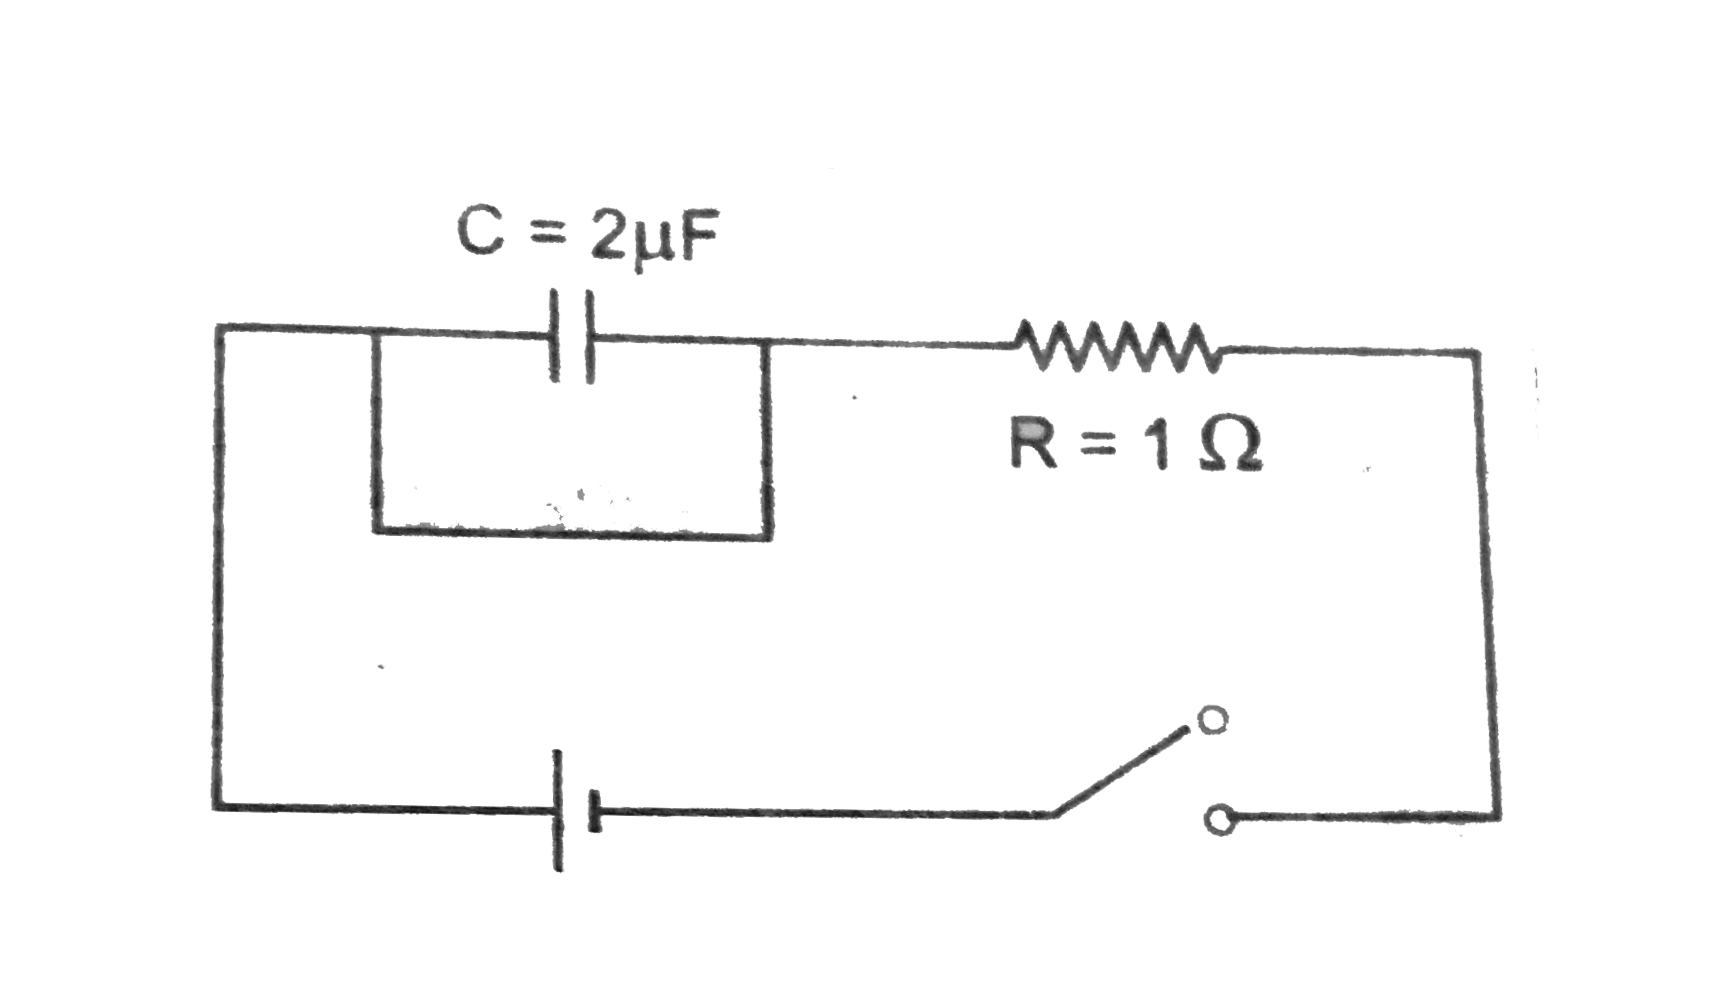
View SolutionThe capacitive time constant of the RC circuit shown in the figure.

View Solution
