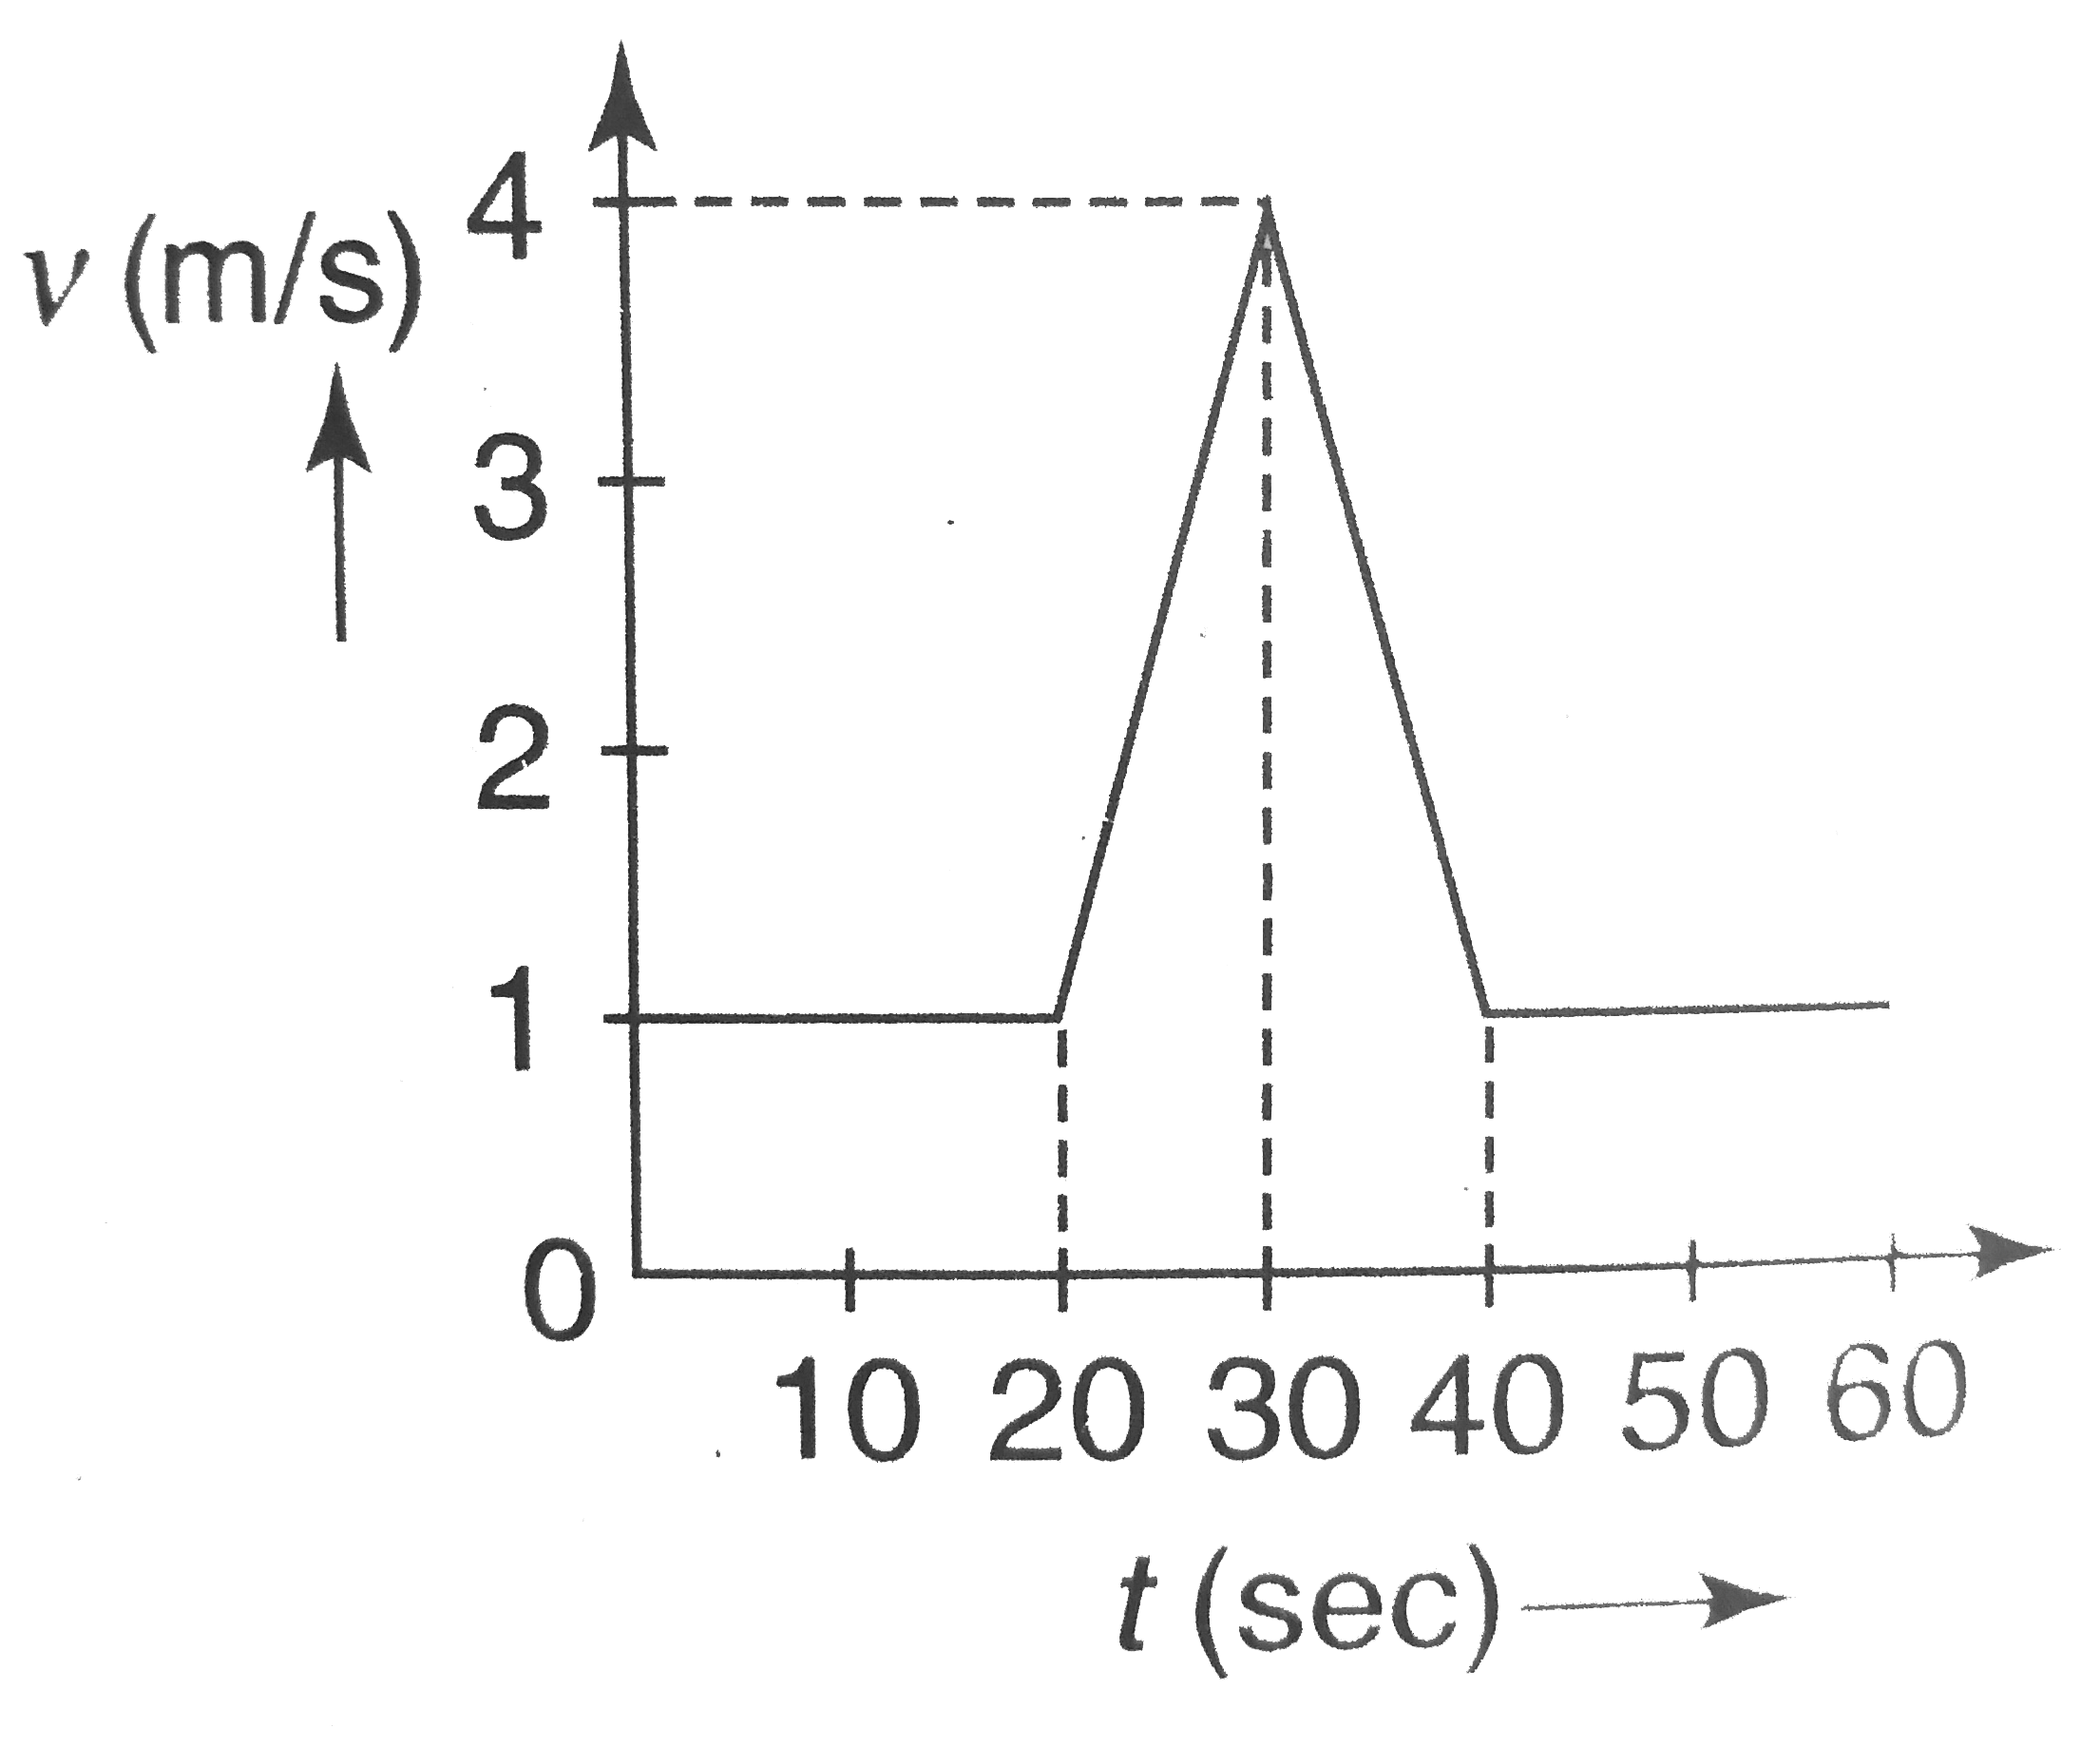
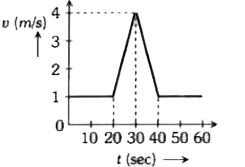
Velocity-time graph for a moving object is shown in the figure. Total displacement of the object during the time interval when there is non-zero acceleration and retardation is.

60m
50m
30m
40m
The correct Answer is:B
Distance travelled = Area under v −t graph in time interval 20 to 40 sec
=12×20×3+20×1=50m
Similar Questions
किसी गतिशील वस्तु का वेग-समय ग्राफ चित्र में दर्शाया गया है। उस समयान्तराल में, जिसमें वस्तु का त्वरण तथा मंदन अशून्य रहता है, कुल विस्थापन है
 04:07View Solution
किसी वस्तु का वेग-समय ग्राफ चित्रानुसार है। 0 से t4 क्षण के समय अन्तराल के दौरान विस्थापन होगा :-
 02:44View Solution
Acceleration-time graph of a moving object is shown in figure. Draw the velocity- time graph and displacement-time graph corresponding to this type of motion. .
06:59View SolutionVelocity -time (v-t) graph for a moving object is shown in the figure. Total displacement of the object during the time interval when there is non-zero acceleration and retardation is
 05:23View Solution
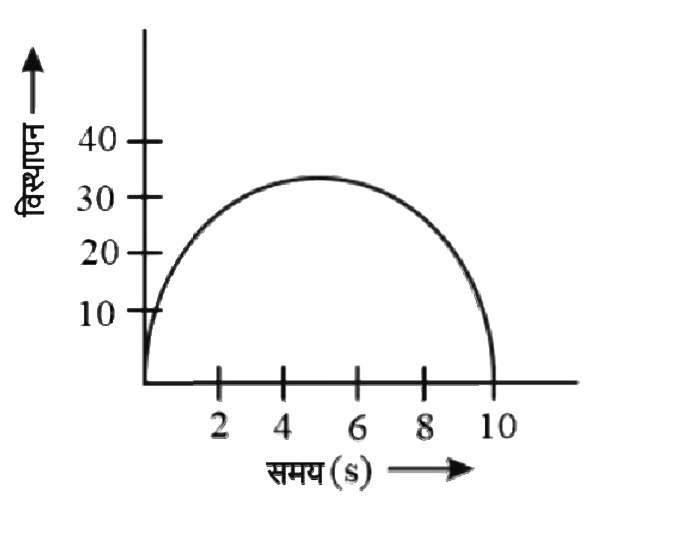
एकल विकल्पी एक गतिमान वस्तु का विस्थापन-समय ग्राफ चित्र में दिखाया गया है। चित्र में दिखाए गए वेग-समय ग्राफ में से कौन-सा समान पिंड की गति को प्रदर्शित कर सकता है?
 03:19View Solution
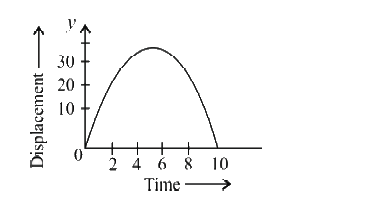
The displacement-time graph of a moving object is shown in figure. Which of the velocity-time graphs shown in figure could represent the motion of the same body ?
 02:37View Solution
Velocity-time graph for a moving object is shown in the figure. Total displacement of the object during the time interval when there is non-zero acceleration and retardation is.
 01:51View Solution
Velocity-time graph for a moving object is shown in the figure. Total displacement of the object during the time interval when there is non-zero acceleration and retardation is.
 01:28View Solution

