Direction: Refer to the pie charts and answer the given question:
Data regarding number of foreign students (male + female) from different countries A, B, C, D and E, studying in higher education level in the country XYZ in the year 2014
Total number of foreign students (male+females)=9000
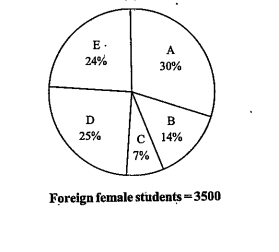
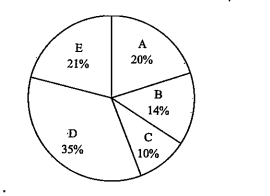
Female students from country D are what per cent more than those from country B?
45
150
40
60
The correct Answer is:B
Step by step video & text solution for Direction: Refer to the pie charts and answer the given question:Data regarding number of foreign students (male + female) from different countries A, B, C, D and E, studying in higher education level in the country XYZ in the year 2014Total number of foreign students (male+females)=9000Female students from country D are what per cent more than those from country B? by Maths experts to help you in doubts & scoring excellent marks in Class 14 exams.
Updated on:21/07/2023Similar Questions
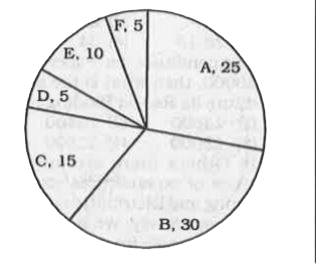
Study the given pie chart and answer the question that follows
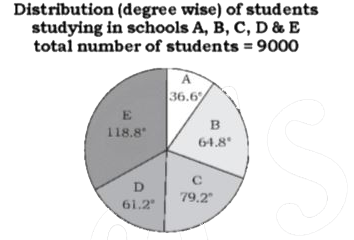
The total number of students in schools D and E is what percentage more than the number of students in schools B and C?
View SolutionStudy the given pie chart and answer the question that follows
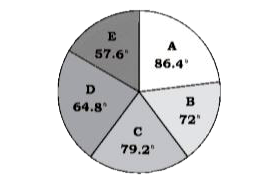
If the total number of students in schools D and E exceeds the number of students in school by x, then x lies between
View Solution
Knowledge Check
The pie chart shows the annual car production (percentage wise) of six countries A,B,C,D,E and F.
Study the pie chart and answer the question.
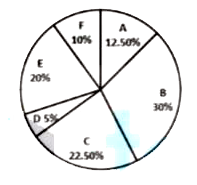
Total number of cars produced =40,00,000
The number of cars produced by country B is what percent more than that produced by country E?A0.6B0.4C0.25D0.5Study the given pie chart and answer the question that follows.
Break-up (degree-wise) of the number of students in five schools (A, B, C, D and E) in a city.
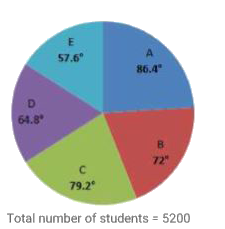
If the total number of students in schools D and E exceeds the number of students in school A by x, then x lies between:A475 and 500B550 and 575C525 and 550D500 and 525Students from different countries (A,B,C,D,E,F) participated in a certain seminar.The pie- chart shows how many students came from each of the six participating countries.Study the diagram and answer the following questions.
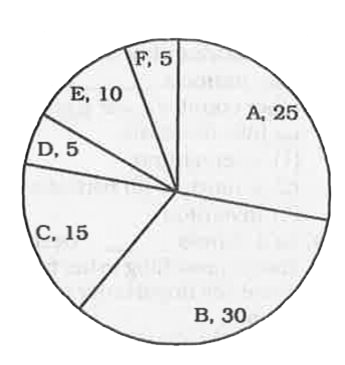
By what count (in %) students from country B at the seminar were more than the students from country E?A40B200C20D18
Read the following information carefully and answer the questions given below.
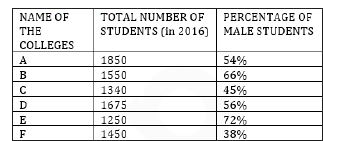
The number of female students in college C is what approx. percent of the number of male students of college A?
View SolutionStudents from different countries (A, B, C, D, E, F) participated in a certain seminar. The pie-chart shows how many students came from each of the six participating countries. Study the diagram and answer the following questions.
By what count (in %) students frm country B at the seminar were more than the students from country E?
View SolutionDirections (Q. Nos. 11-15) Study the radar graph carefully and answer the questions that follow.
Number of students (in thousand) in two
different universities in six different years.
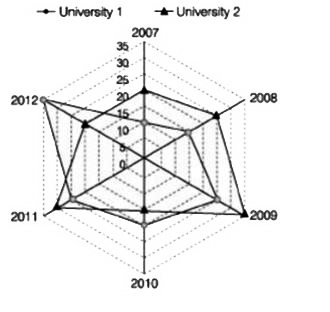
If 25% of the students in University 2 in the year 2010 were females, what was the number of male students in the University 2 in the same year?
View SolutionRead the following pie-chart carefully and answer the questions given below :
Distribution of total voters from six different cities and the distribution of female voters among these cities.
Total number of voters=64000
Ratio of males and females = 5 : 3
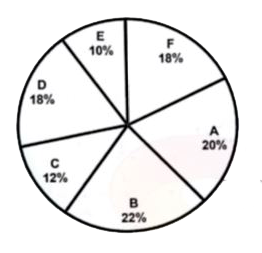
Percentage distribution of female voters
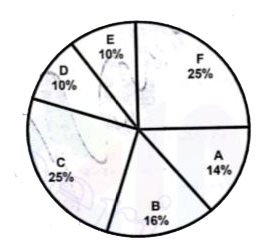
The number of female voters in city D is what percent of the male voteres in city A ? (approx)
View SolutionStudy the given graph and answer the question that follows.
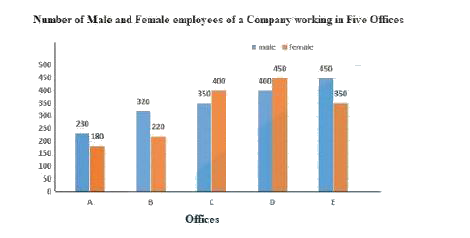
The total number of female employees of the company in offices B, D and E is what percentage less than the total number of male employees in offices A, B, C and E (correct to one decimal place)?
View Solution
