The diagram given here is the standard ECG of a normal person. The P-wave represents the

A
End of systole
B
Contraction of both the atria
C
Initiation of the ventricular contraction
D
Beginning of the systole
Video Solution
Text Solution
The correct Answer is:B
ECG refers to electrocardiograph and it is measured by instrument called electrocardiogram. It measure potential difference of atrium and ventricles of heart.
P wave: Atrial systole
QRS wave: Ventricular systole
T wave: Ventricular diastole.
|
Similar Questions
Knowledge Check
In the standard ECG of a normal person, the P-wave represents the
Aatrial depolarisationBventricular depolarisationCatrial repolarisationDventricular repolarisationThe diagram given here is the representation of
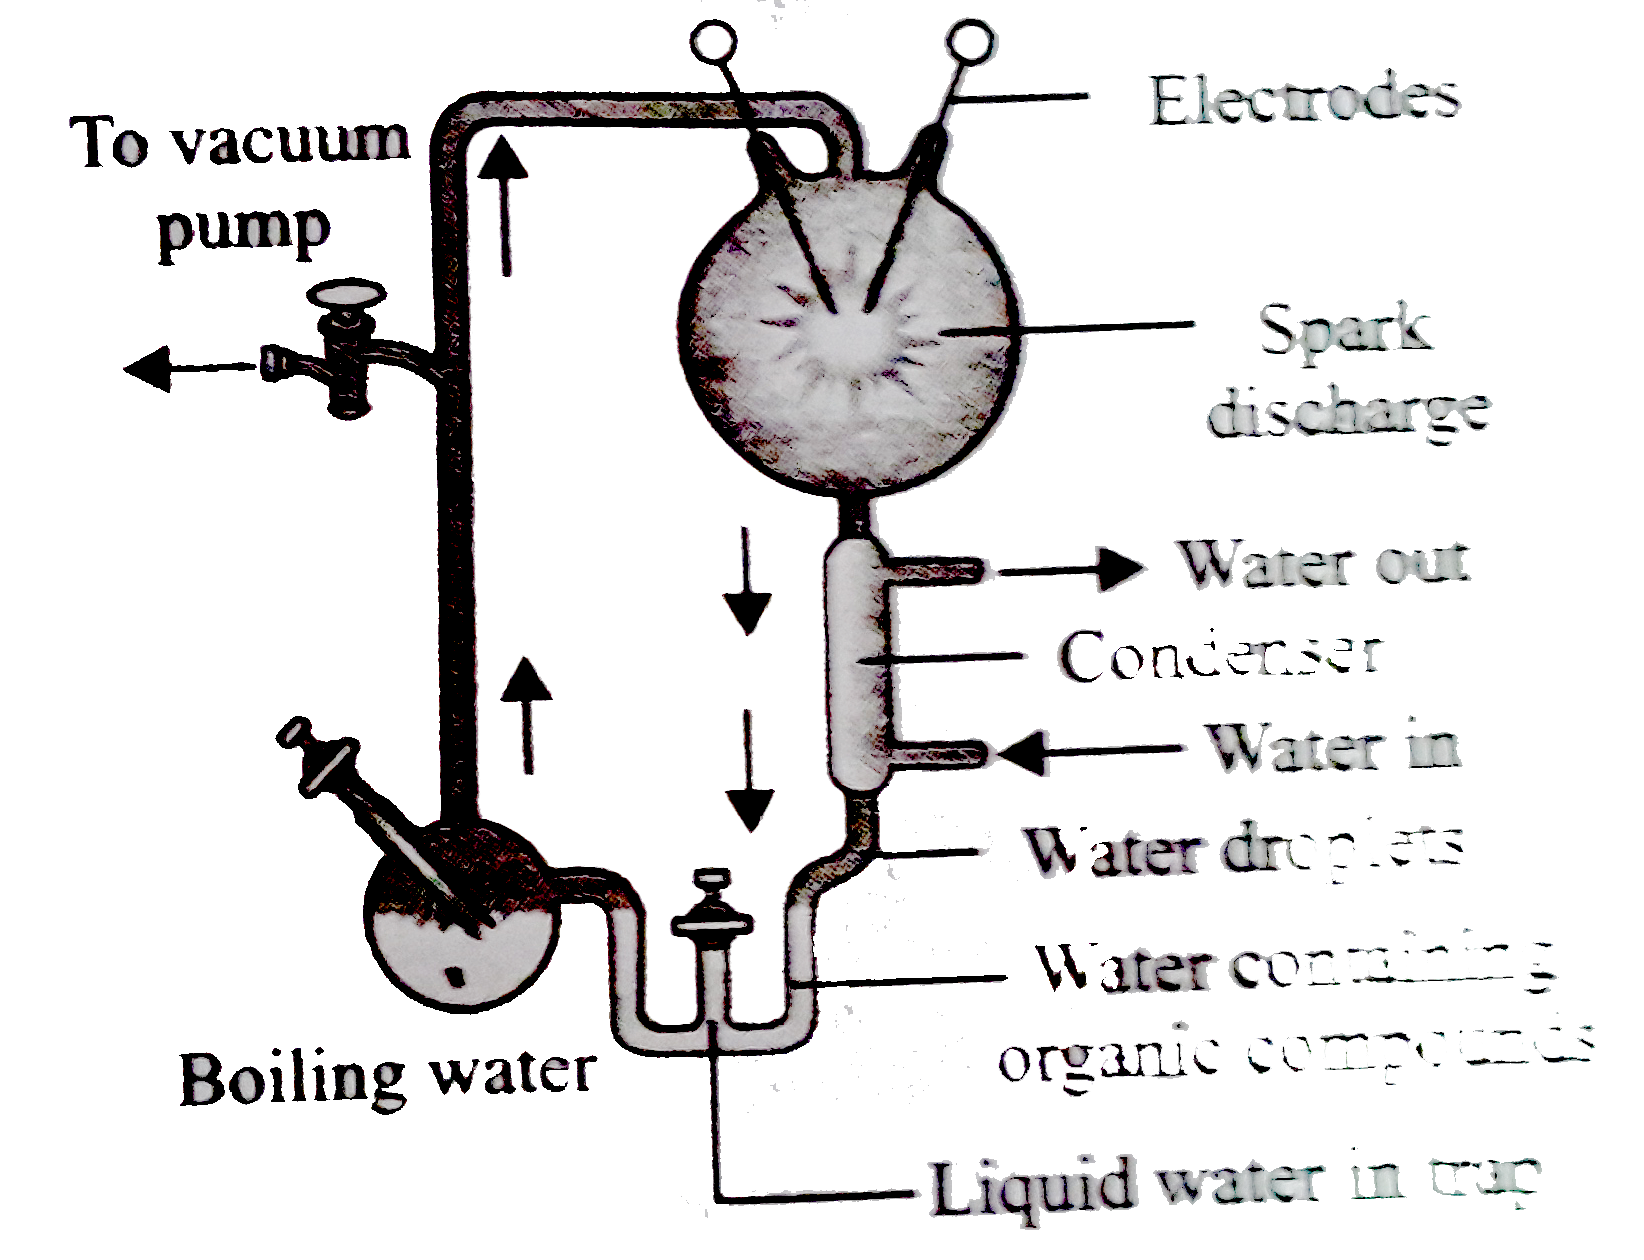
 AMiller's experimentBRedi's experimentCLouis pasteur's experimentDSpallanzani's experiment
The diagram given below represents
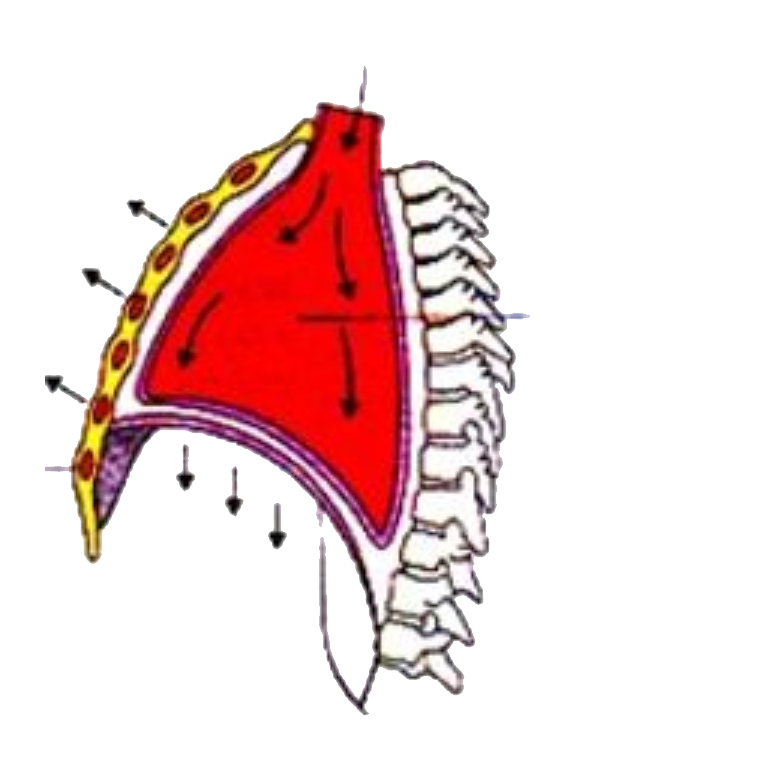
 AinspirationBexpirationCSystoleDdiastole


