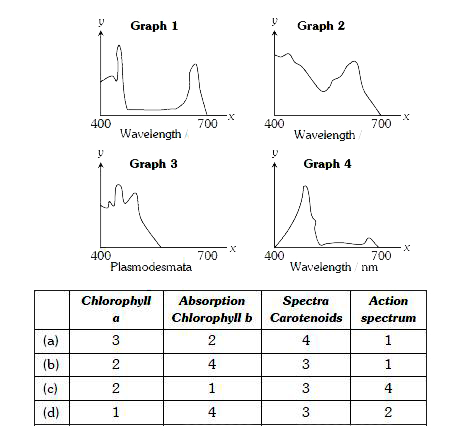
Three of the graphs below show the absorption spectra of photosynthetic pigments. One graph shows the action spectrum of photosynthesis for a plant containing the pigments
The entire x-axis show wavelength. Three of the y-axis show light absorption. One y-axis shows the rate of photosynthesis
The correct Answer is:D
Step by step video & text solution for Three of the graphs below show the absorption spectra of photosynthetic pigments. One graph shows the action spectrum of photosynthesis for a plant containing the pigments The entire x-axis show wavelength. Three of the y-axis show light absorption. One y-axis shows the rate of photosynthesis by Biology experts to help you in doubts & scoring excellent marks in Class 11 exams.
Updated on:21/07/2023Similar Questions
Three of the graphs below show the absortion spectra of photosynthetic pigments. One graph shows the action spectrum of p'hotosynthesis for a plant containing the pigments.
All the x axis show wavelength. Three of the y axis show light absorption. One y axis shows the rate of photosynthesis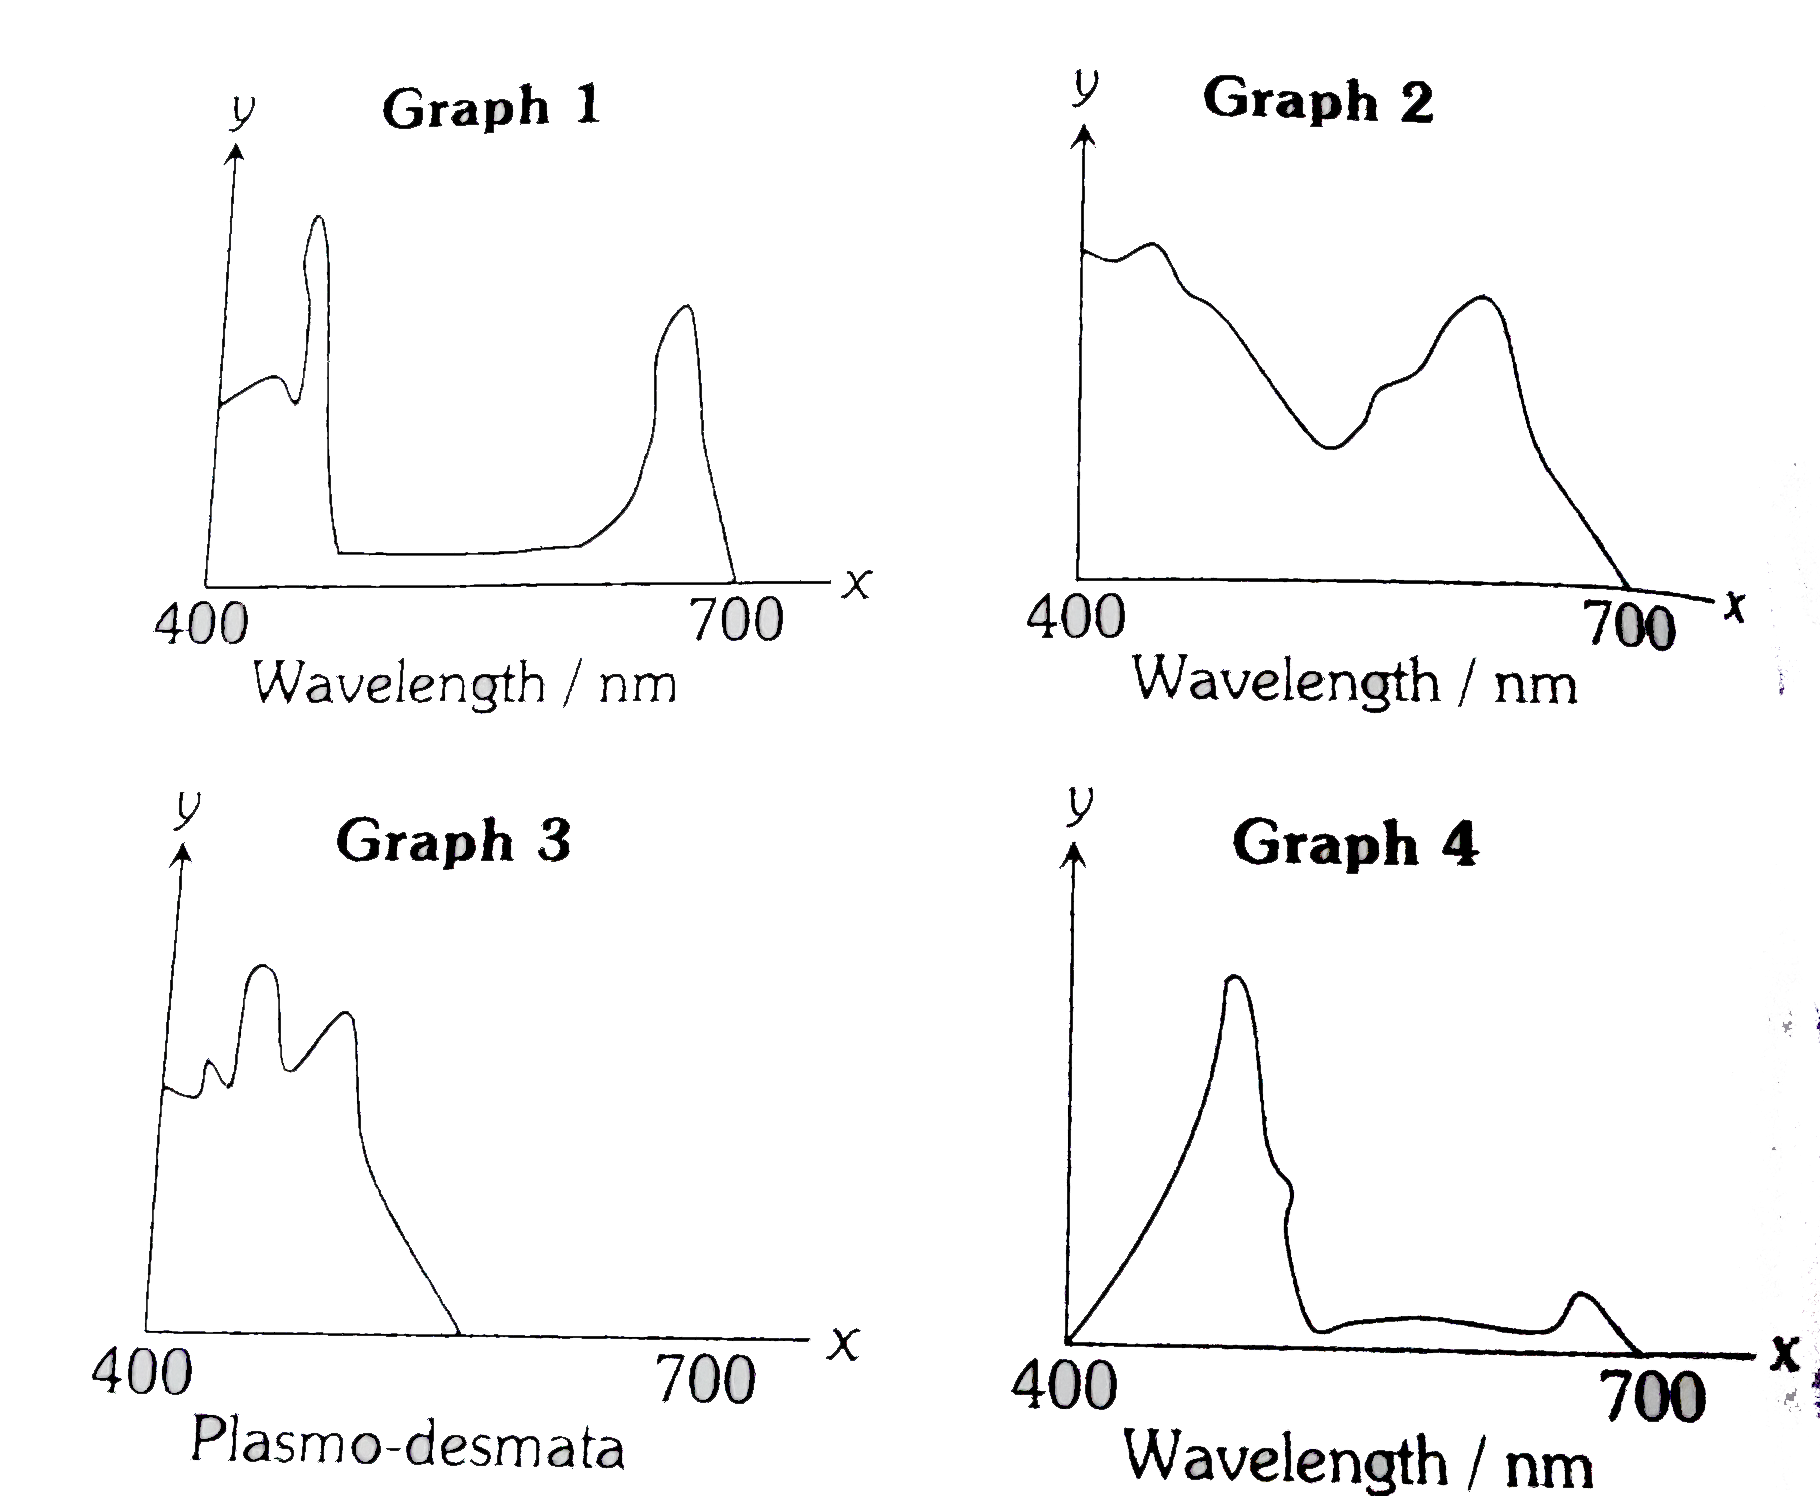

View SolutionThe graph showing rate of photosynthesis at different wavelength of light is called
View Solution
Knowledge Check
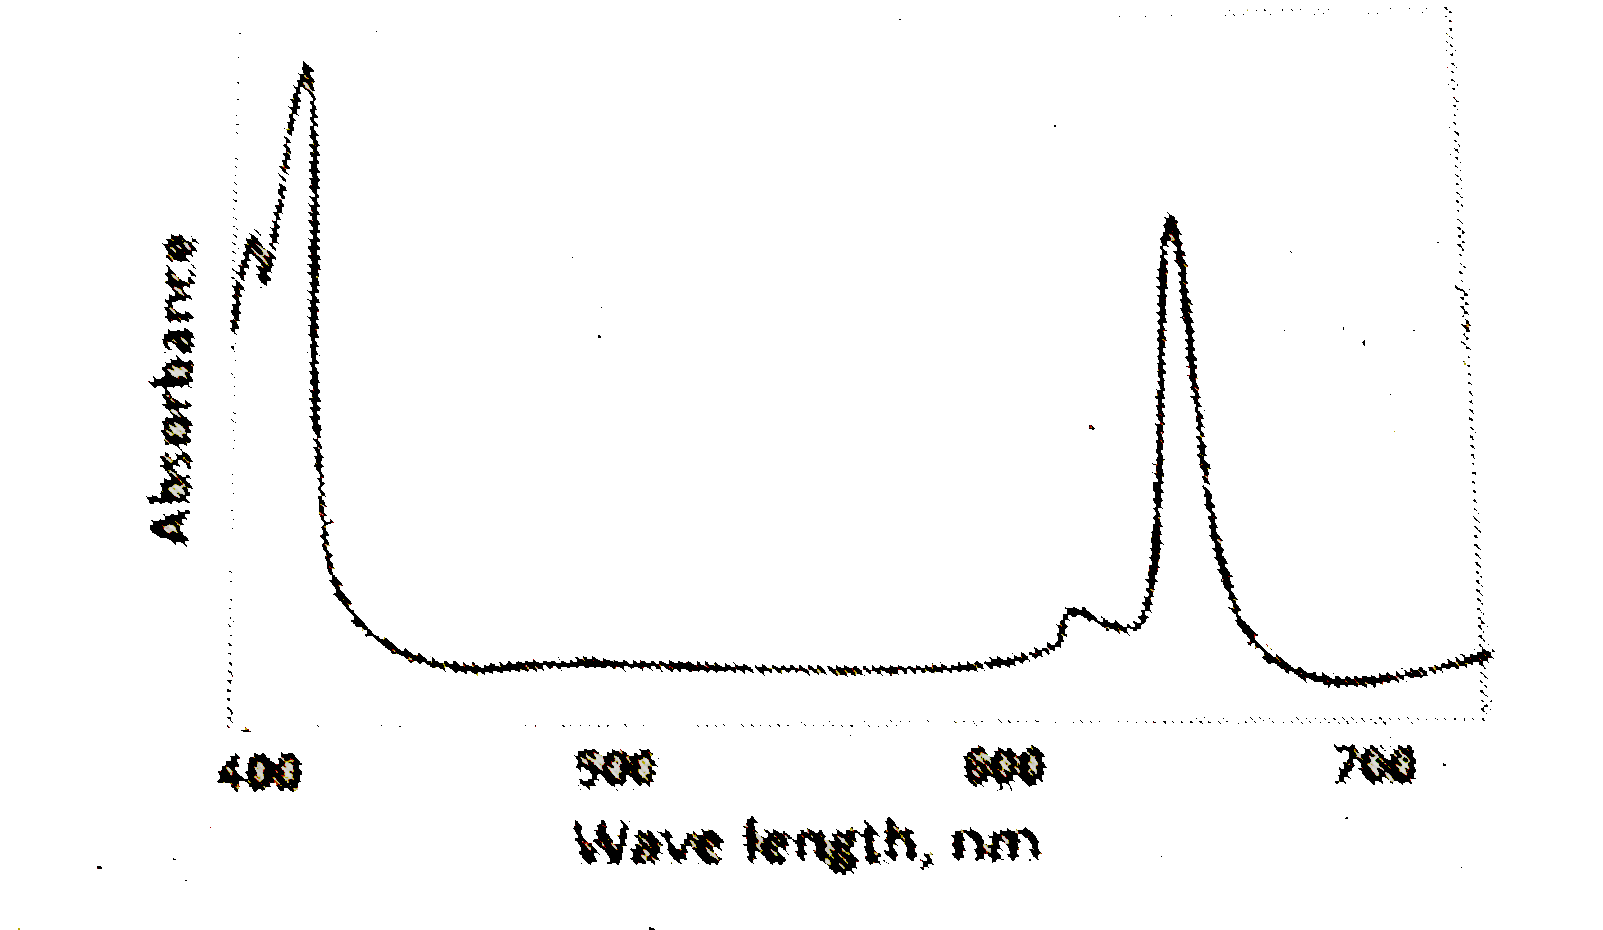
The graph below represents the absorption spectrum of major pigment contributing to photosynthesis ?
 A
A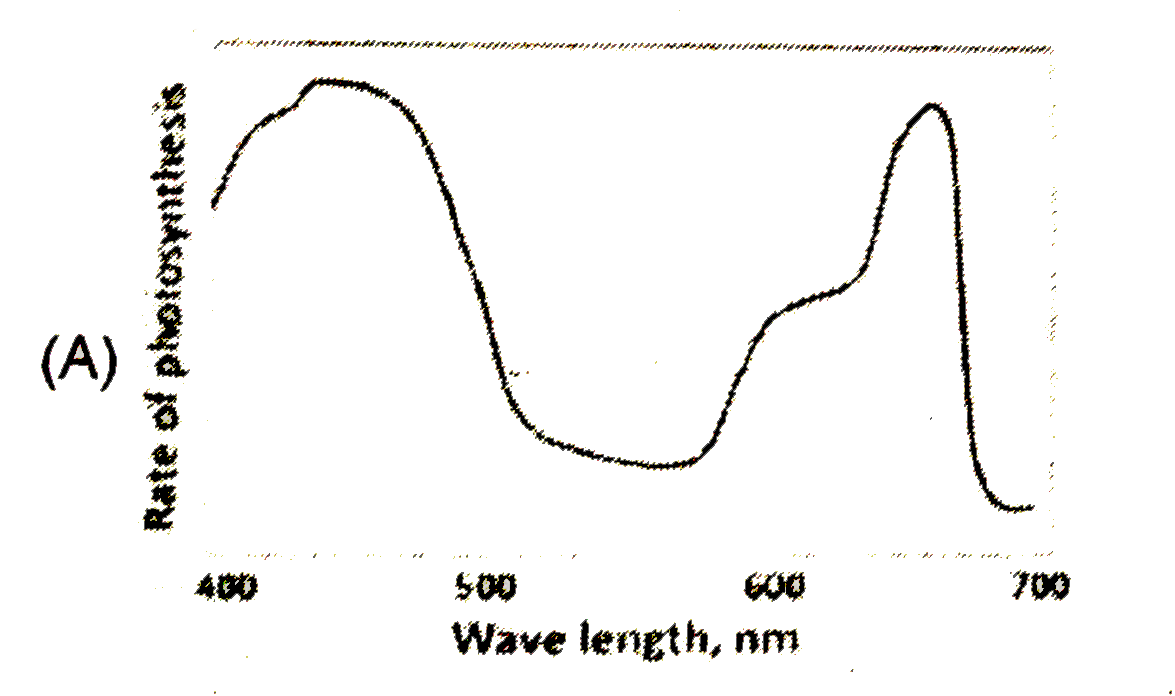 B
B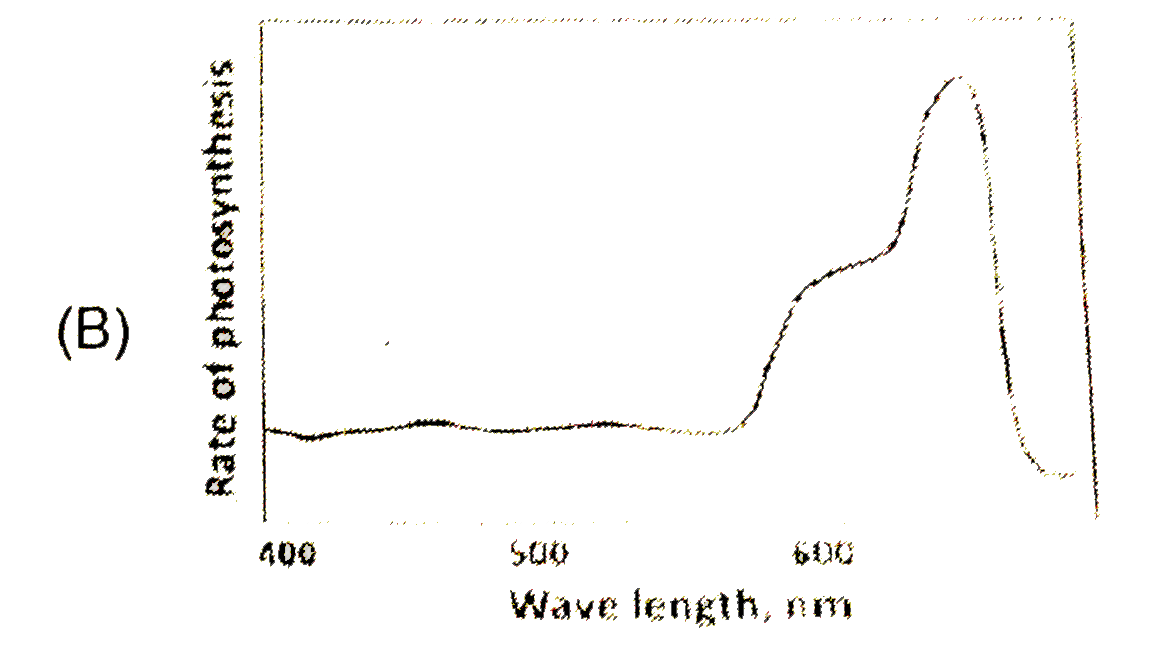 C
C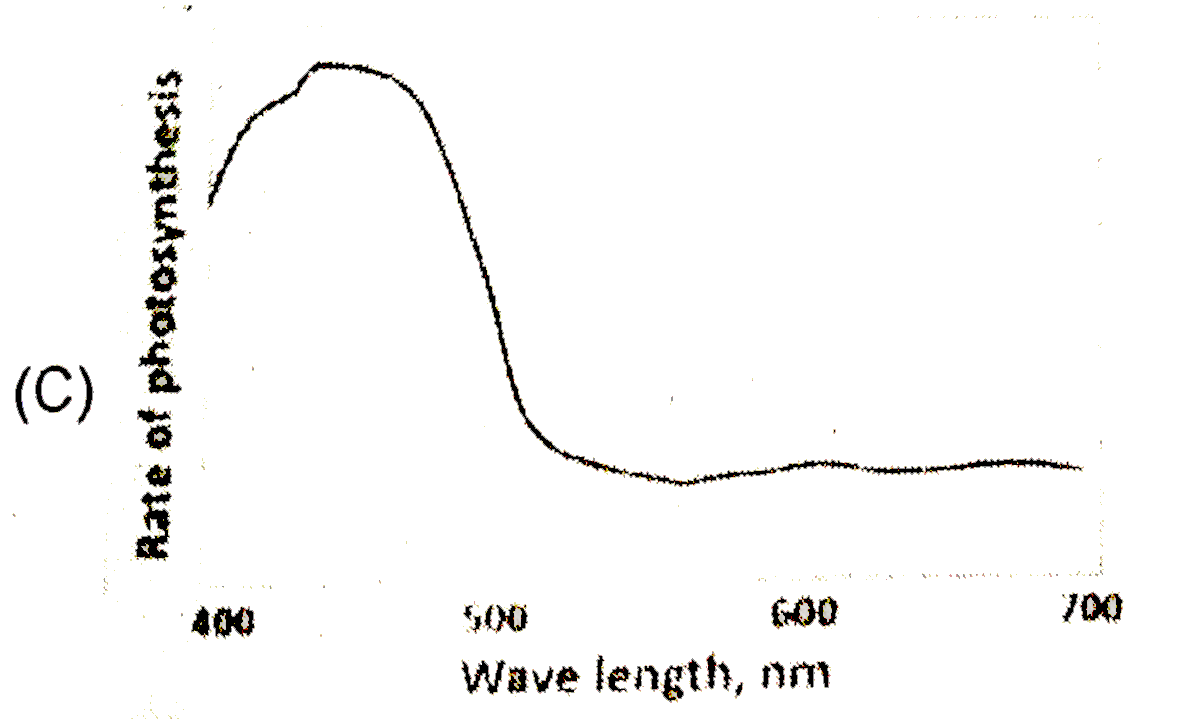 D
D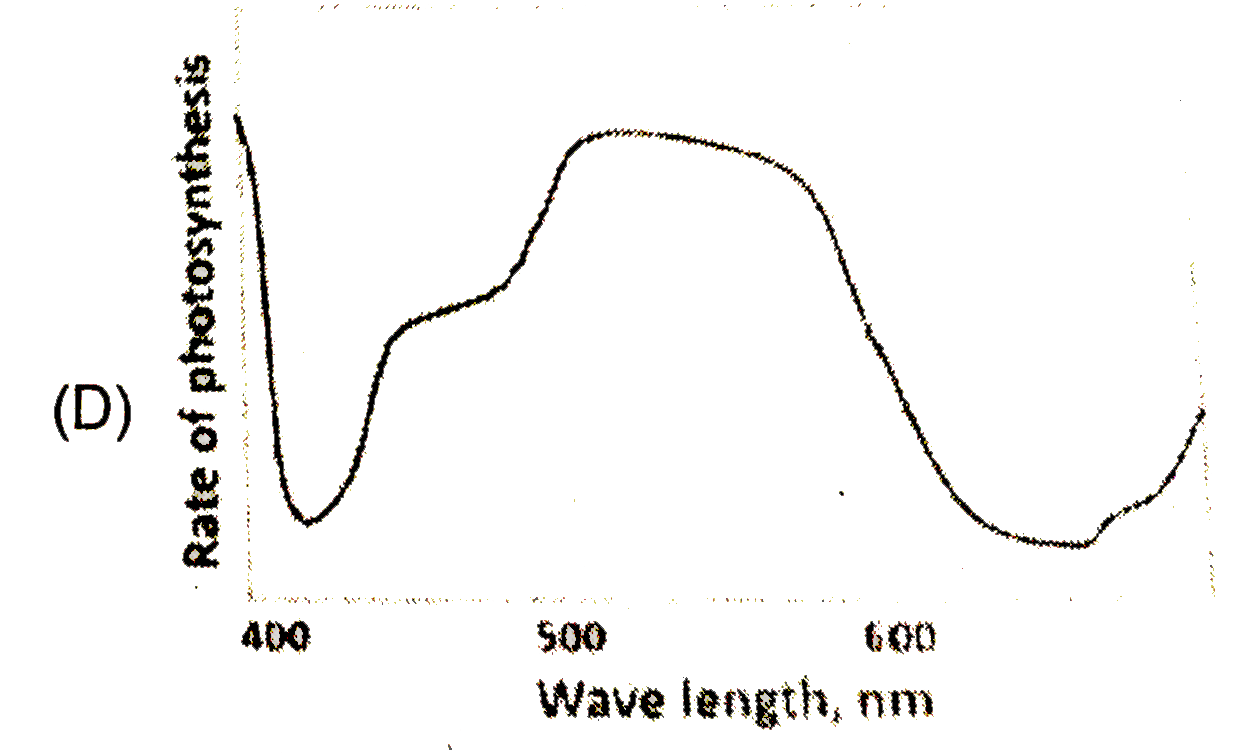
Assertion: Chlorophyll a is the chief pigment associated with photosynthesis.
Reason: In the blue and red regions of spectrum, there is maximum absorption by chlorophyll- a, also shows higher rate of photosynthesisAIf both assertion and reason are true and the reason 1s the correct explanation of the assertion.BIf both assertion and reason are true but reason is not the correct explanation of the assertion.CIf assertion is true but reason is false.DIf both assertion and reason are false.The slope of the graph showing the variation of potential difference V on X-axis and current Y-axis gives conductor
AresistanceBresistivityCreciprocal of resistanceDconductivity
What can we conclude from the statement that the action and absorption spectrum of photosynthesis overlap? At which wavelength do they show peaks?
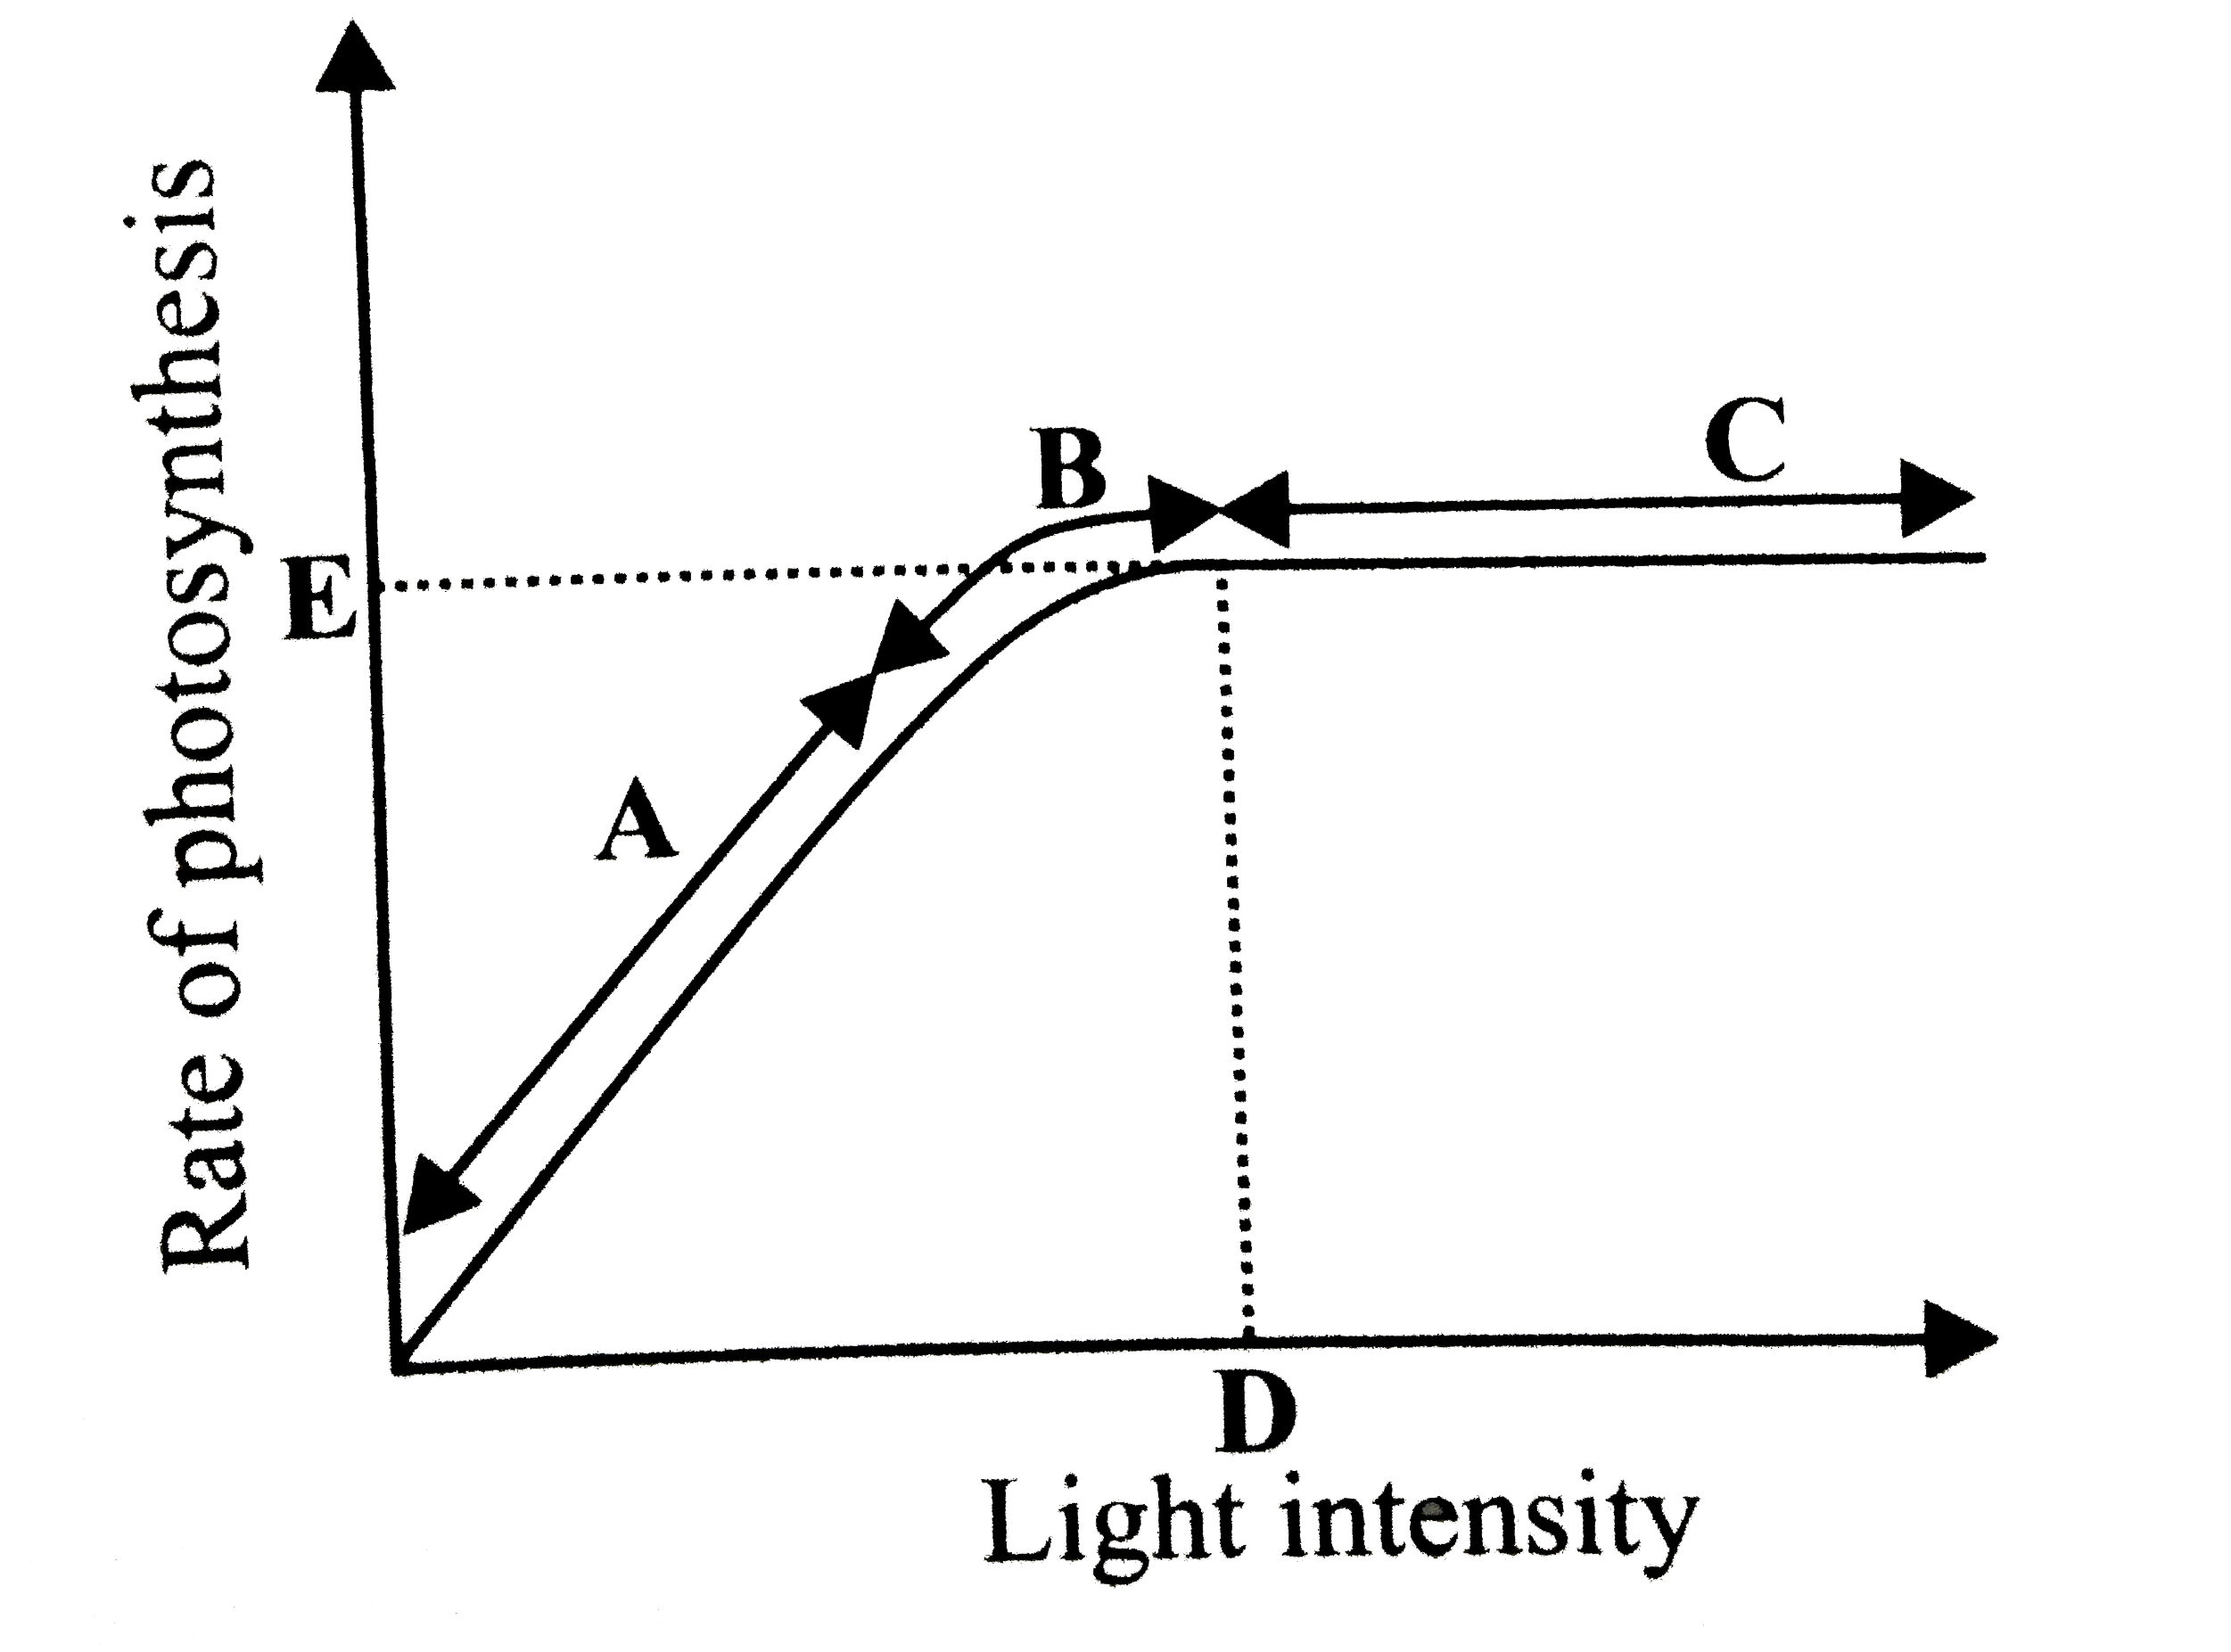
View SolutionFigure given below shows the effect of light on the role of photosynthesis. Based on graph
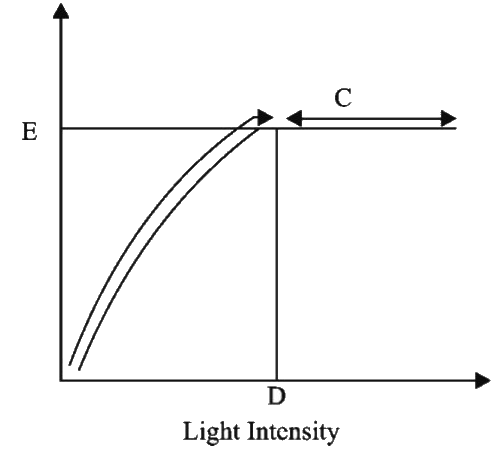
What could be the limiting factor/factors in region A?
View SolutionWhat can we conclude from the statement that the action and absorption spectrum of phtosynthetic overlaps? At which wavelength do they show peaks. ?
View SolutionThe figure shows the effect of light on the rate of photosynthesis. Based on the graph, answer the following questions :
What do region C and D represent on the curve ?
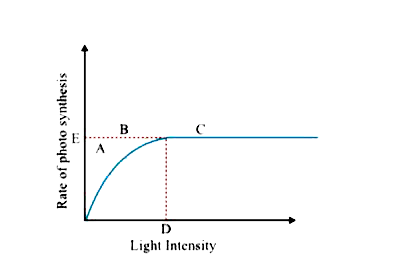
View SolutionStudy the given graph showing the efect of light intensity on the rate of photosynthesis. Which of the following statemetns regarding this is correct?
View Solution
