Which graph represents the effect of pHk/temp on the velocity of a typical enzymatic reaction (V)

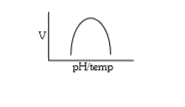


The correct Answer is:B
Some enzyme acts best in an acid medium other in an alkaline medium. For every enzyme, there is an optimum pH where its action is maximum. Most enzyme show max activity in a pH range of about 6.0 to 7.5. Shifts to the alkaline or acid side rapidly decrease the enzyme activity and finally stops it altogether.
Similar Questions
Knowledge Check
Which one of the graphs show the effect of temperature on the velocity of a typical enzymatic reaction?
A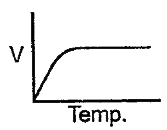 B
B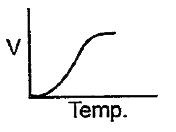 C
C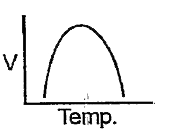 D
D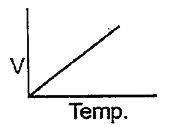
Which graph represents an objects at rest ?
A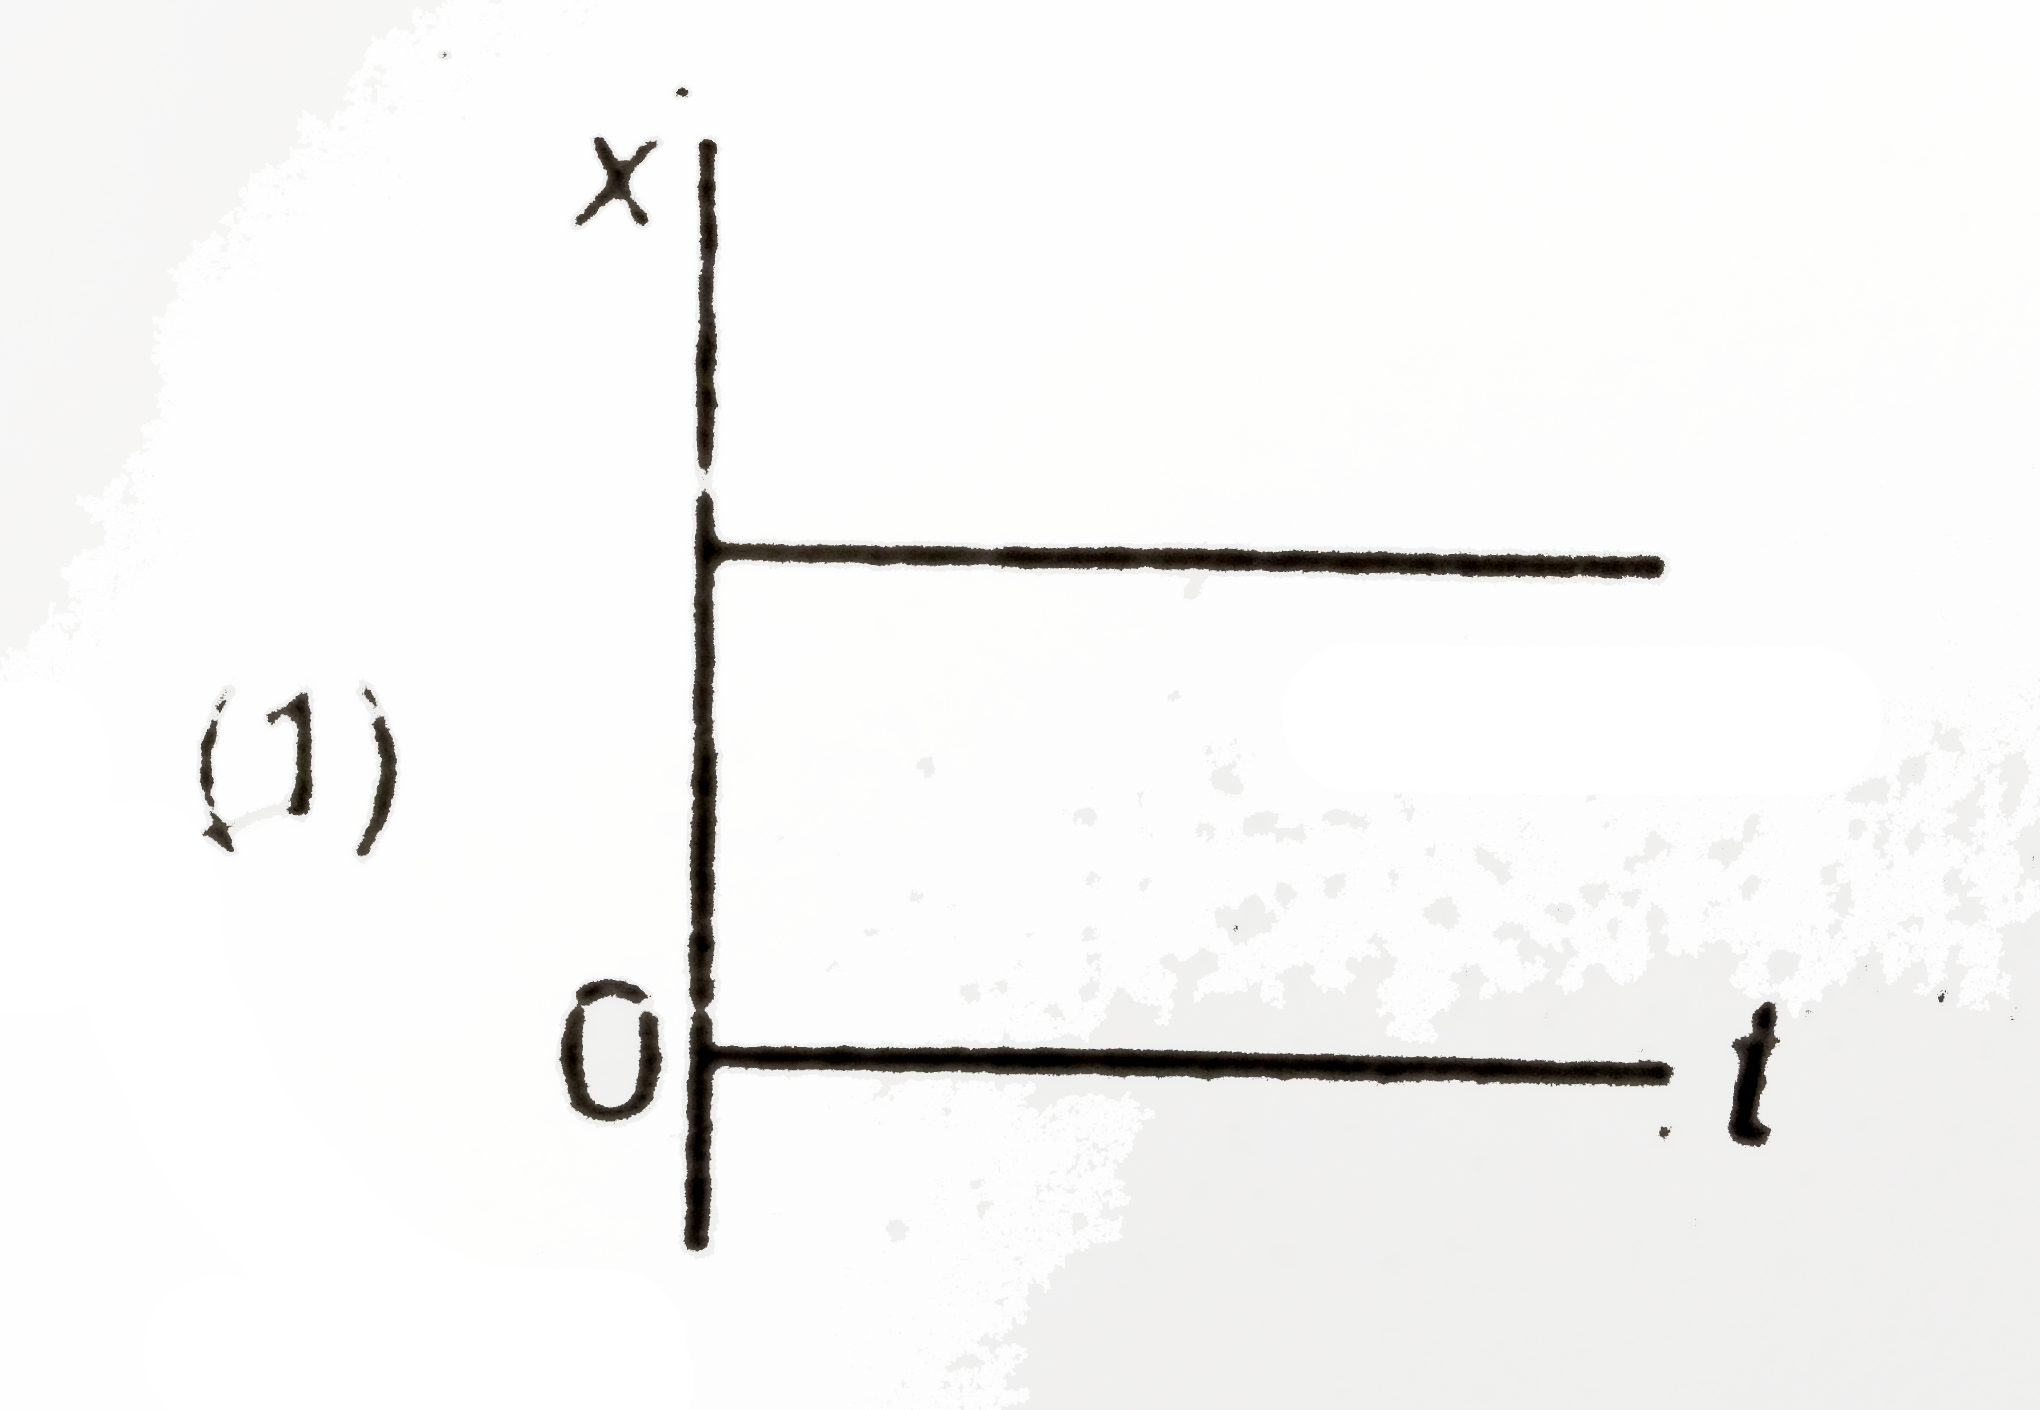 B
B C
C D
D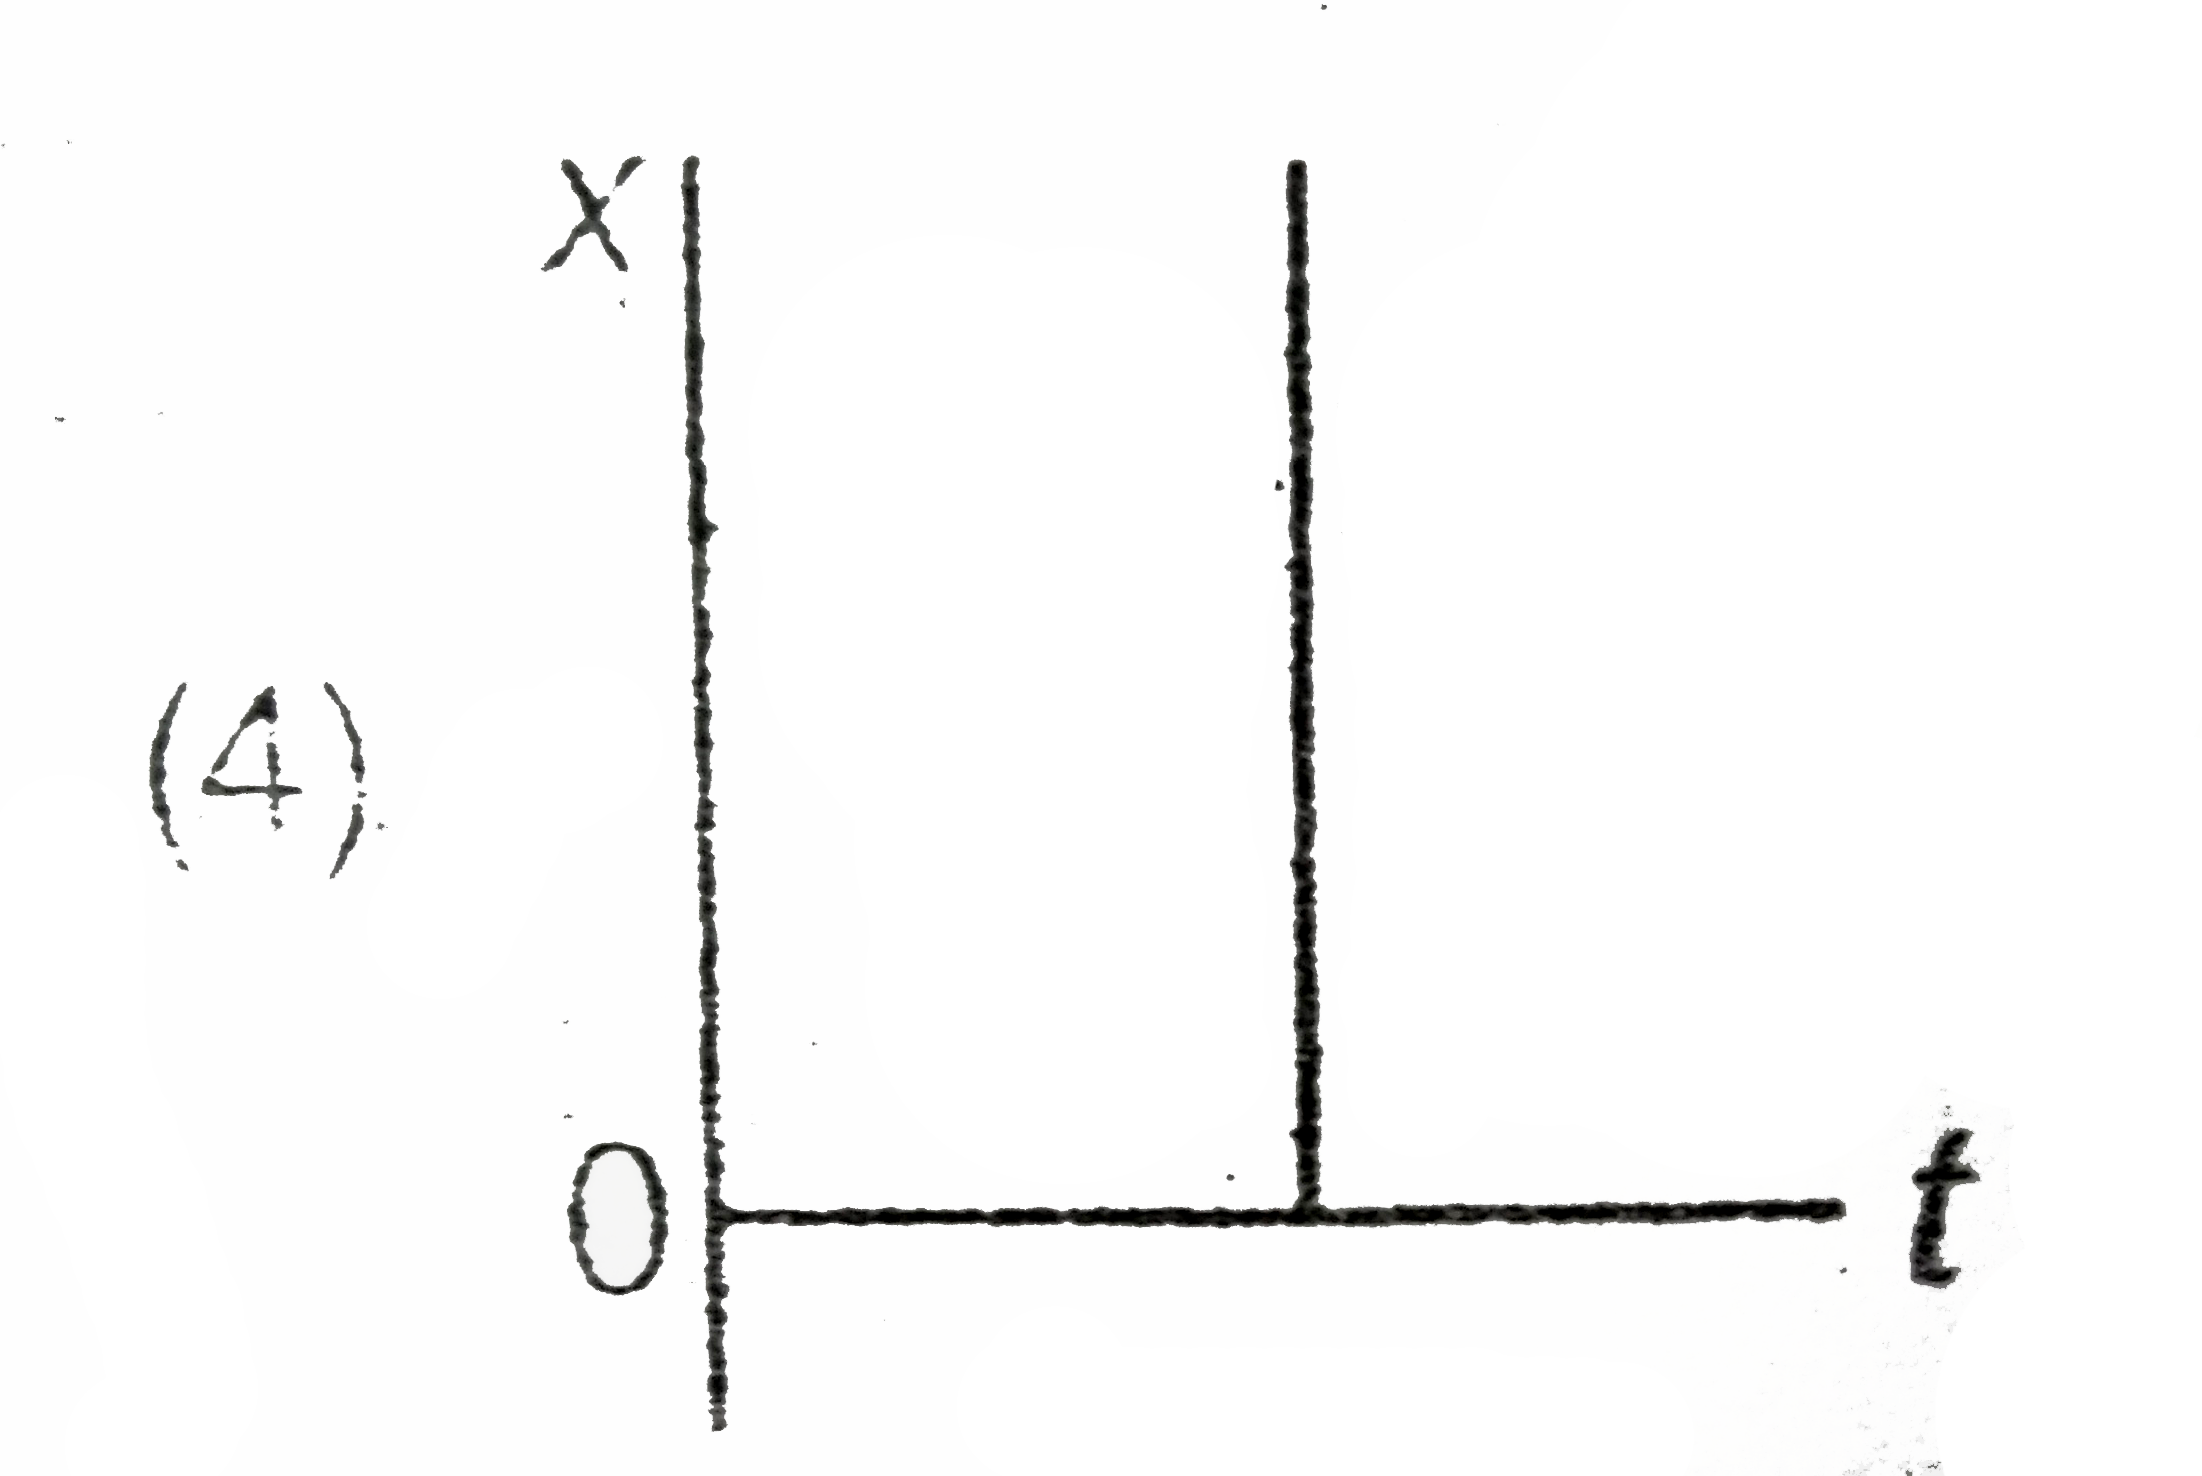
Which graph represents the correct relationship between various velocities for an idela gas ?
A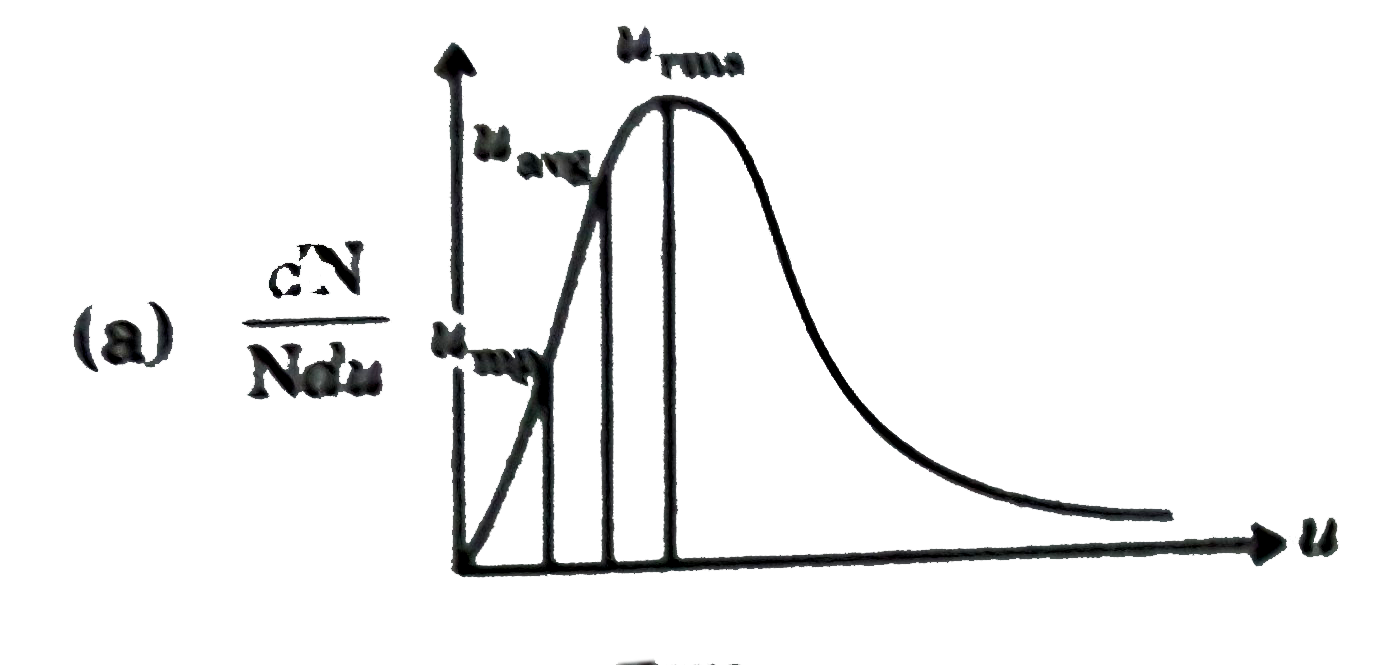 B
B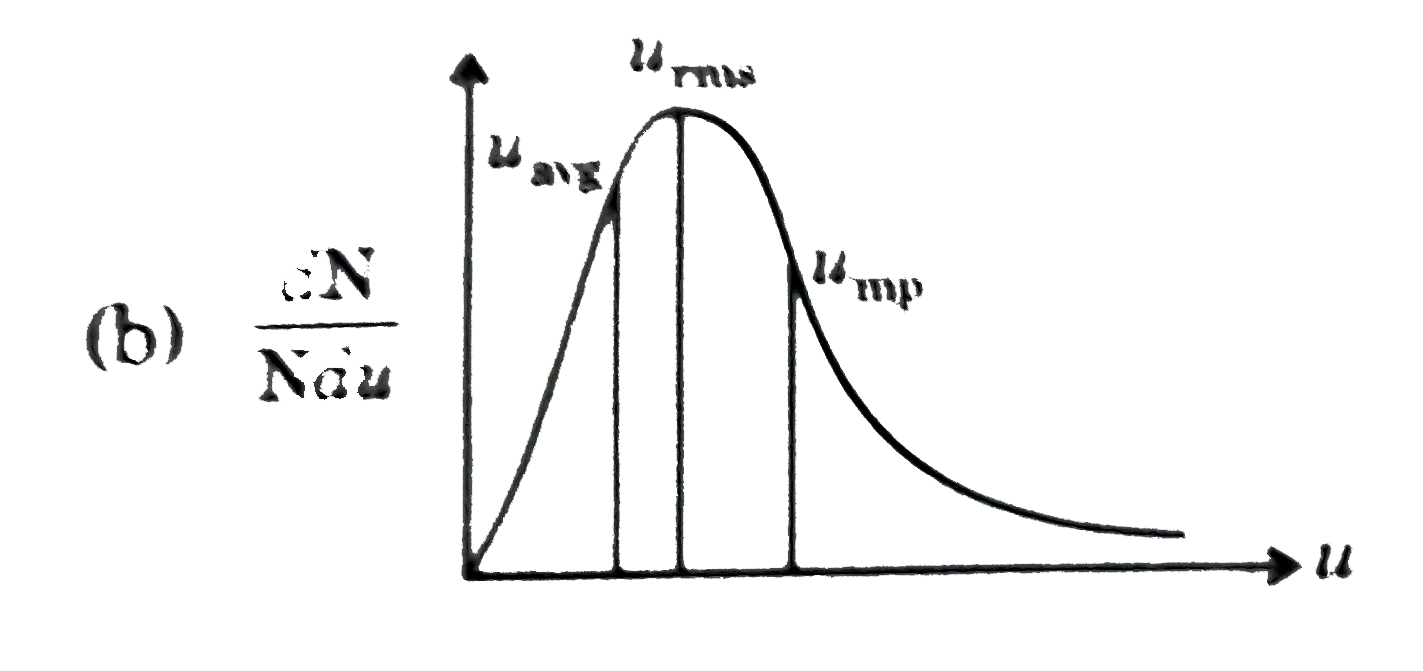 C
C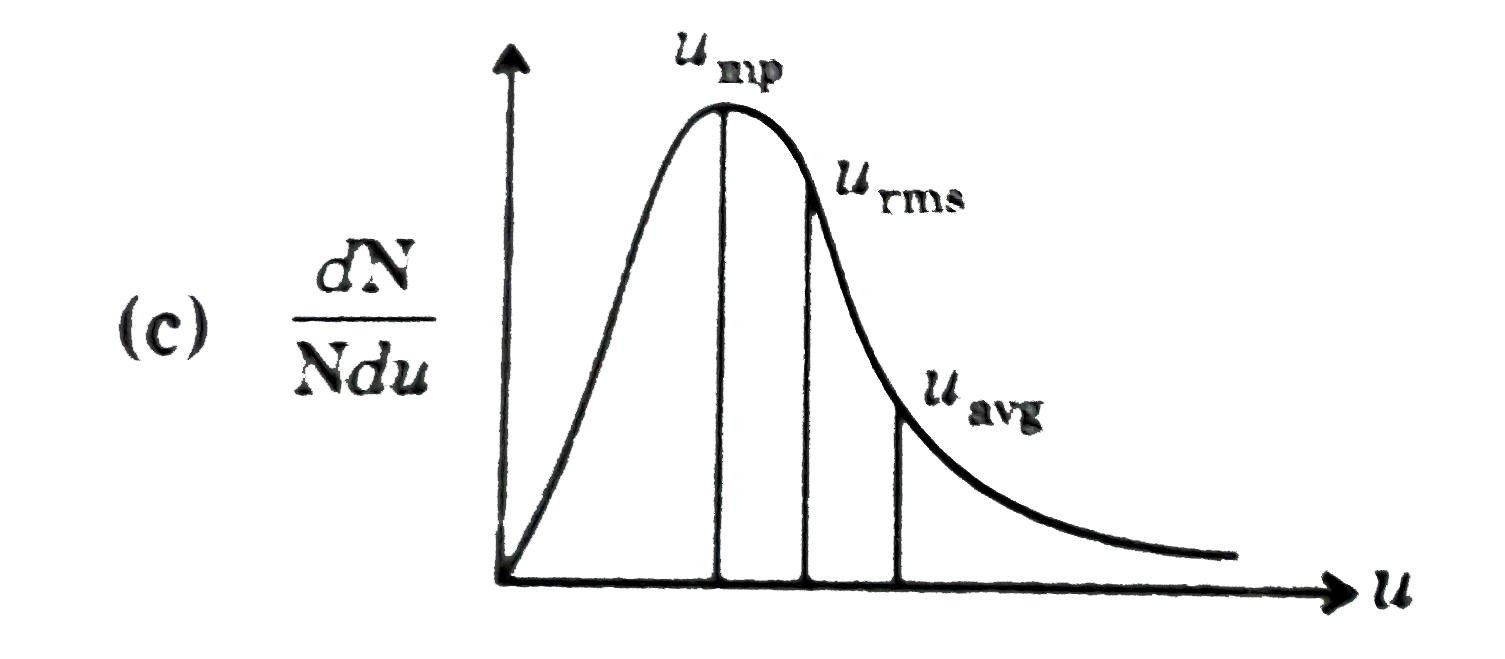 D
D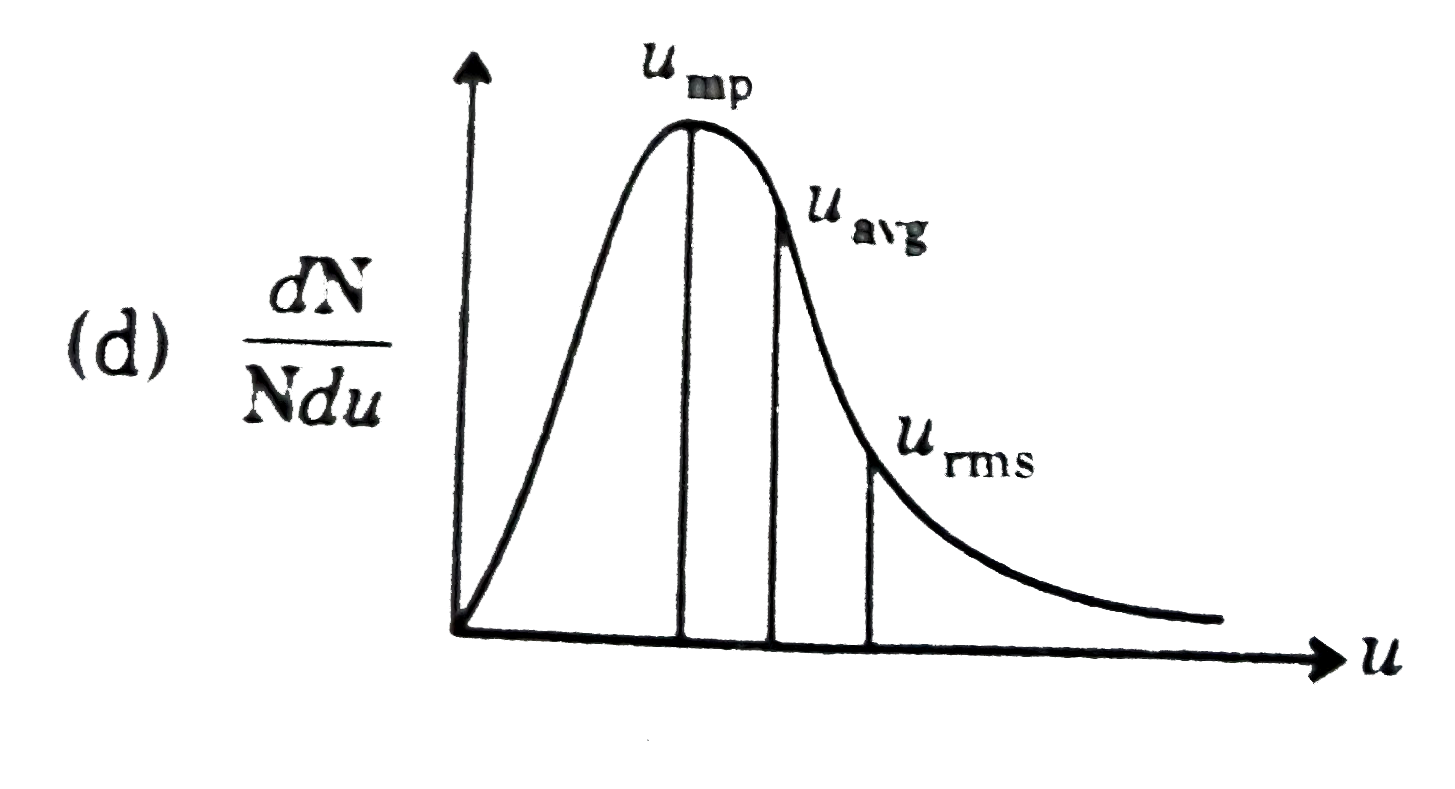
Which one of the given graph shows the effect of pH on the velocity of a typical enzymatic reaction (V)?
View SolutionWhich one of the given graphs shows the effect of temperature on the velocity of a typical enzymatic reaction ?
View SolutionThe given graph illustrates the effect of two hormones " X and Y on blood sugar level of a person. Xrepresents the effect of __i__and Y represents the effect of ___ii__.
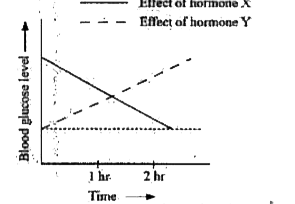
The information in which alternative correctly completes the given statement?
View SolutionFigure shows the position the graph for a particle in one dimensional motion. Which of the graphs in fugure represent the variation in the velocity of the particle with time ?
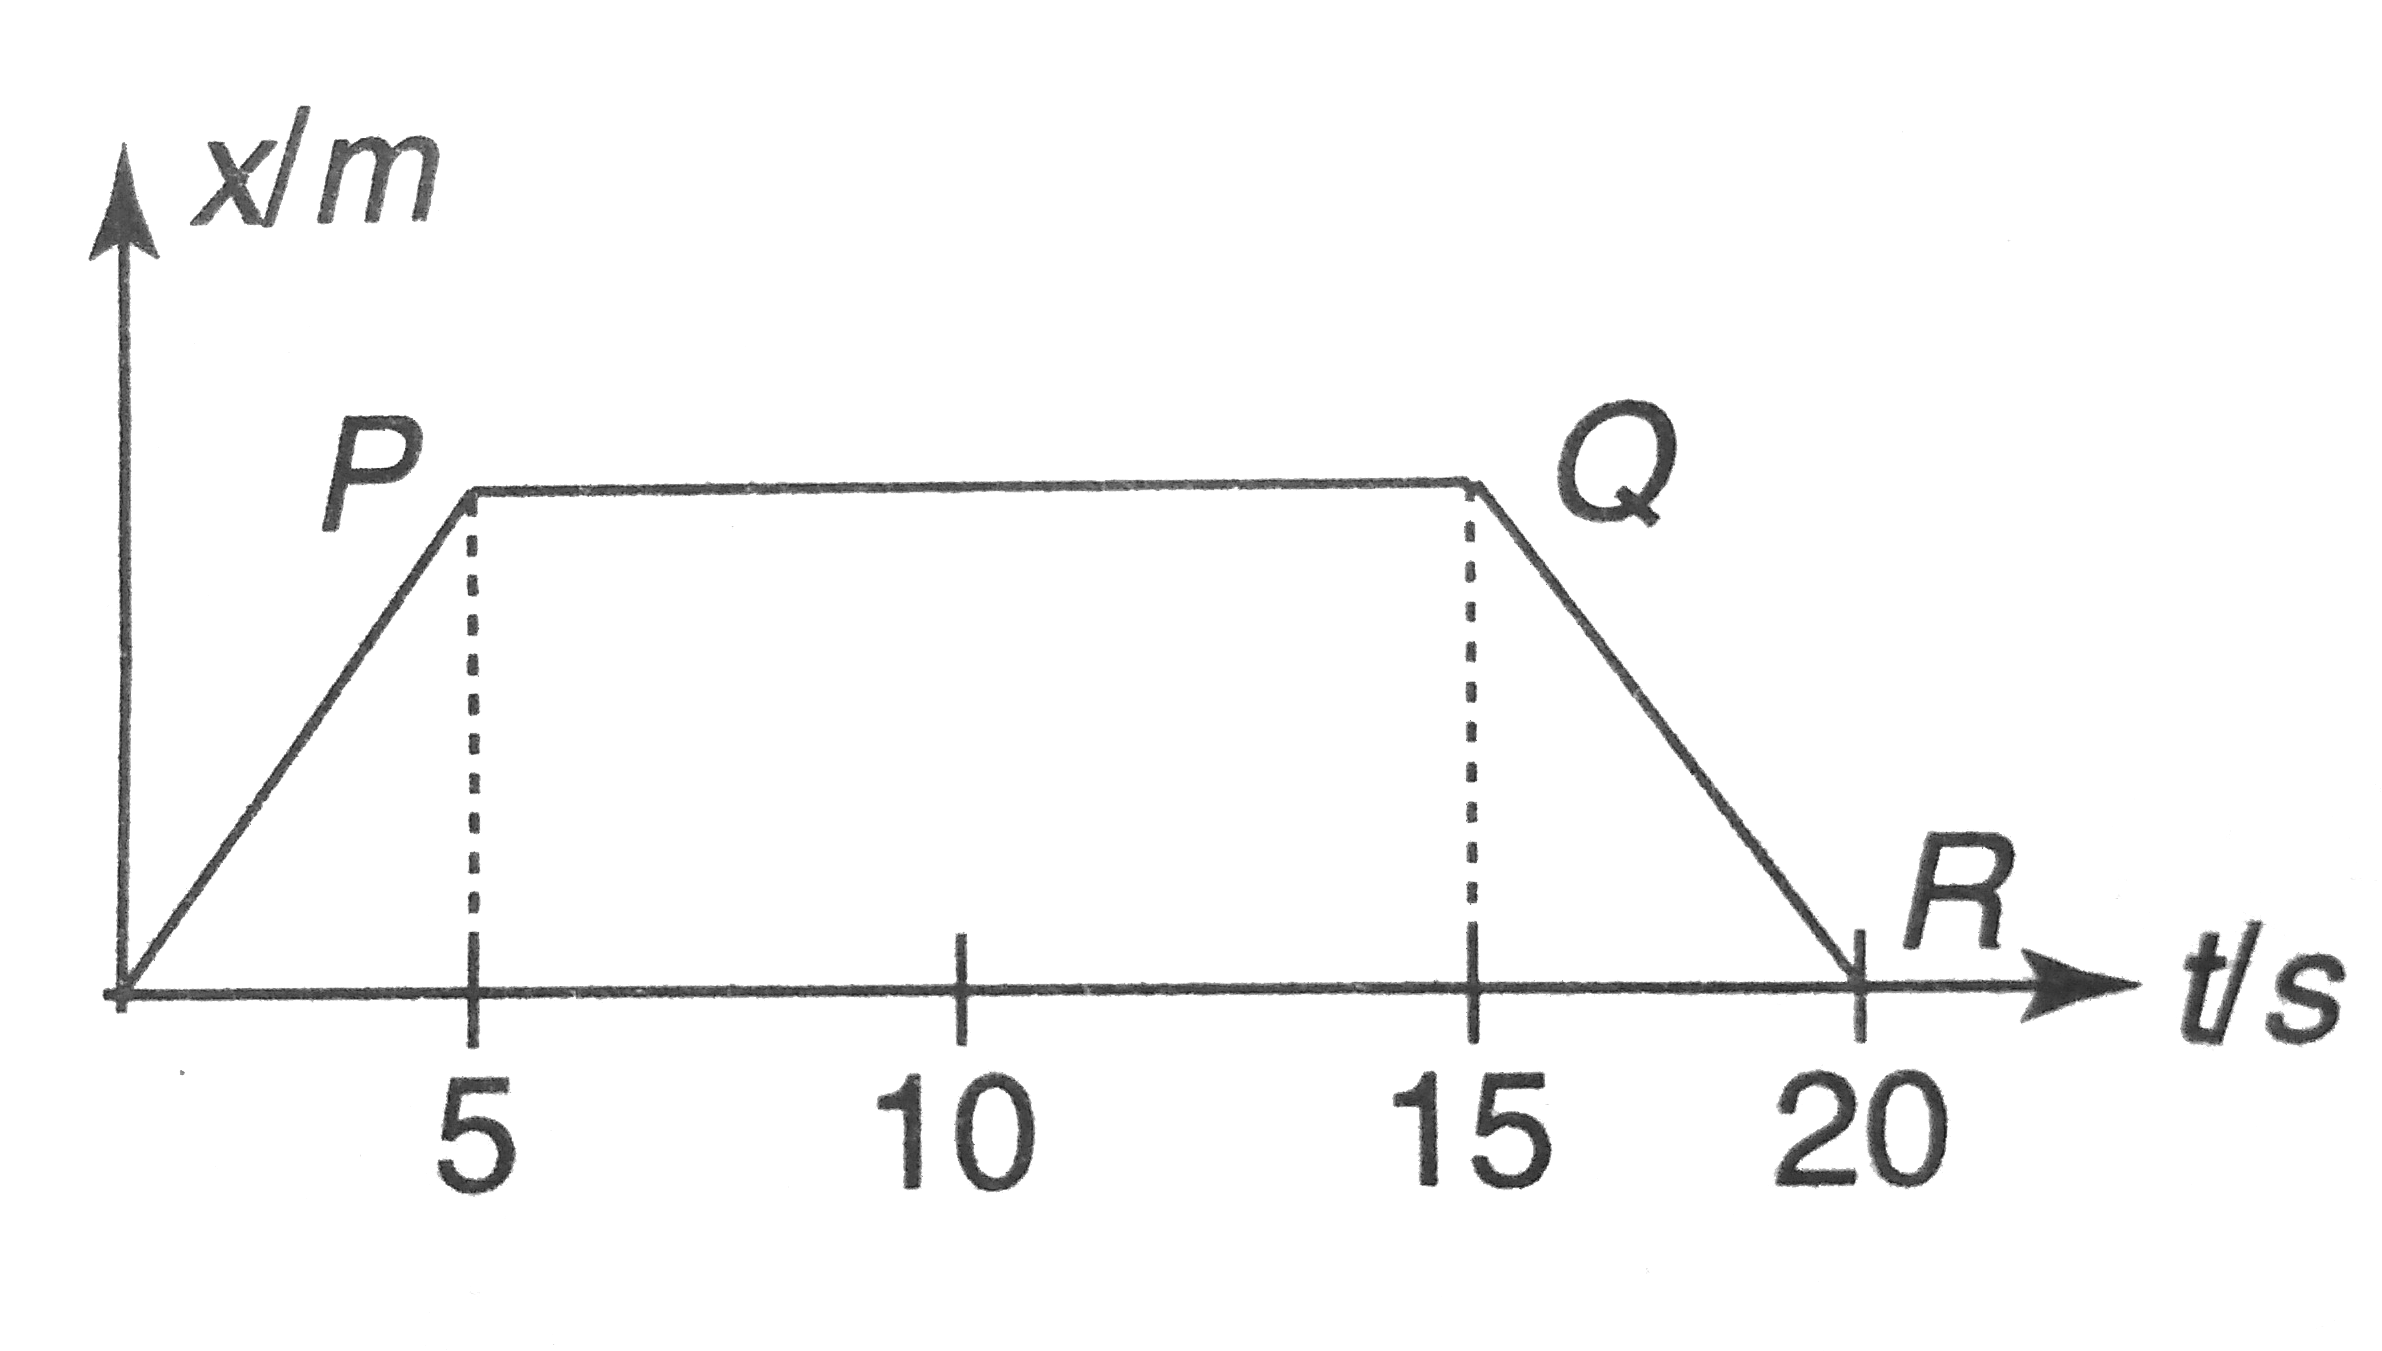
View SolutionThe graph that represents the relation between orbital velocity (v0) of a satellite and radius (r) of the orbit around earth is
View Solution
