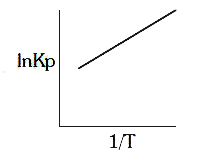
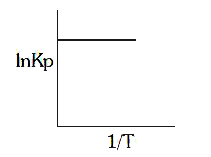
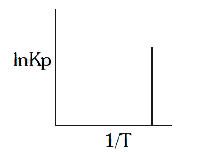
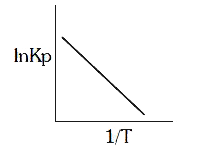
Which of the following plots represent an exothermic reaction
A
B
C
D
Video Solution
Text Solution
The correct Answer is:A
ln Kp=−ΔHRT+ constant
For exothermic reaction, ΔH is –ve. So when ln Kp is plotted against 1/T, it.s a straight line with positive slope and positive intercept.
|
Topper's Solved these Questions
- CHEMICAL EQUILIBRIUMBOOK - ERRORLESSCHAPTER - CHEMICAL EQUILIBRIUMEXERCISE - NCERT BASED QUESTION (Le-Chatelier Principle and it.s Application)
45 Videos
- CHEMICAL EQUILIBRIUMBOOK - ERRORLESSCHAPTER - CHEMICAL EQUILIBRIUMEXERCISE - PAST YEARS QUESTIONS
37 Videos
- CHEMICAL EQUILIBRIUMBOOK - ERRORLESSCHAPTER - CHEMICAL EQUILIBRIUMEXERCISE - NCERT BASED QUESTION (Law of Equilibrium and Equilibrium Constant)
65 Videos
- CHEMICAL BONDING AND MOLECULAR STRUCTUREBOOK - ERRORLESSCHAPTER - CHEMICAL BONDING AND MOLECULAR STRUCTUREEXERCISE - Assertion & Reason
17 Videos
- CLASSFICATION OF ELEMENTS AND PERIODICITY IN PROPERTIES BOOK - ERRORLESSCHAPTER - CLASSFICATION OF ELEMENTS AND PERIODICITY IN PROPERTIES EXERCISE - Assertion & Reason
14 Videos
Similar Questions
Knowledge Check
Which of the following plots represents an exothermic reaction?
A B
B C
C D
D
Which of the following plots represents an exothermic reaction?
A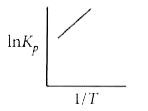 B
B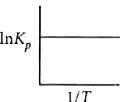 C
C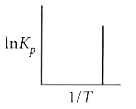 D
D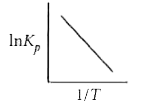
In an exothermic reaction
Athe energy of the reactants is more than that of the products.Bthe energy of the reactants is less than that of the products.Cthe energy of the reactants may be more or less than that of the products, depending on the temperature.Denergy of the reactants and products are the same.
Which of the following graph represents an exothermix reaction?
View SolutionWhich plot represent an exothermic reaction ?
View SolutionWhich of the following represents an exothermic reaction :-
View SolutionWhich of the following graphs represents exothermic reaction?

View SolutionWhich of the following graph represents exothermic reaction ?
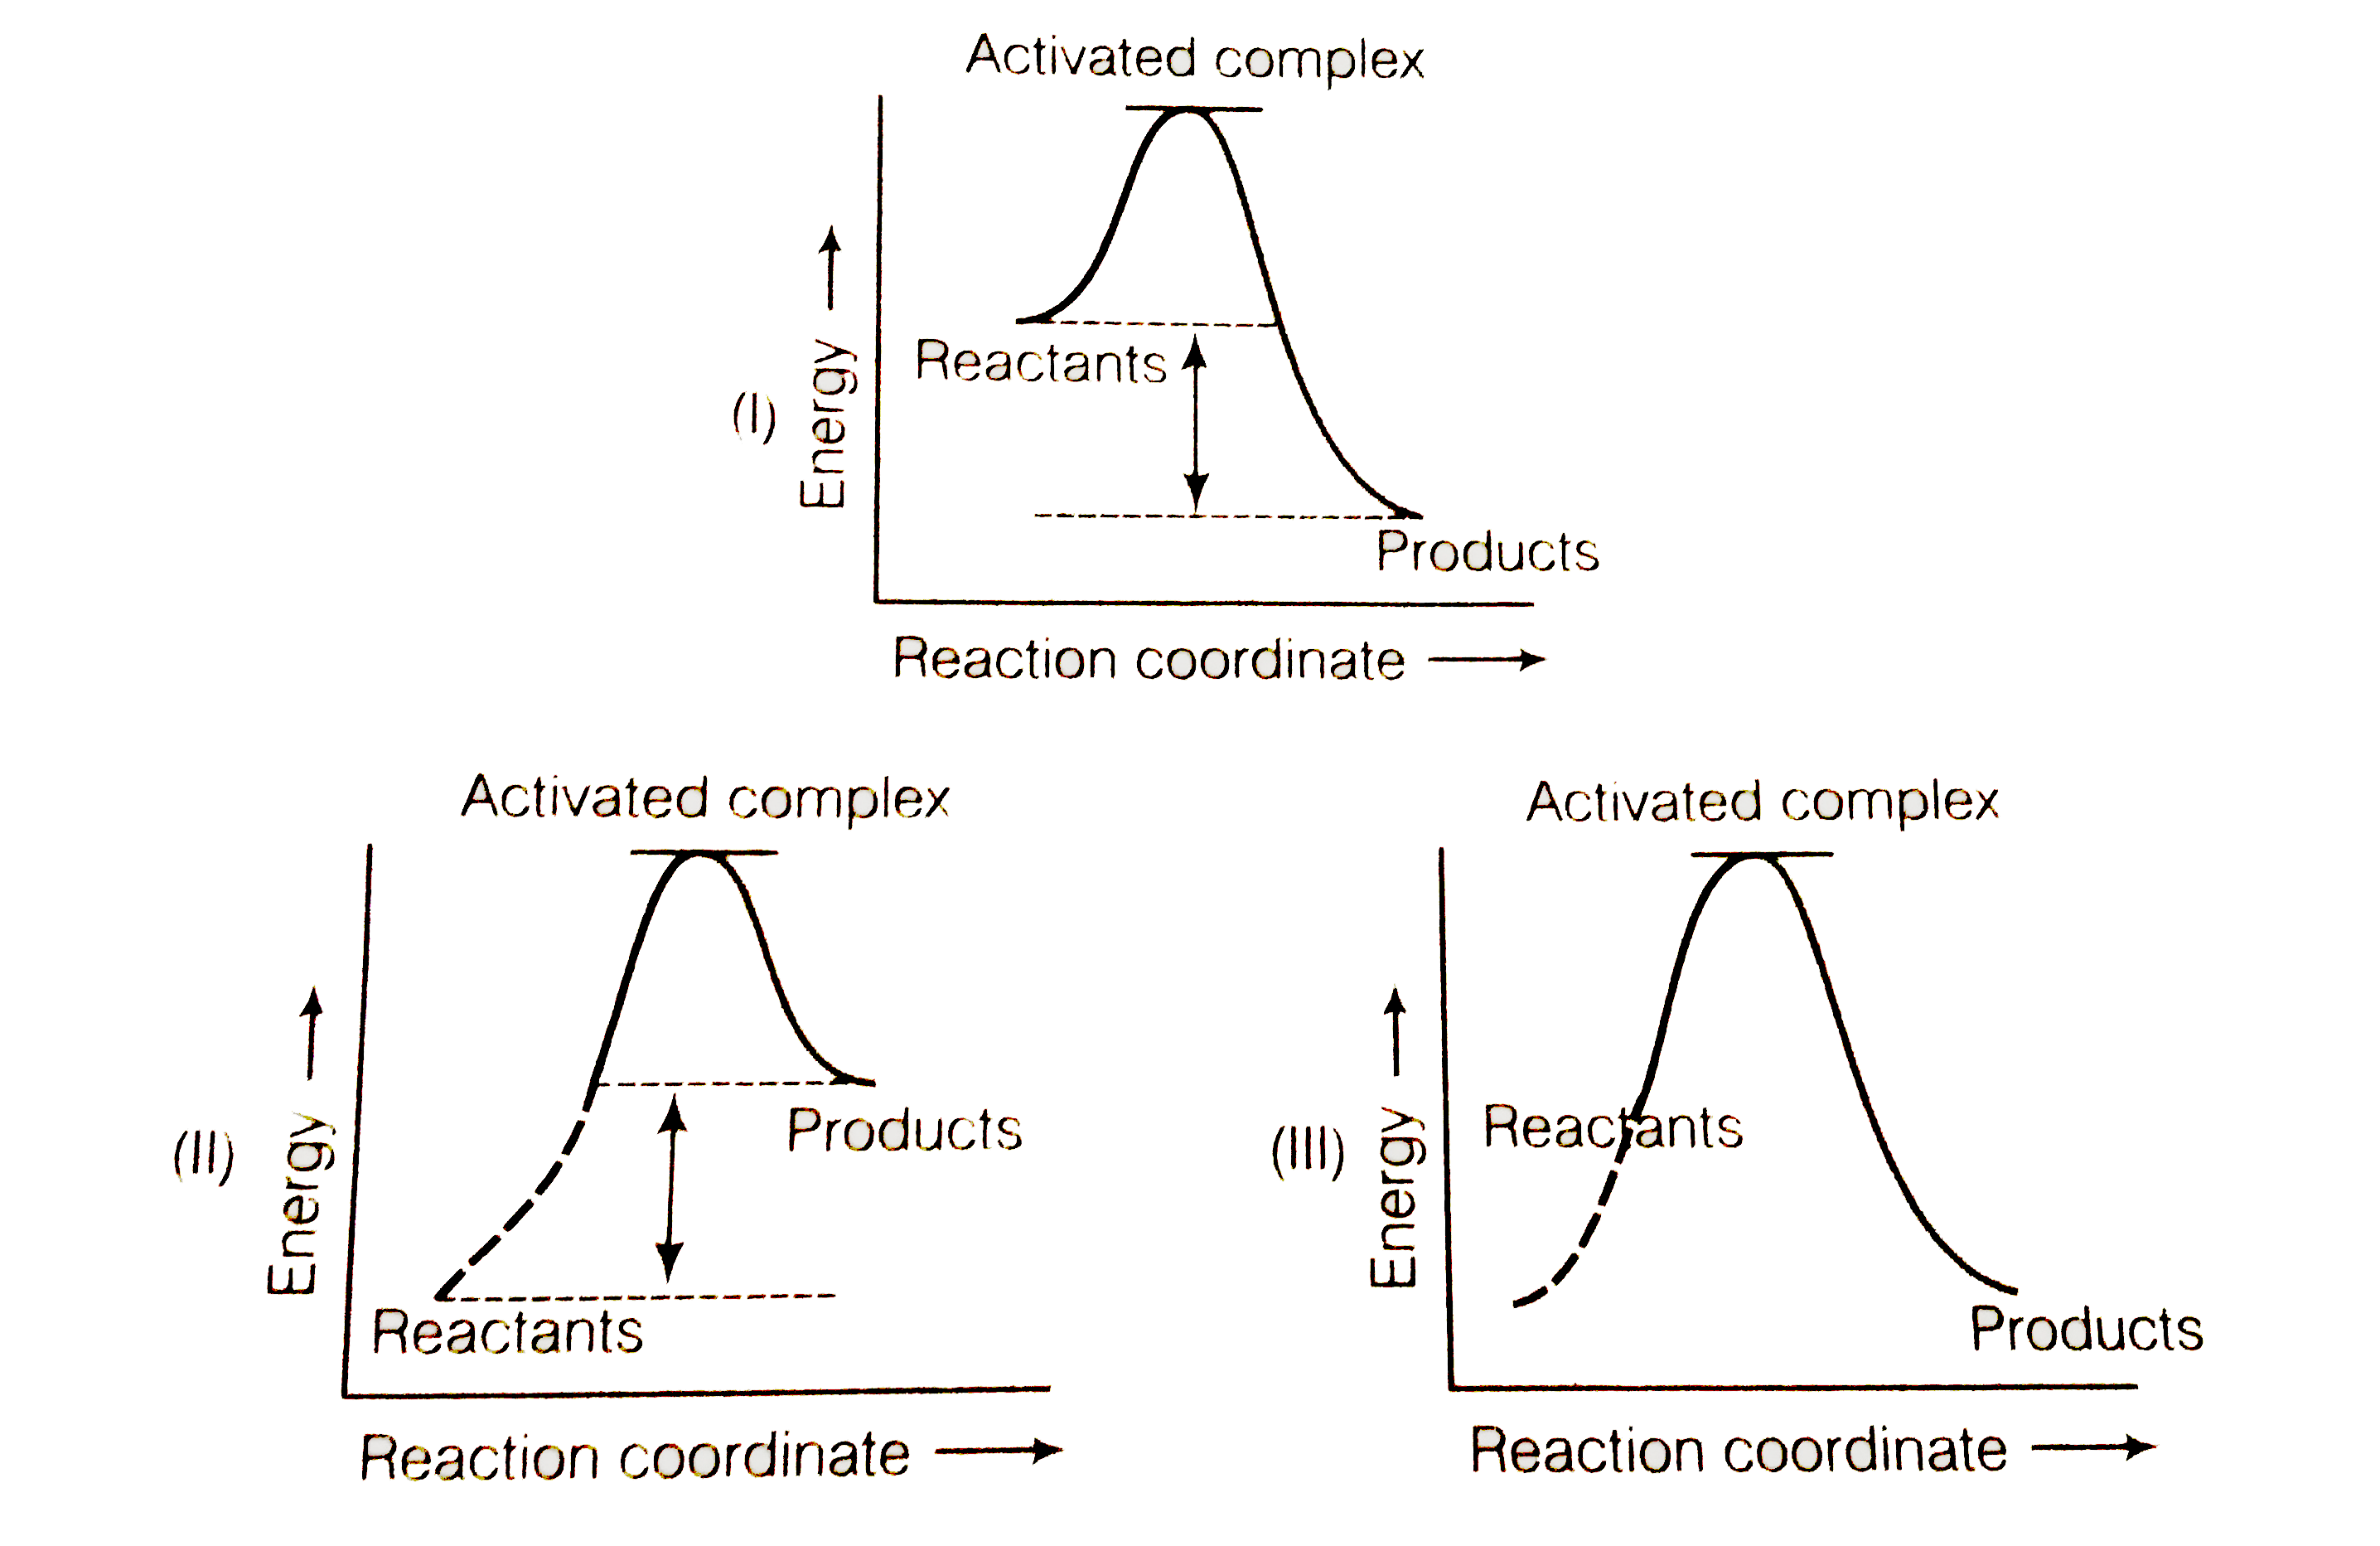
View Solution
