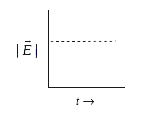
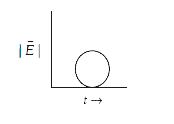
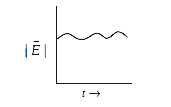
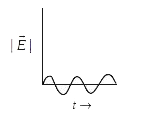
Which of the following diagrams represent the veriation of electric field vector with time for a circularly polarised light
A
B
C
D
Video Solution
Text Solution
The correct Answer is:A
→E=E0√2=constant
|
Topper's Solved these Questions
- WAVE OPTICS AND ELECTROMAGNETIC THEORYBOOK - ERRORLESSCHAPTER - WAVE OPTICS AND ELECTROMAGNETIC THEORYEXERCISE - ASSERTION & REASON
27 Videos
- WAVE OPTICS AND ELECTROMAGNETIC THEORYBOOK - ERRORLESSCHAPTER - WAVE OPTICS AND ELECTROMAGNETIC THEORYEXERCISE - NCERT BASED QUESTIONS (EM Waves )
40 Videos
- RAY OPTICSBOOK - ERRORLESSCHAPTER - RAY OPTICSEXERCISE - Assertion & Reason
30 Videos
Similar Questions
Knowledge Check
Which of the following diagrams represent the variation of electric field vector with time for a circularly polarised light ?
A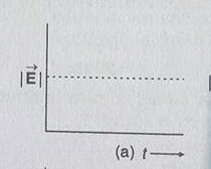 B
B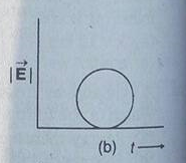 C
C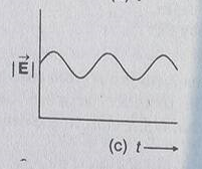 D
D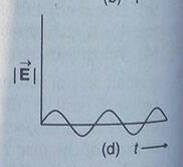
Which of the following diagrams represent the variation of electric field vector with time for a circularly polarised light ?
A B
B C
C D
D
Which of the following diagram represents the variation of electric field vector with time for a circularly polarised light?
A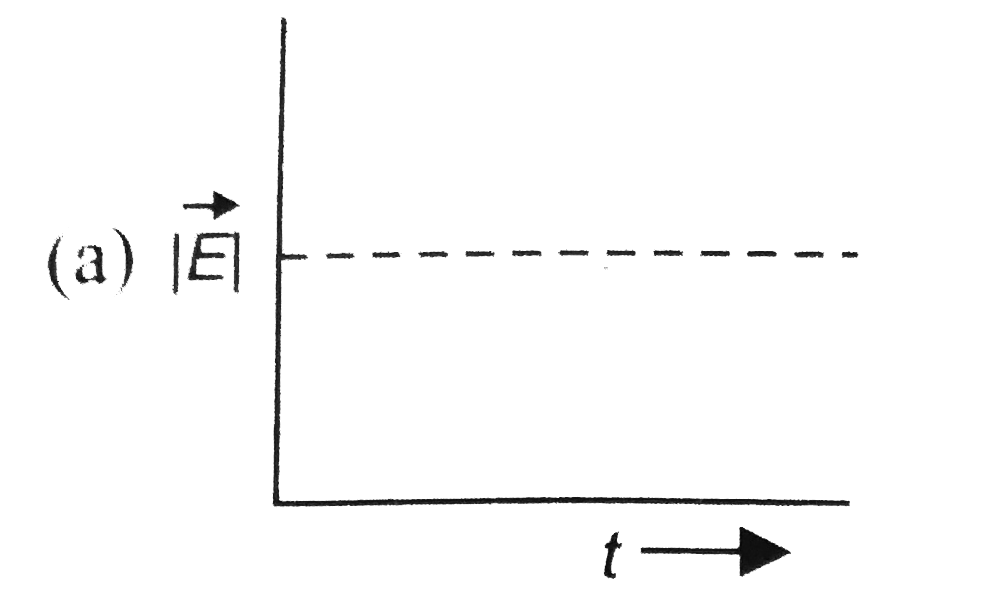 B
B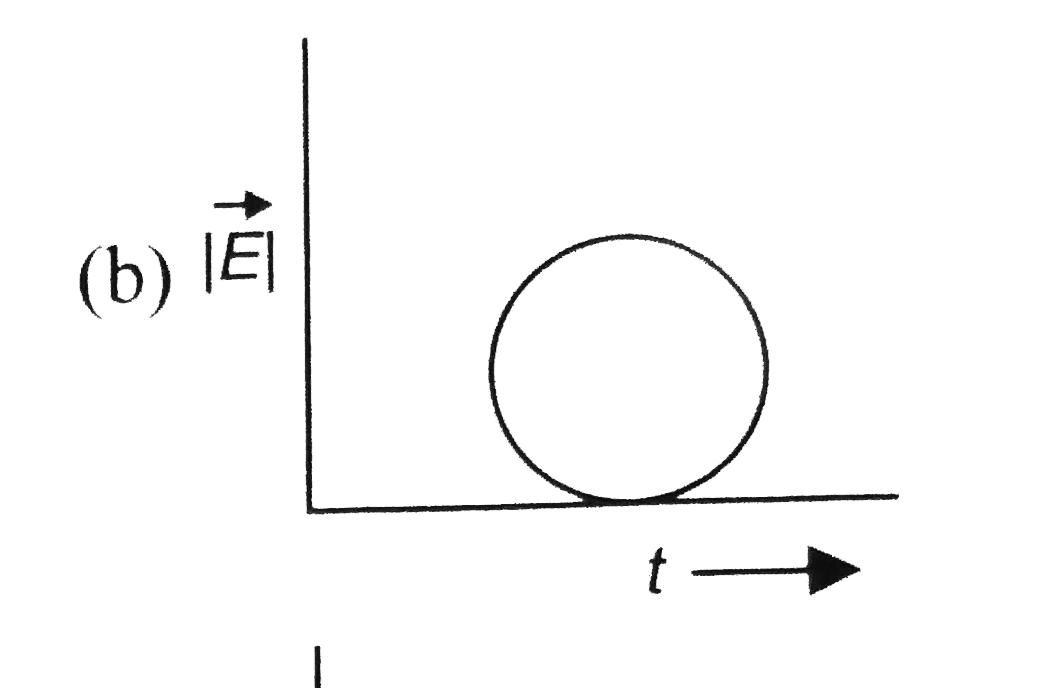 C
C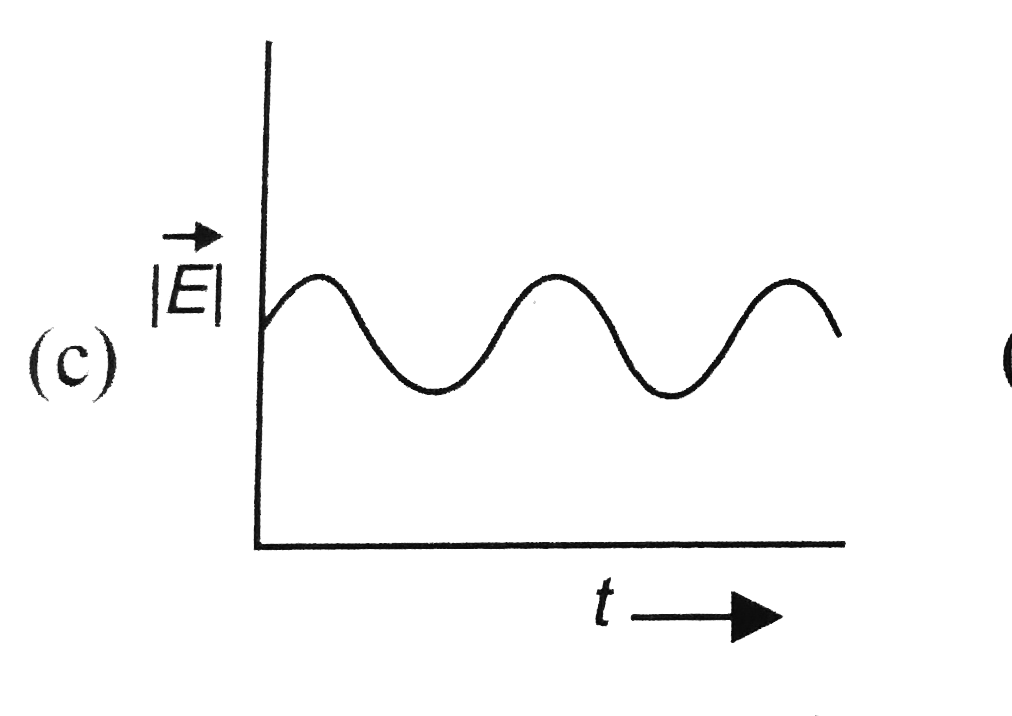 D
D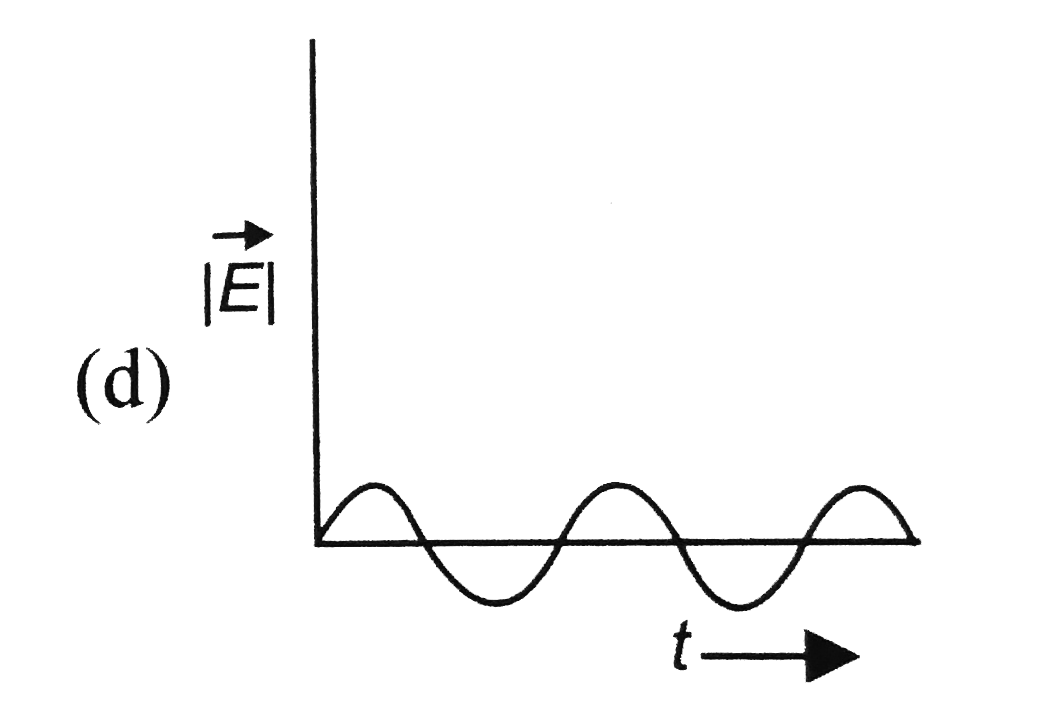
Which of the following represents a unit vector ?
View SolutionWhich of the following represents a vector ?
View SolutionWhich of the following represents electric polarisation ?
View SolutionWhich of the following diagram represent the situation of 'Expansion in Demand' ?
View SolutionWhich one of the following diagrams represents the placentation in Dianthus
View Solution
