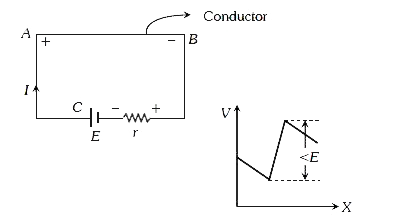
The two ends of a uniform conductor are joined to a cell of e.m.f. E and some internal resistance. Starting from the midpoint P of the conductor, we move in the direction of current and return to P. The potential V at every point on the path is plotted against the distance covered (x). which of the following graphs best represent the resulting curve ?


The correct Answer is:B

Loop ABCA
−IR−Ir+E=0
⇒−IR+E−lr=0
Topper's Solved these Questions
- CURRENT ELECTRICITYBook:ERRORLESSChapter:CURRENT ELECTRICITYExercise:NCERT BASED QUESTIONS (DIFFERENT MEASURING INSTRUMENTS)
Explore 74 Videos
- CURRENT ELECTRICITYBook:ERRORLESSChapter:CURRENT ELECTRICITYExercise:NCERT BASED QUESTIONS (HEATING EFFECT OF CURRENT)
Explore 67 Videos
- CURRENT ELECTRICITYBook:ERRORLESSChapter:CURRENT ELECTRICITYExercise:NCERT BASED QUESTIONS (Grouping of Resistances)
Explore 69 Videos
- ATOMIC AND NUCLEAR PHYSICSBook:ERRORLESSChapter:ATOMIC AND NUCLEAR PHYSICSExercise:Assertion and Reason
Explore 23 Videos
- ELECTROMAGNETIC INDUCTIONBook:ERRORLESSChapter:ELECTROMAGNETIC INDUCTIONExercise:ASSERTION & REASON
Explore 20 Videos
Similar Questions
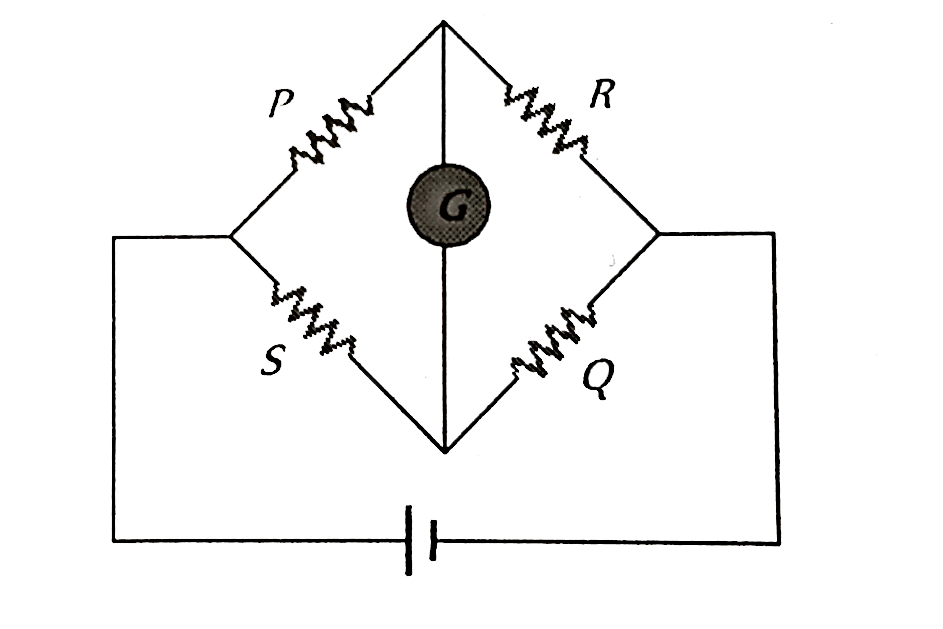
In the circuit given, the correct relation to a balanced Wheatstone bridge is

View SolutionIf R1 and R2 are respectively the filament resistances of a 200 watt bulb and 100 watt bulb designed to operate on the same voltage, then
View SolutionTwo resistors of resistance R1 and R2 having R1>R2 are connected in parallel. For equivalent resistance R, the correct statement is
View SolutionIt is not possible to use .35C1 as the fuel for fusion energy.
The binding energy of .35C1 is too small.
View SolutionAssertion: Eddy current is produced in any metallic conductor when magnetic flux is changed around it.
Reason: Electric potential determines the flow of charges
View SolutionTwo ideantical point charges are placed at a separation of d . P is a point on the line joining the charges, at a distance x from any one charge. The field at P is E, E is plotted against x for value of x from close to zero to slightly less then d . Which of the following represents the resulting curve
View SolutionThe two ends of a uniform conductor are joined to a cell of e.m.f. E and some internal resistance. Starting from the midpoint P of the conductor, we move in the direction of current and return to P. The potential V at every point on the path is plotted against the distance covered (x). which of the follwoing graphs best represent the resulting curve ?
View SolutionTwo parallel beams of protons and electrons, carrying equal currents are fixed at a separation d. The protons and electrons move in opposite directions. There is a point P on the straight perpendicular line joining the two beams at a distance x from one beam. The magnetic field at this point is B. If B is plotted against x, it can be represented by the curve.
View SolutionA potential difference is applied between the ends of a conductor of uniform radius 2mm. It results in an electric field of strength 250V/m along the length of conductor. Find the resistivity of the material if current in the conductor is 2πA.
View SolutionA thin, straight conductor lies along the axis of a hollow conductor of radius R . The two carry equal currents in the same direction. The magnetic field B is plotted against the distance r from the axis. Which of the following best represents the resulting curve?
View SolutionTwo identical point charges are placed at a separation of l . P is a point on the line joining the charges, at a distance x from any one charge. The field at P is E.E is plotted against x for values of x from close to zero to slightly less than l . Which of the following best represents the resulting curve ?
View SolutionA graph is plotted between the potential difference (applied across the ends of a conductor) and the current (following through the conductor). The graph is a straight line
View SolutionLet V and E represent the gravitational potential and field at a distance r from the centre of a uniform solidx sphere. Consider the two statements.
A) The plot of V against r is discontinuous
B) The plot of E against r is discontinuous
View SolutionThe point mases each having a magnitude m are fixed at a separation l from each other. P is a point between the masses on the line joining them at a distance x from one of the masses. A graph is plotted for the gravitational potential V at P against. Among the following graphs, bet curve is
View SolutionThe point mases each having a magnitude m are fixed at a separation l from each other. P is a point between the masses on the line joining them at a distance x from one of the masses. A graph is plotted for the gravitational potential V at P against. Among the following graphs, bet curve is
View SolutionA potential difference is applied between the ends of a conductor of uniform radius 1.5 mm. It results in an electric field of strength 250 V/m along the length of conductor. Find the resistivity of the material if current in the conductor is 2A.
View Solution