Resistance as shown in figure is negative at-

A
A
B
B
C
C
D
None of these
Video Solution
Text Solution
The correct Answer is:A
At point A, slope of graph is −ve. Hence, Resistances is −ve.
|
Topper's Solved these Questions
- CURRENT ELECTRICITYBOOK - ERRORLESSCHAPTER - CURRENT ELECTRICITYEXERCISE - NCERT BASED QUESTIONS (Grouping of Resistances)
69 Videos
- CURRENT ELECTRICITYBOOK - ERRORLESSCHAPTER - CURRENT ELECTRICITYEXERCISE - NCERT BASED QUESTIONS (KIRCHHOFF.S LAW, CELLS)
53 Videos
- ATOMIC AND NUCLEAR PHYSICSBOOK - ERRORLESSCHAPTER - ATOMIC AND NUCLEAR PHYSICSEXERCISE - Assertion and Reason
23 Videos
- ELECTROMAGNETIC INDUCTIONBOOK - ERRORLESSCHAPTER - ELECTROMAGNETIC INDUCTIONEXERCISE - ASSERTION & REASON
20 Videos
Similar Questions
Knowledge Check
Each resistance shown in figure is 2Ω. The equivalent resistance between A and B is
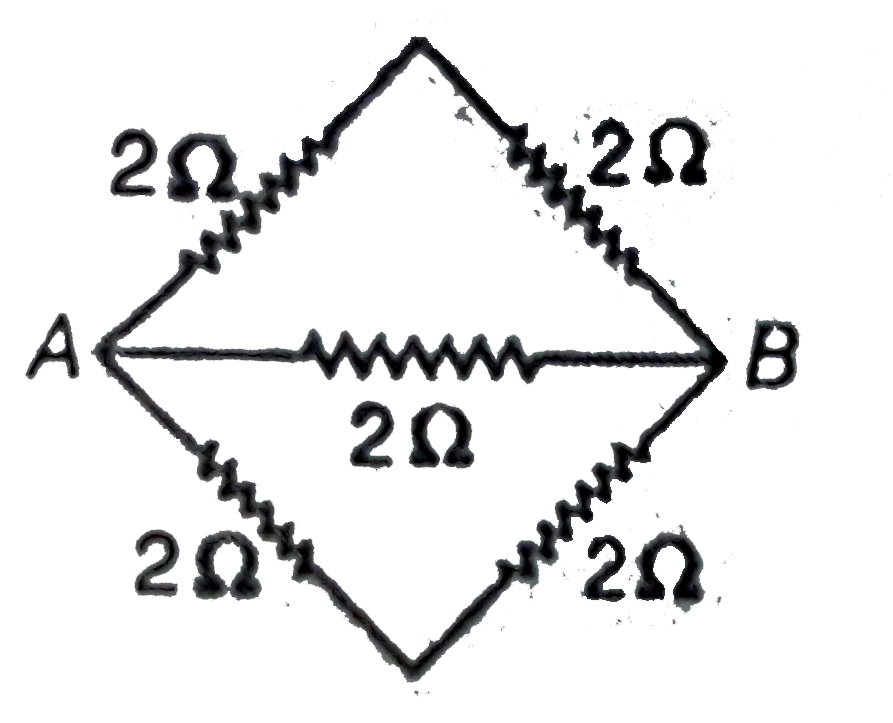 A2ΩB4ΩC8ΩD1Ω
For the network of resistance shown in the figure the equivalent resistance of the network between the points A and B is 18 ohm. The value of unknown resistance R is :
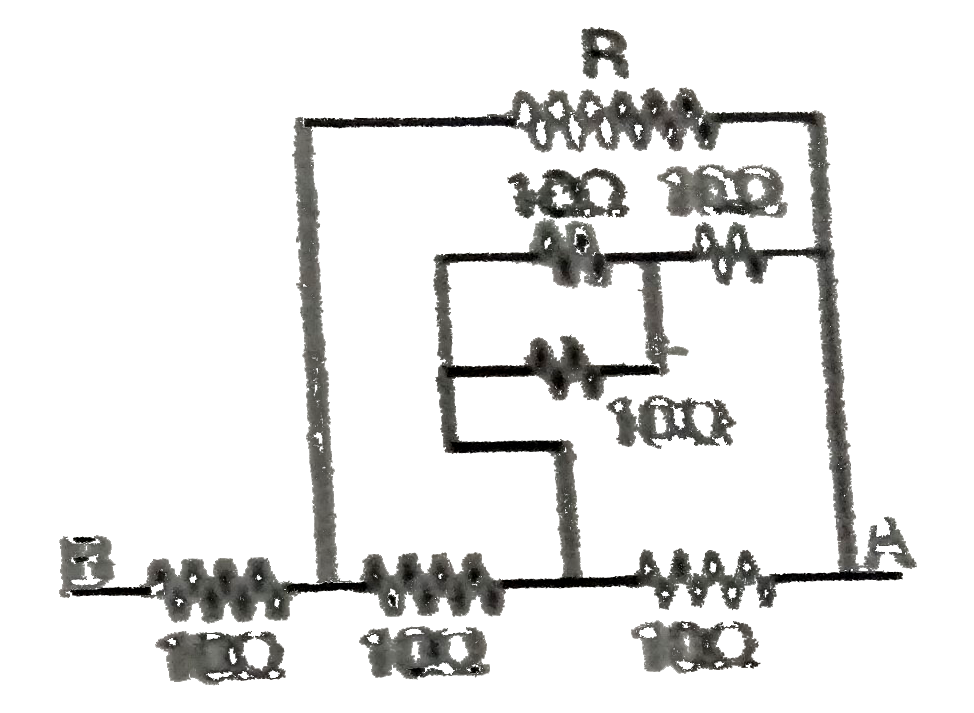 A8ΩB10ΩC16ΩD24Ω
Each resistance of the network shown in figure is r. Net resistance between
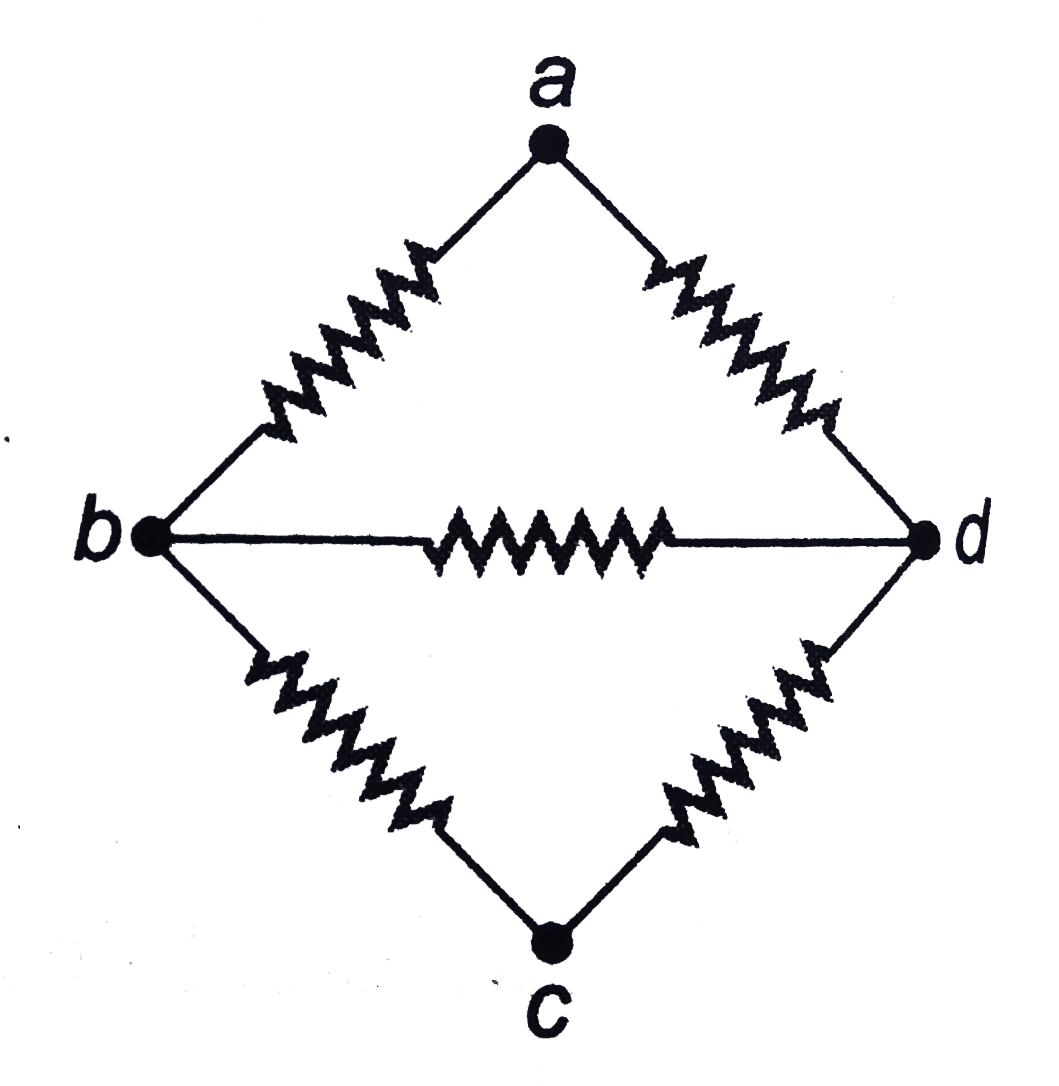 Aa and b is 73rBa and c isrCb and d isrDb and d is r2
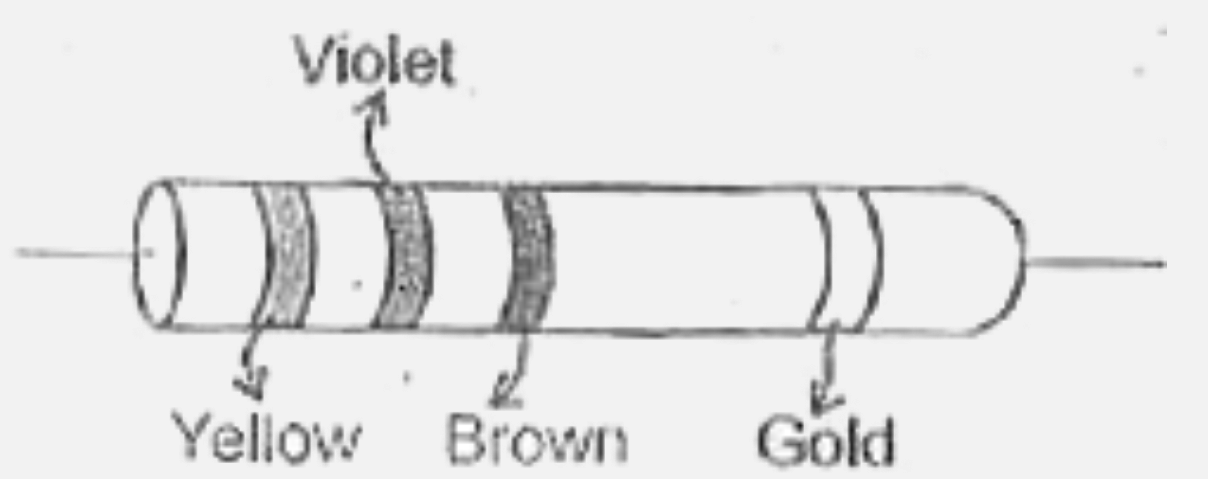
A resistance is shown in the figure. Its value and tolerance are given respectively by :
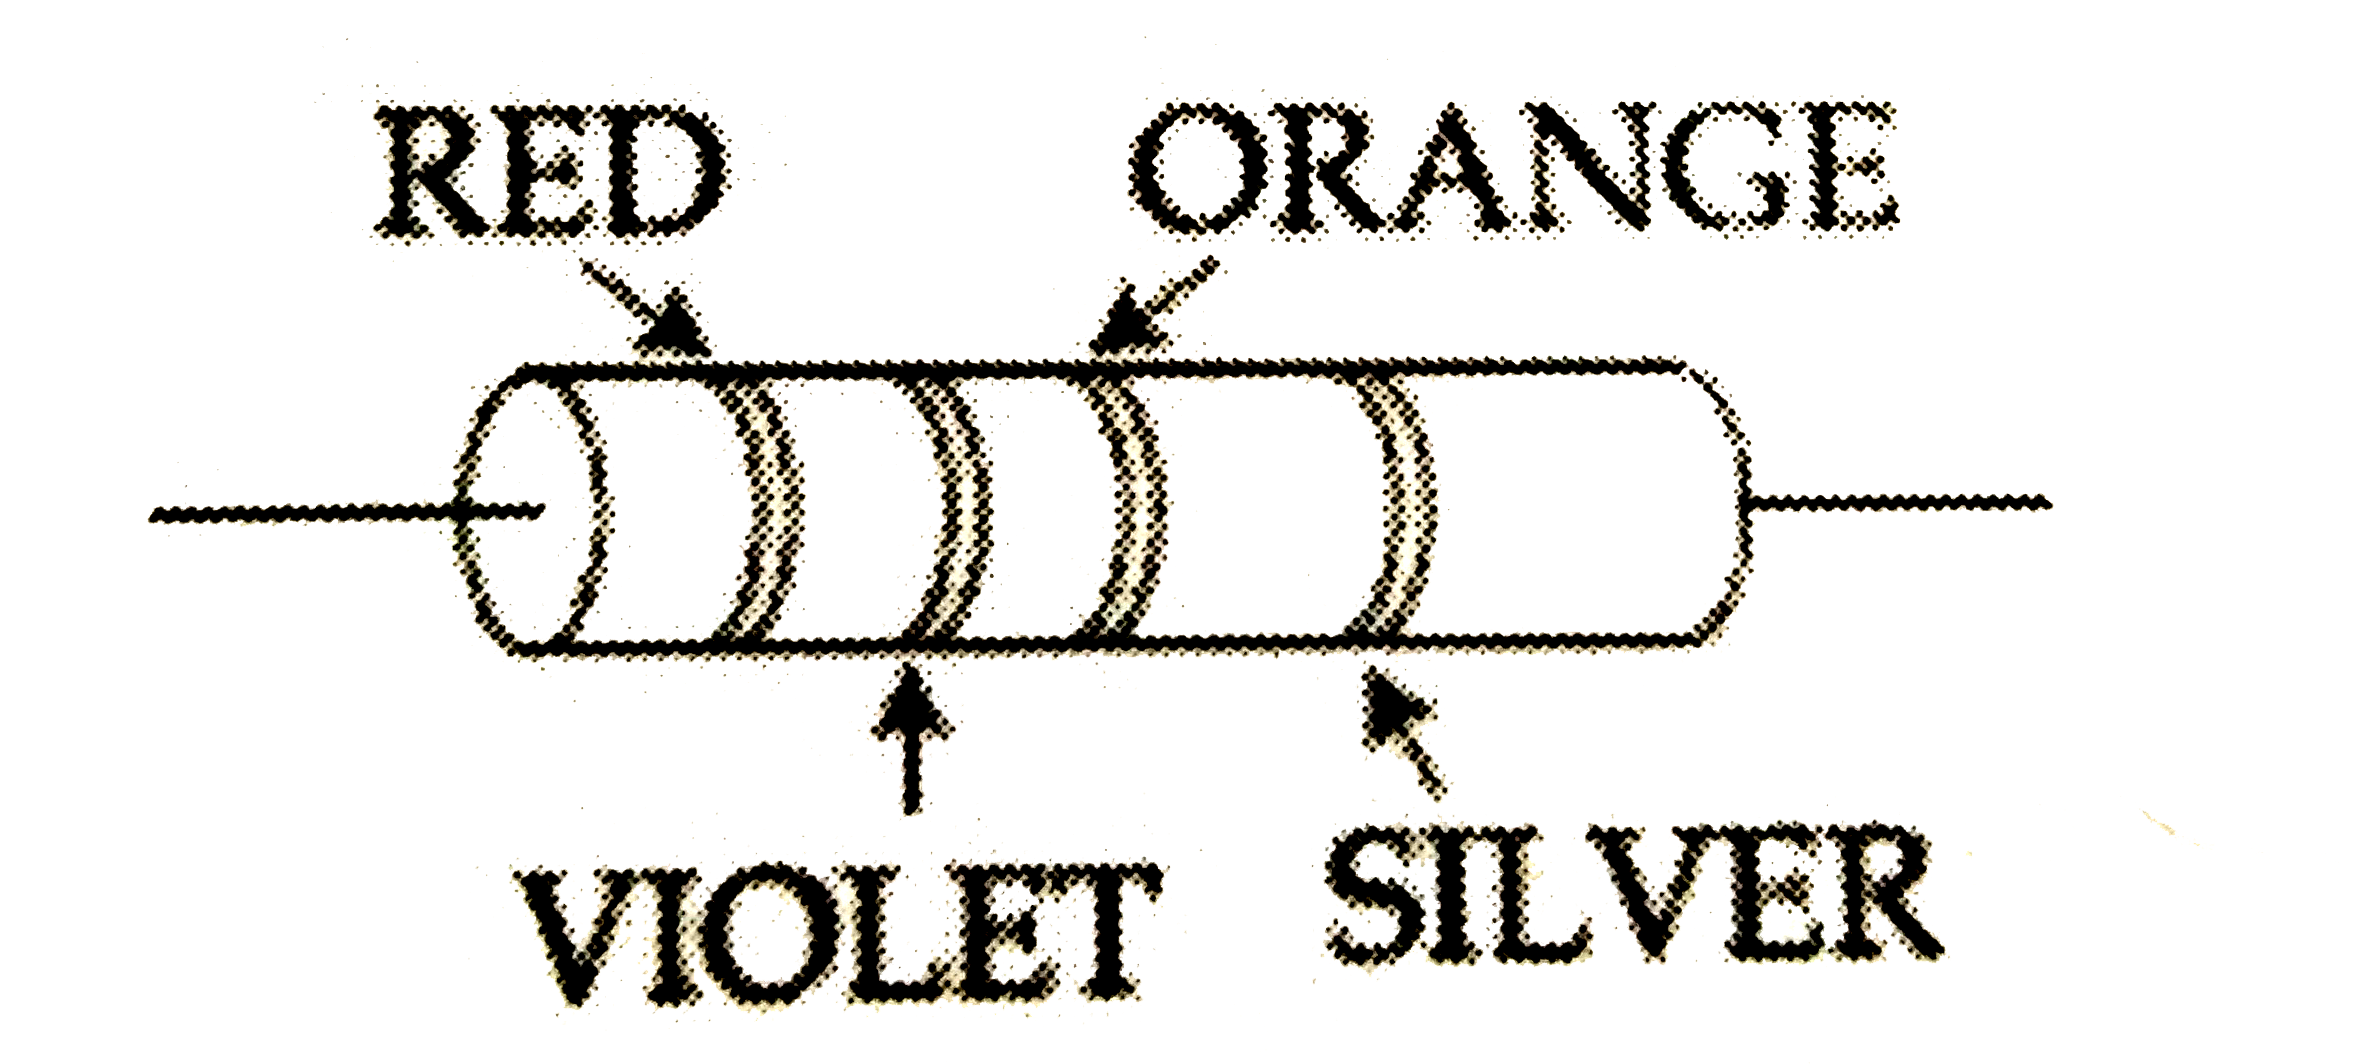
View SolutionA resistance is shown in the figure. Its value and tolerance are given respectively by :

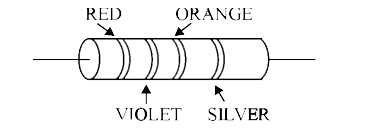
View SolutionA resistance is shown in the figure. Its value and tolerance are given respectively by:
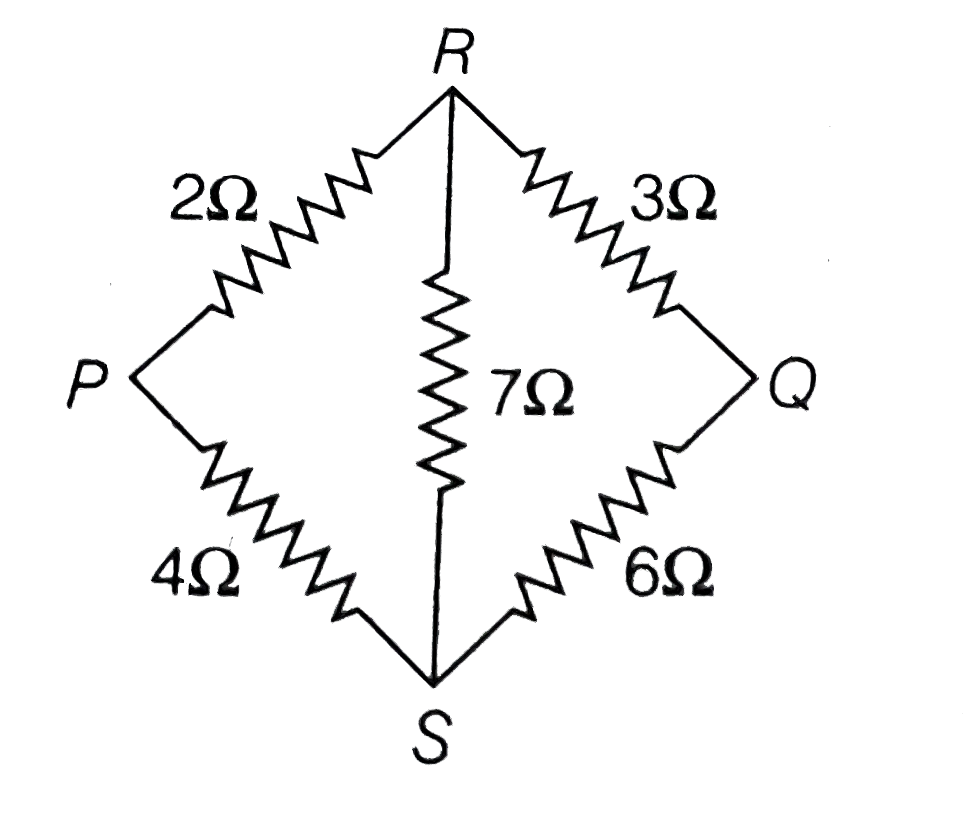
View SolutionFive resistance are connected as shown in the figure . The equivalent resistance between P and Q will be
View SolutionA carbon resistor has coloured strips as shown is figure. What is its resistance ?
View Solution

