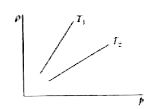
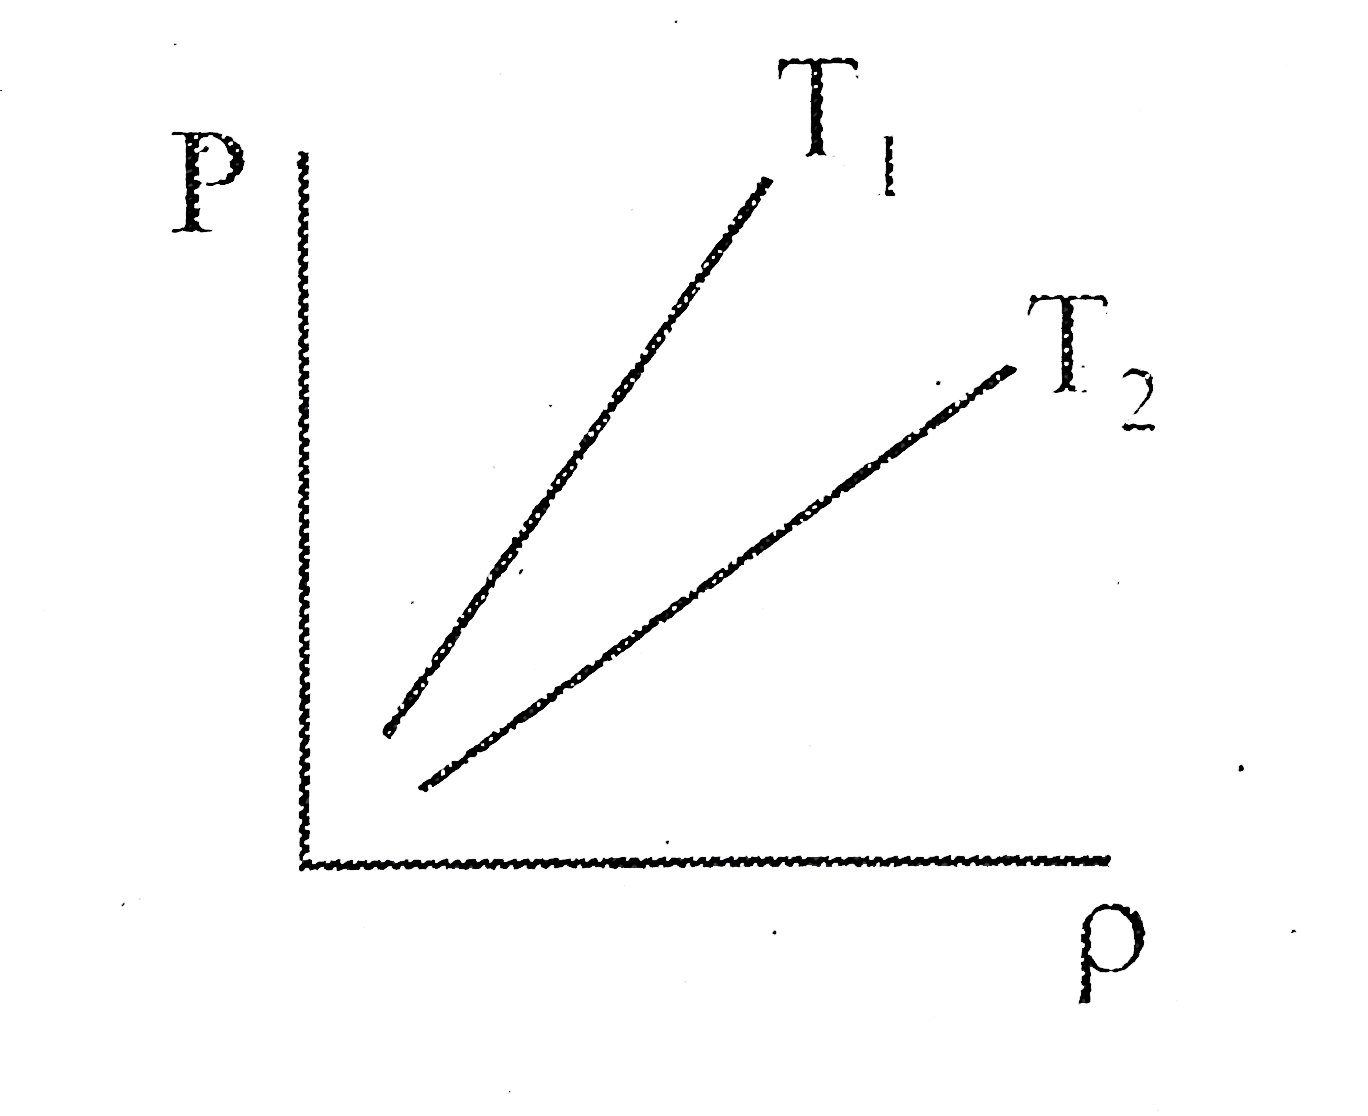
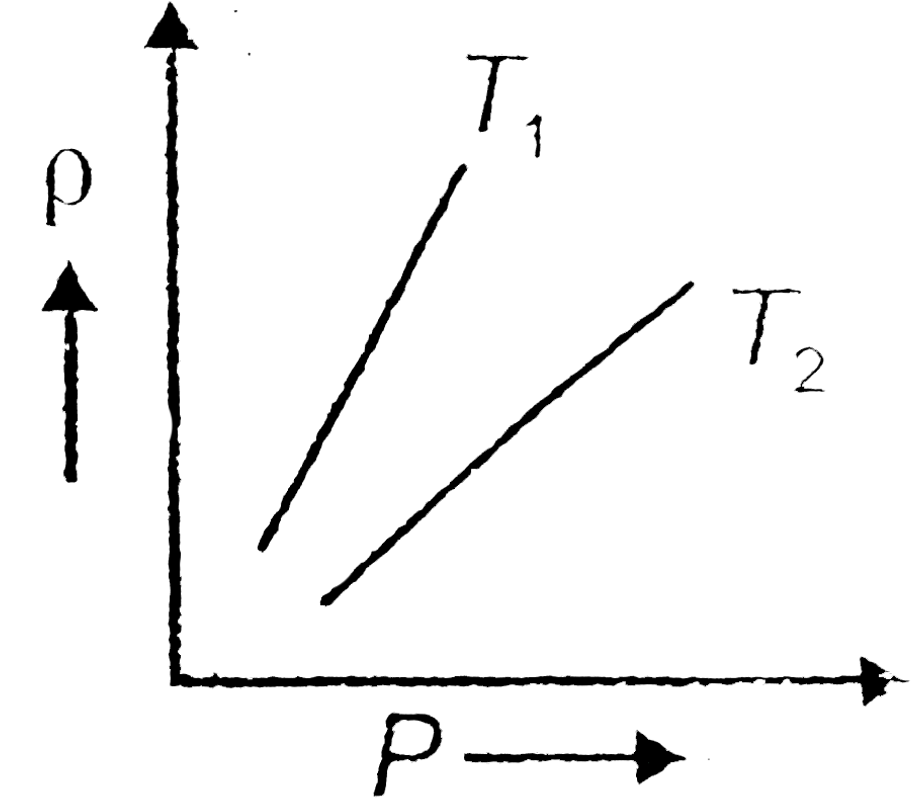
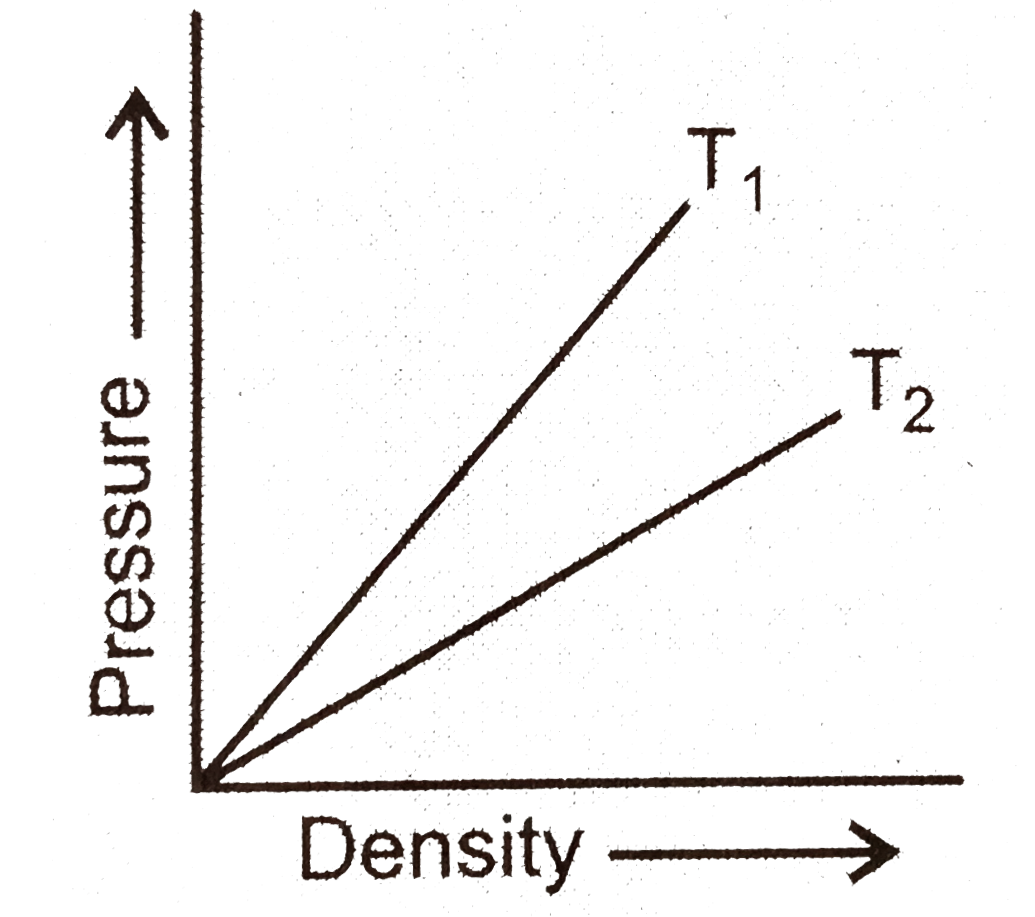
The density (ρ) versus pressure (P) graphs of a given mass of an ideal gas is shown at two temperatures T1andT2. Then relation between T1andT2 may be
A
T1>t2
B
T2>T1
C
T1=T2
D
All the three are possible
Video Solution
Text Solution
The correct Answer is:B
PV=mMRT
⇒Pρ=RTM⇒Pρ∝1T
Slope =Pρ, Hence T2>T1
|
Topper's Solved these Questions
- KINETIC THEORY OF GASES Book:ERRORLESSChapter:KINETIC THEORY OF GASES Exercise:NCERT BASED QUESTIONS (Speed of Gas)
Explore 24 Videos
- KINETIC THEORY OF GASES Book:ERRORLESSChapter:KINETIC THEORY OF GASES Exercise:NCERT BASED QUESTIONS (Degree of Freedom and Specific Heat)
Explore 30 Videos
- GRAVITATIONBook:ERRORLESSChapter:GRAVITATIONExercise:Assertion and Reason
Explore 25 Videos
- MOTION IN ONE DIMENSIONBook:ERRORLESSChapter:MOTION IN ONE DIMENSIONExercise:ASSERTION AND REASON
Explore 24 Videos
Similar Questions
Knowledge Check
Shows graphs of pressure vs density for an ideal gas at two temperaturesT1andT2
 A(a)T1>T2B(b)T1=T2C(c)T1<T2D(d)Any of the three is possibe.
Figure shows graphs of pressure vs density for an ideal gas at two temperatures Tt and T2
AT1>T2BT1=T2CT1<T2Dany of the three is possibleFigure shows graphs of pressure versus density for an ideal gas at two temperatures T1 and T2 Which is correct ?
 .AT1>T2BT2>T1CBothDNone of these
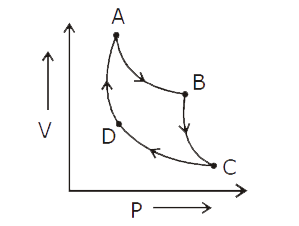
In the P - V diagram, the point B and C correspond to temperatures T1andT2 respectively. State relationship between T1andT2.
View SolutionThe P−T graph for the given mass of an ideal gas is shown in figure. Then the volume
_E01_022_Q01.png)
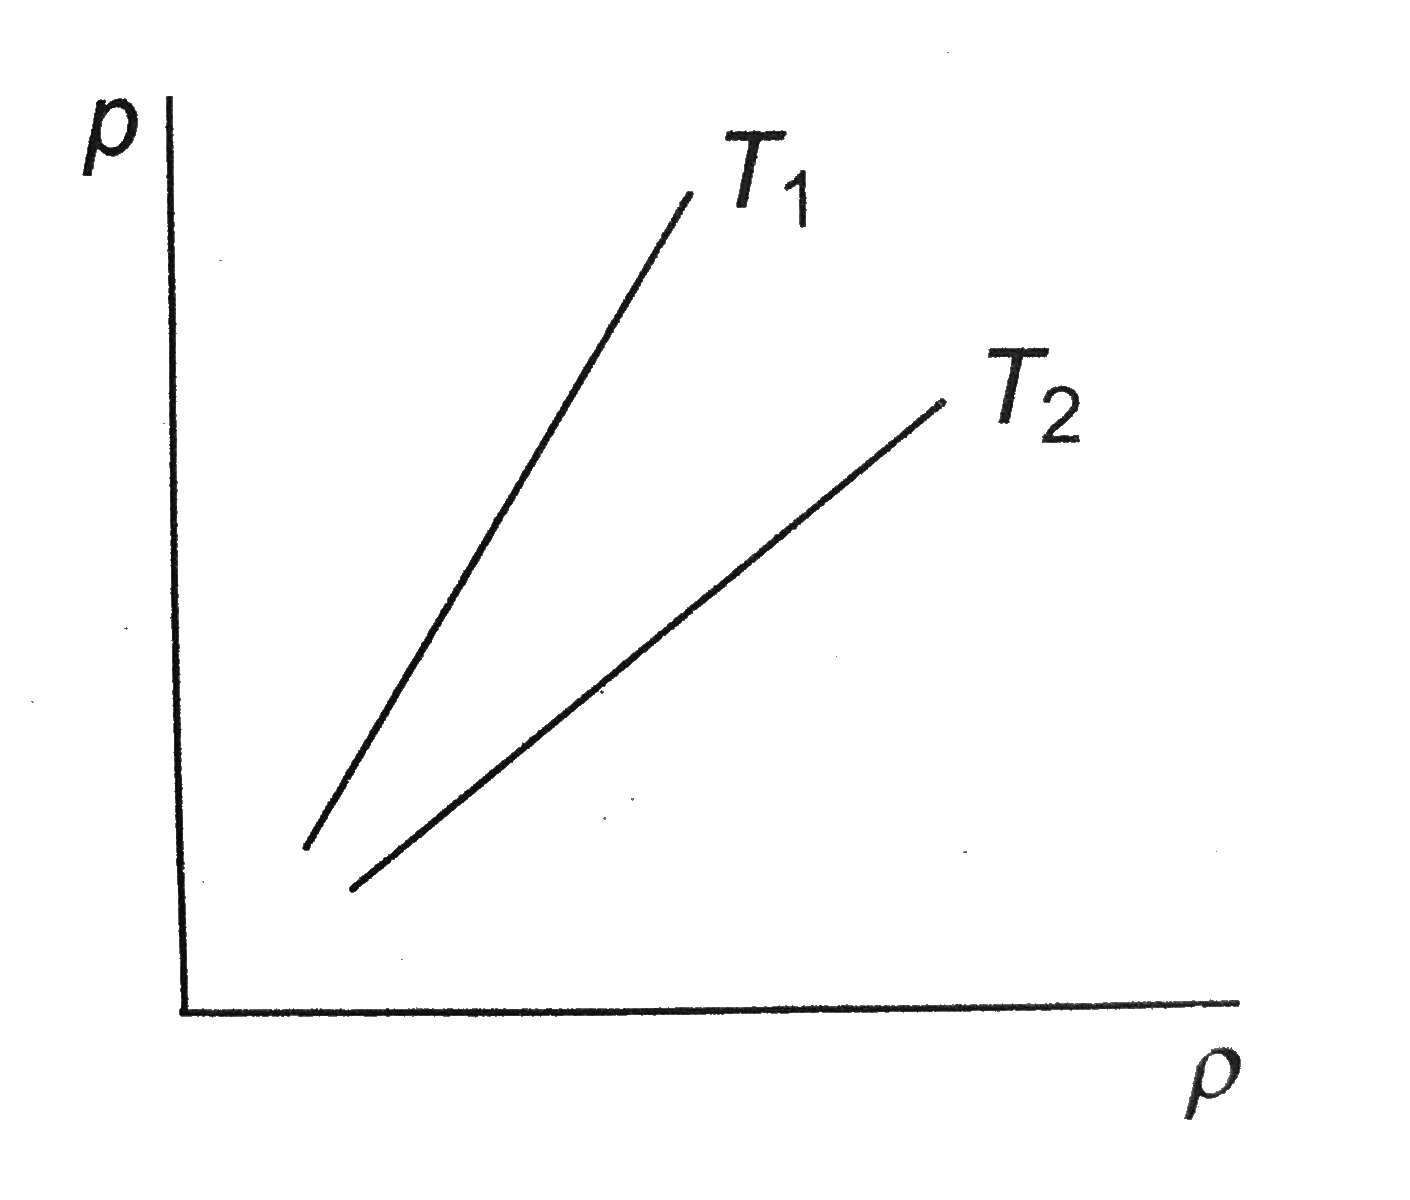
View SolutionFigure shows graphs of pressure vs density for an ideal gas at two temperature T1andT2. Which of the following is correct?
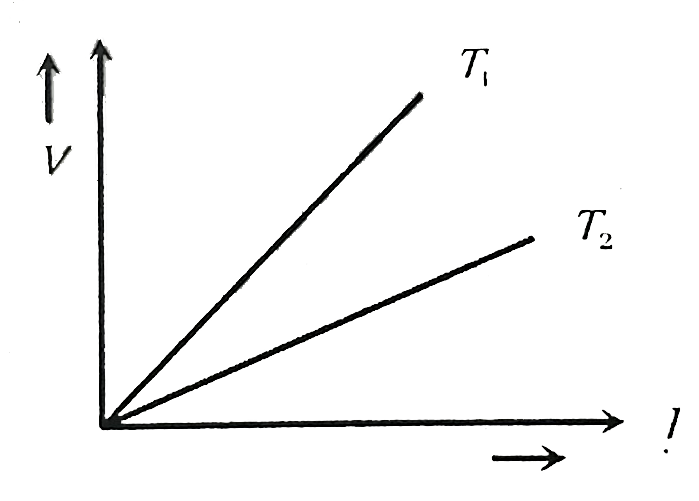
View SolutionThe voltage V and current I v graphs for a conductor at two different temperatures T1andT2 are shown in the figure. The relation between T1andT2 is

View SolutionThe voltage V and current I graph for a conductor at two different temperatures T1 and T2 are shown in the figure. The relation between T1 and T2 is
View Solution
