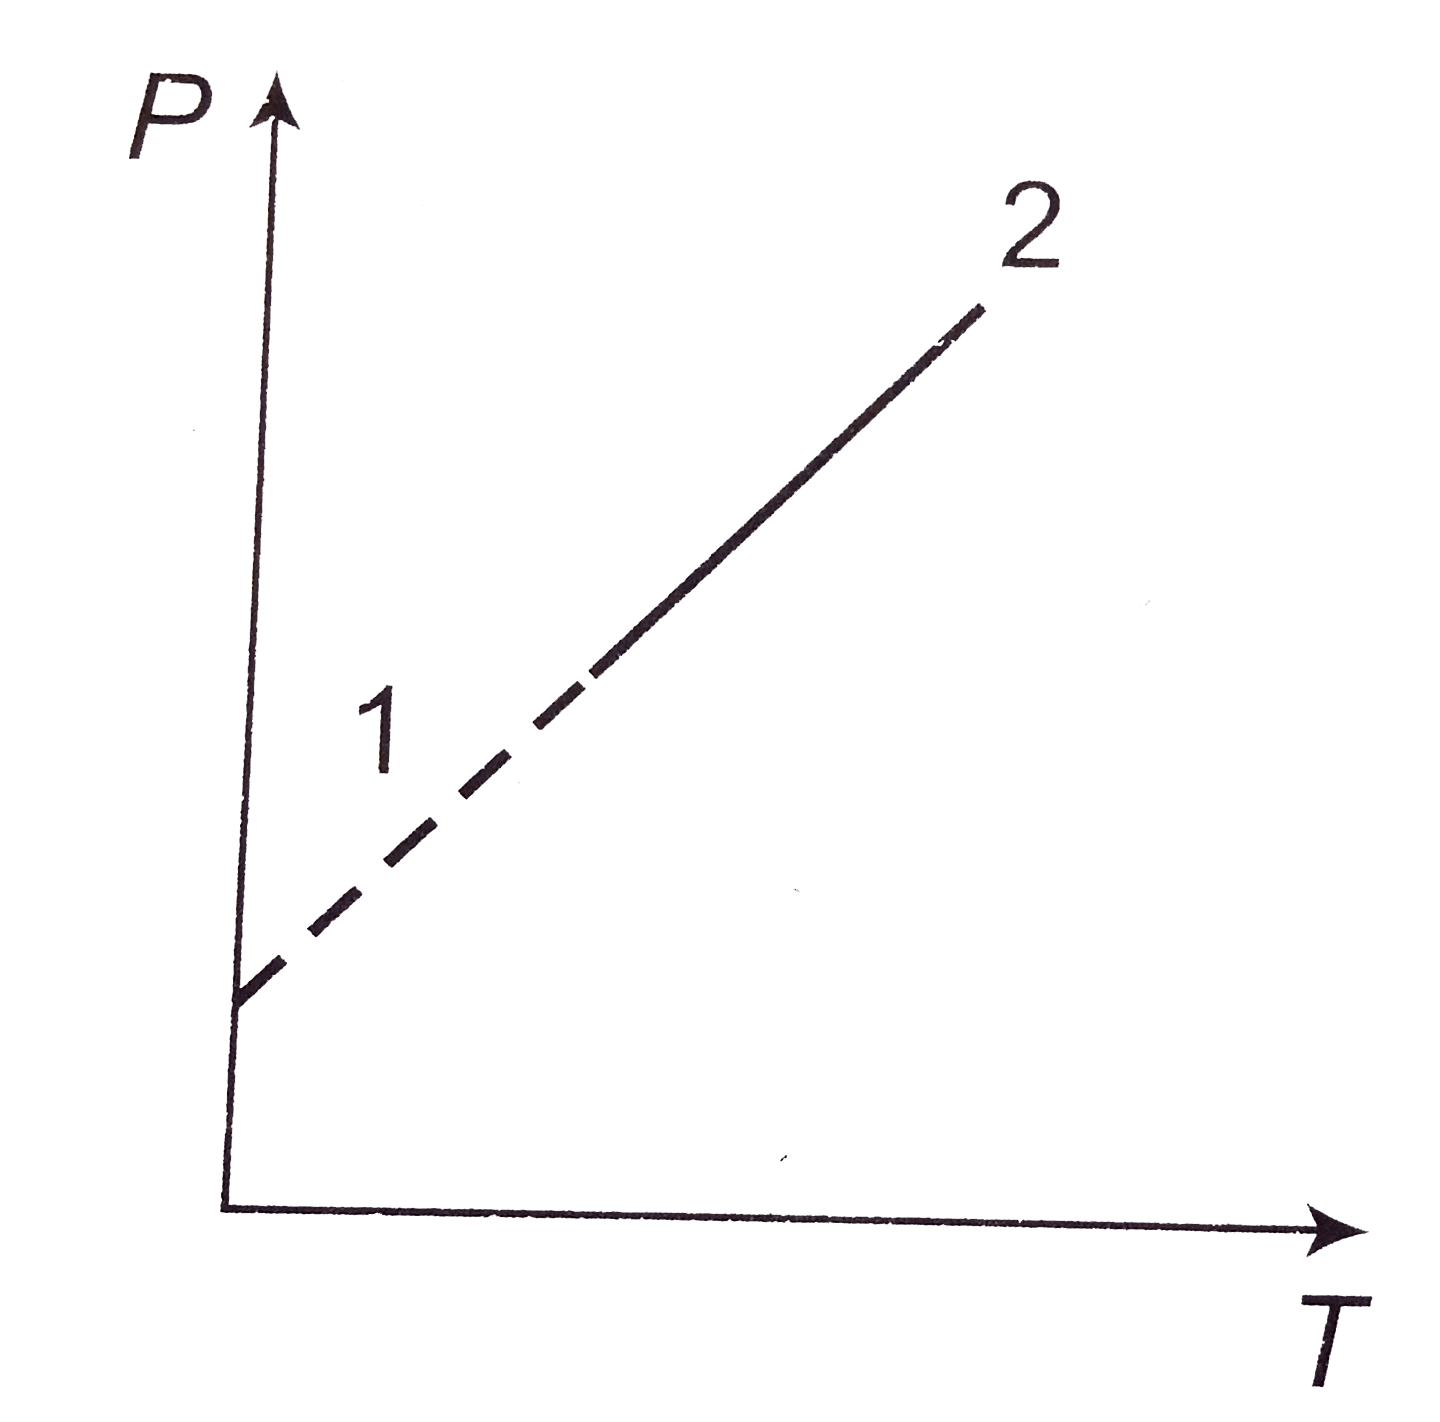
A pressure P, absolute temperature T, graph was obtained whe a given mass of a gas heated. During the heating process from the state 1 to the state 2, the volume
Remained constant
Decreased
Increased
Changed erratically
The correct Answer is:C
V∝TP, Since, T increase rapidly and P increases slowly thus volume of the gas increases
Topper's Solved these Questions
- KINETIC THEORY OF GASES BOOK - ERRORLESSCHAPTER - KINETIC THEORY OF GASES EXERCISE - NCERT BASED QUESTIONS (Speed of Gas)
24 Videos
- KINETIC THEORY OF GASES BOOK - ERRORLESSCHAPTER - KINETIC THEORY OF GASES EXERCISE - NCERT BASED QUESTIONS (Degree of Freedom and Specific Heat)
30 Videos
- GRAVITATIONBOOK - ERRORLESSCHAPTER - GRAVITATIONEXERCISE - Assertion and Reason
25 Videos
- MOTION IN ONE DIMENSIONBOOK - ERRORLESSCHAPTER - MOTION IN ONE DIMENSIONEXERCISE - ASSERTION AND REASON
24 Videos
Similar Questions
Knowledge Check
A volume V absolute temperature T diagram was obtained when a given mass of gas was heated. During the heating process from state 1 to 2, the pressure
_E01_062_Q01.png) ARemain constantBDecreasedCChanged erraticallyDIncreased
ARemain constantBDecreasedCChanged erraticallyDIncreasedAt pressure P and absolute temperature T a mass M of an ideal gas fills a closed container of volume V. An additional mass 2M of the same gas is added into the container and the volume is then reduced to V3 and the temperature to T3. The pressure of the gas will now be:
AP3BPC3PD9PThe P−T graph for the given mass of an ideal gas is shown in figure. Then the volume
_E01_022_Q01.png) AincreasesBdecreasesCremains constantDdata insuficient
AincreasesBdecreasesCremains constantDdata insuficient

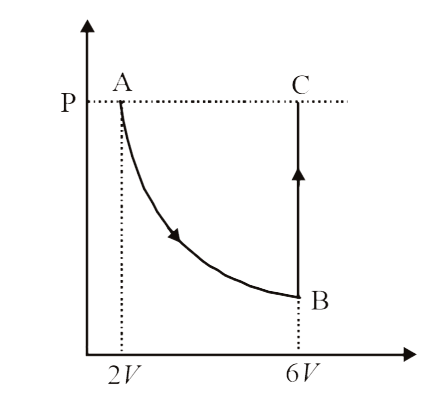
In the figure n mole of a monoatomic ideal gas undergo the process ABC as shown in the P-V diagram. The process AB is isothermal and BC is isochoric. The temperature of the gas at A is T0 total heat given to the gas during the process ABC is measured to be
Q. Heat absorbed by the gas in the process BC
View Solution
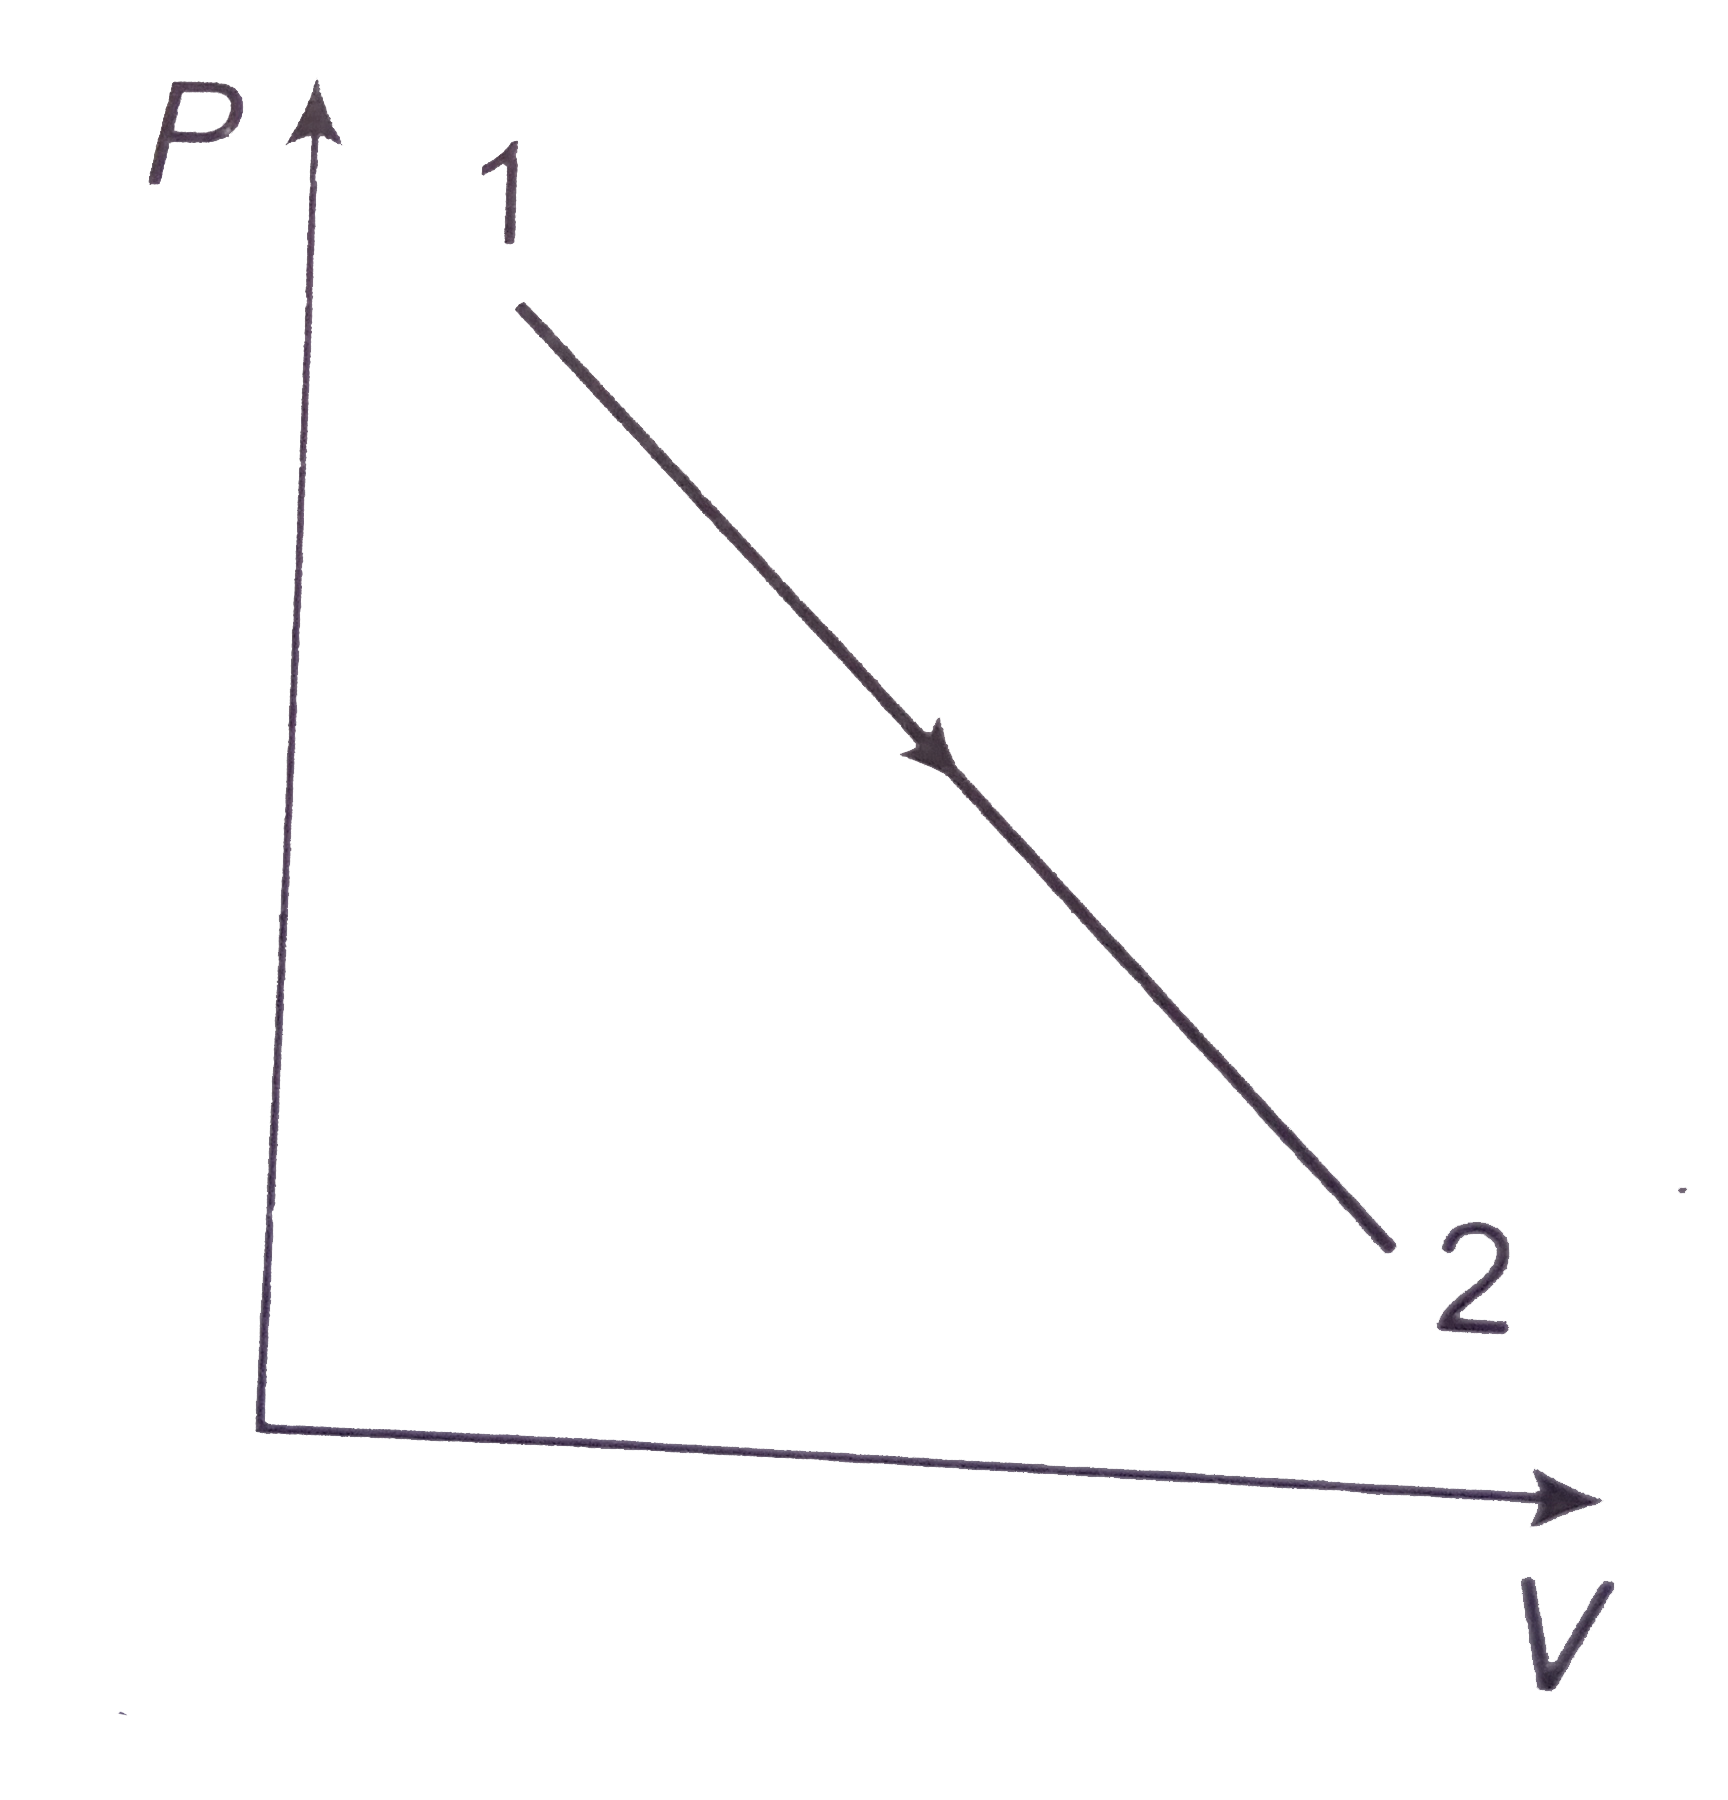
P−V graph was obtained from state 1 to state 2 when a given mass of a gas is subjected to temperature changes during the process the gas is
View SolutionTwo different masses m and 3m of an ideal gas are heated separately in a vessel of constant volume, the pressure P and absolute temperature T, graphs for these two cases are shown in the figure as A and B. The ratio of slopes of curves B to A is

View SolutionFor an adiabatic change in a gas, if P,V,T denotes pressure, volume and absolute temperature of a gas at any time and γ is the ratio of specific heats of the gas, then which of the following equation is true?
View SolutionA ideal gas has pressure 'p', volume 'V' and absolute temperature 'T'. It 'm' is the mass of each molecules and 'K' is the Boltzmann constant , the density of the gas is
View Solution
