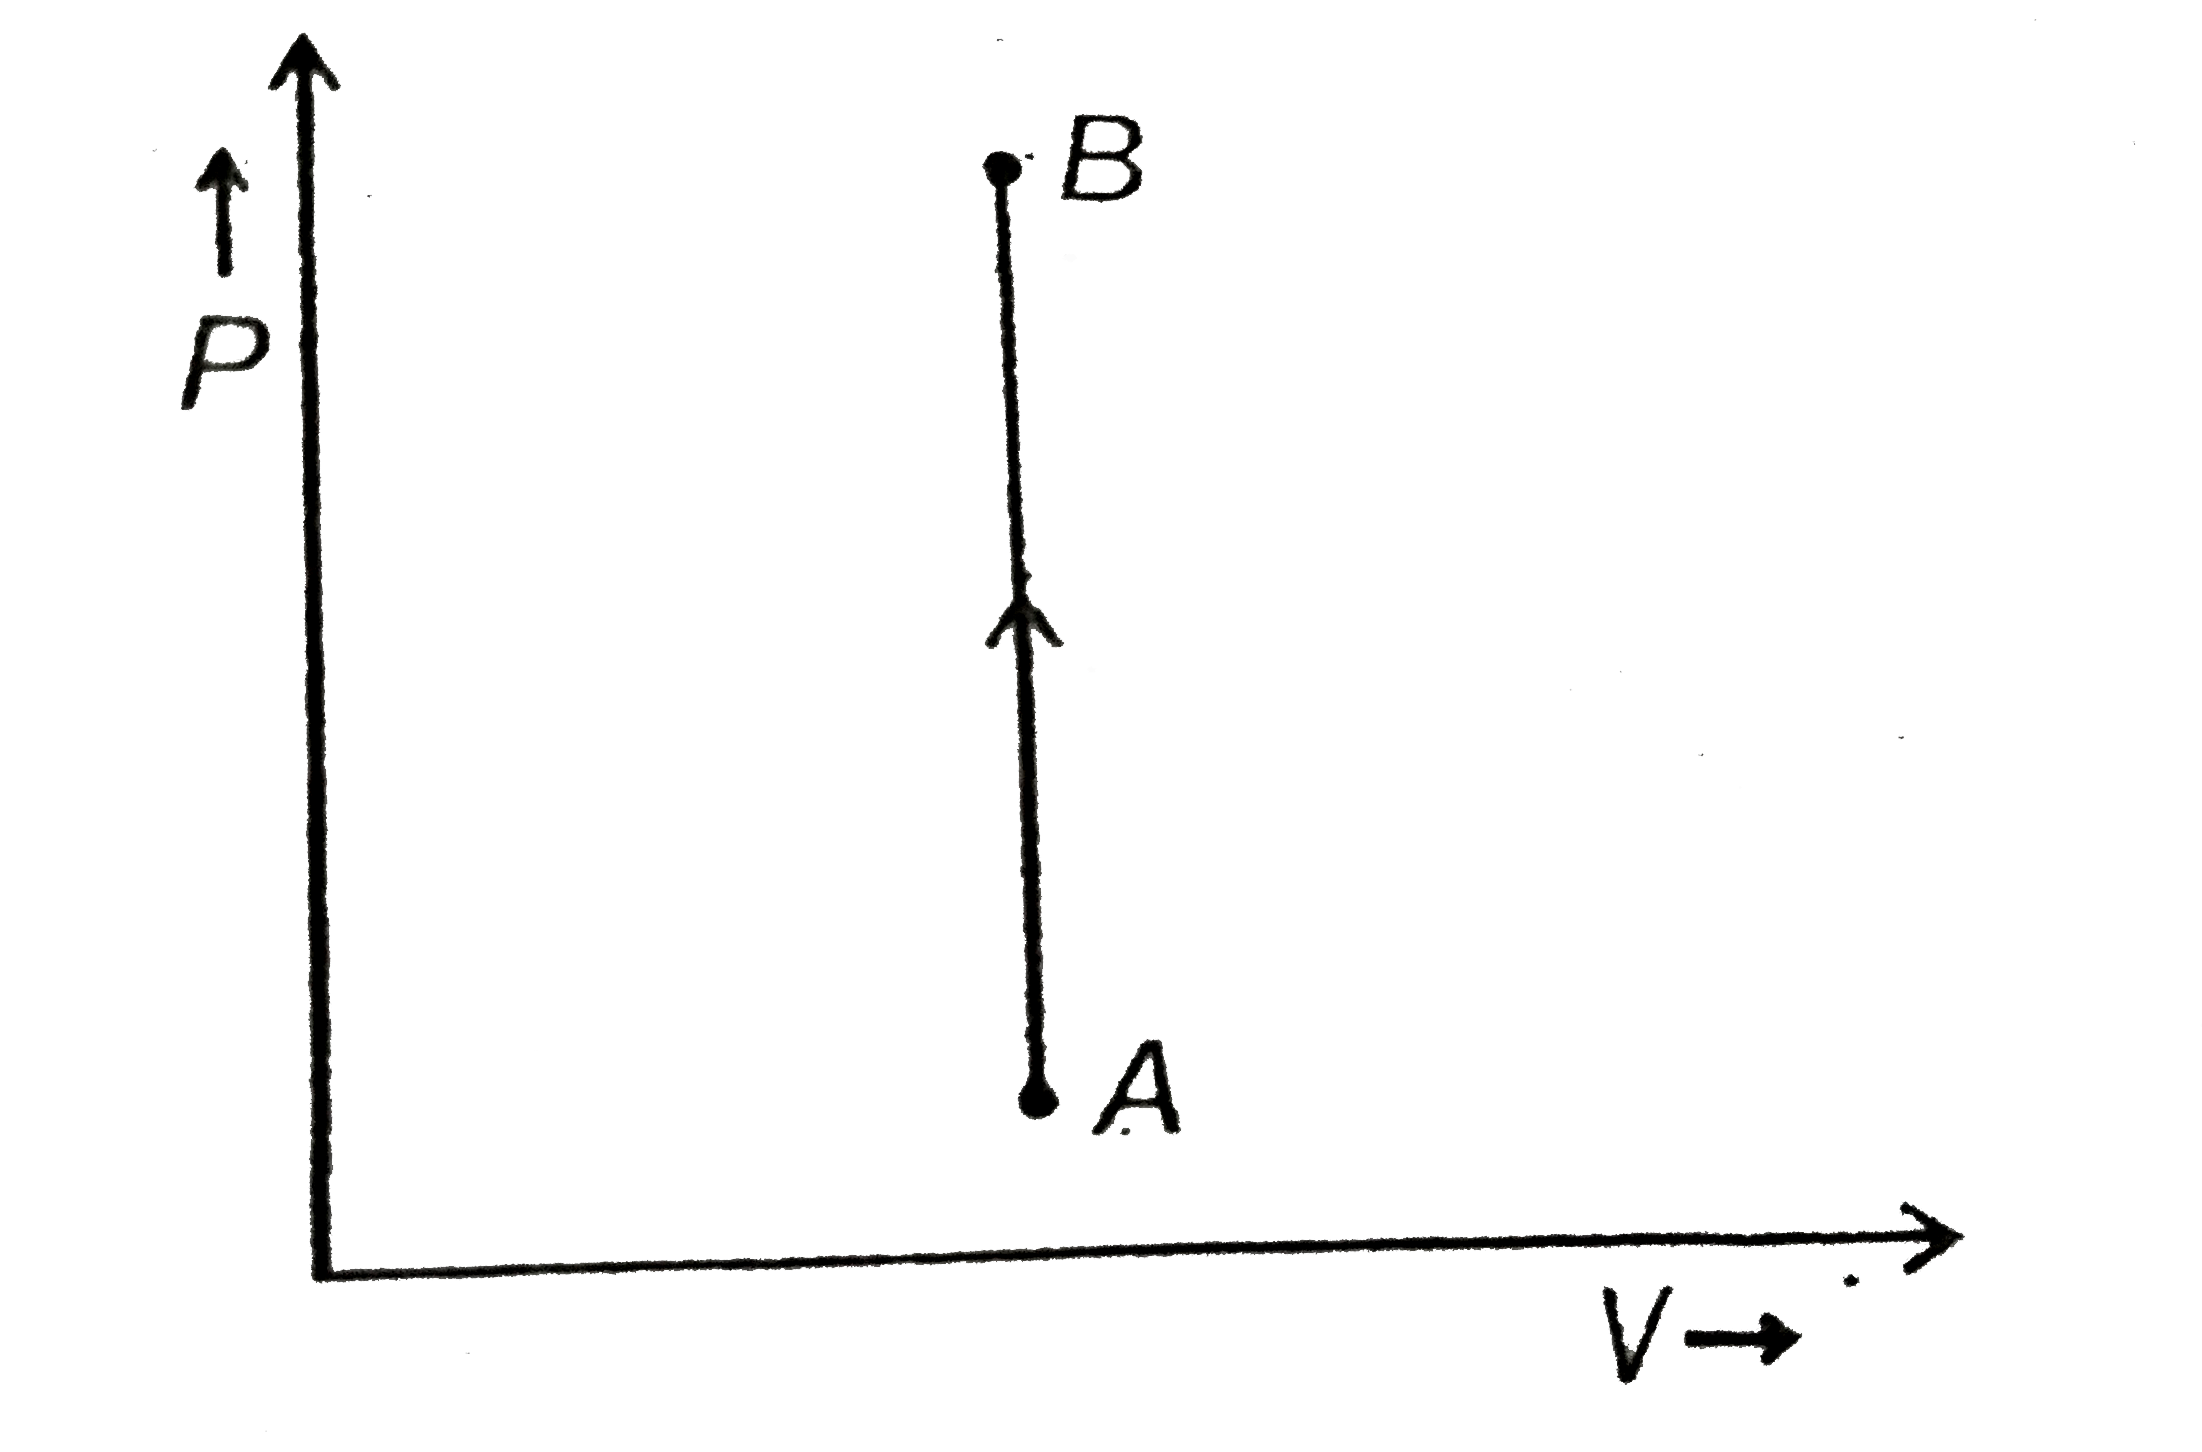
The given graph represents the environment in the graph. Which from the graph would you expect to have experienced the greatest amount of change?

Video Solution
Text Solution
Environment C
Environment A is stable or uniform, environment B follows cyclic pattern, environment C shows an irregular fall and rise in the rate of speciation.
|
Similar Questions
Knowledge Check
This graph represents:
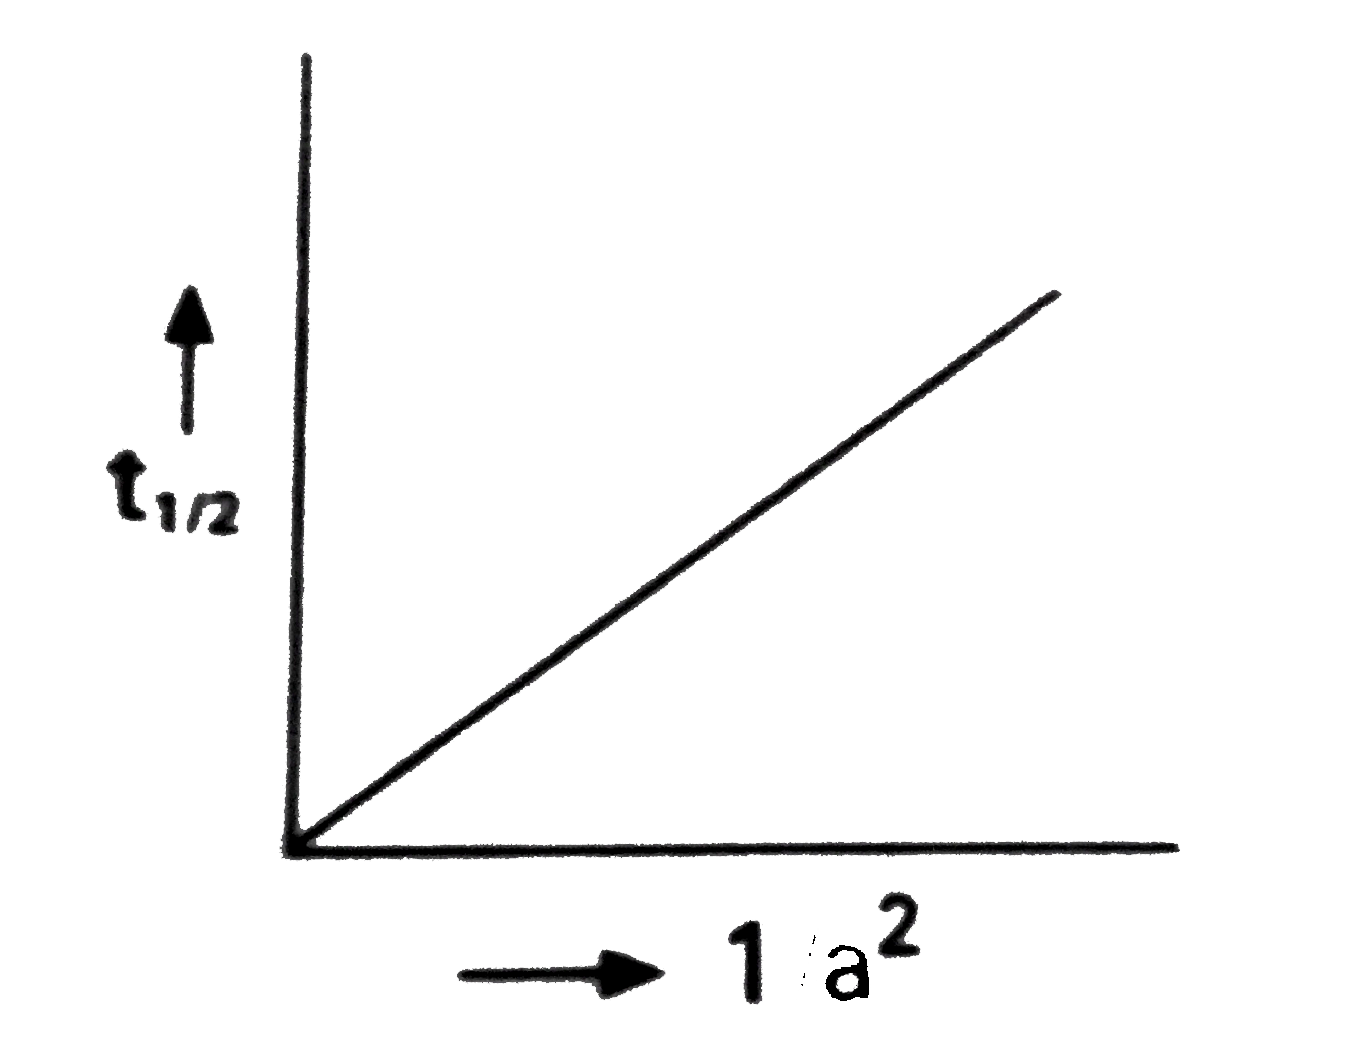 Afirst order reactionBzero order reactionCsecond order reactionDthird order reaction
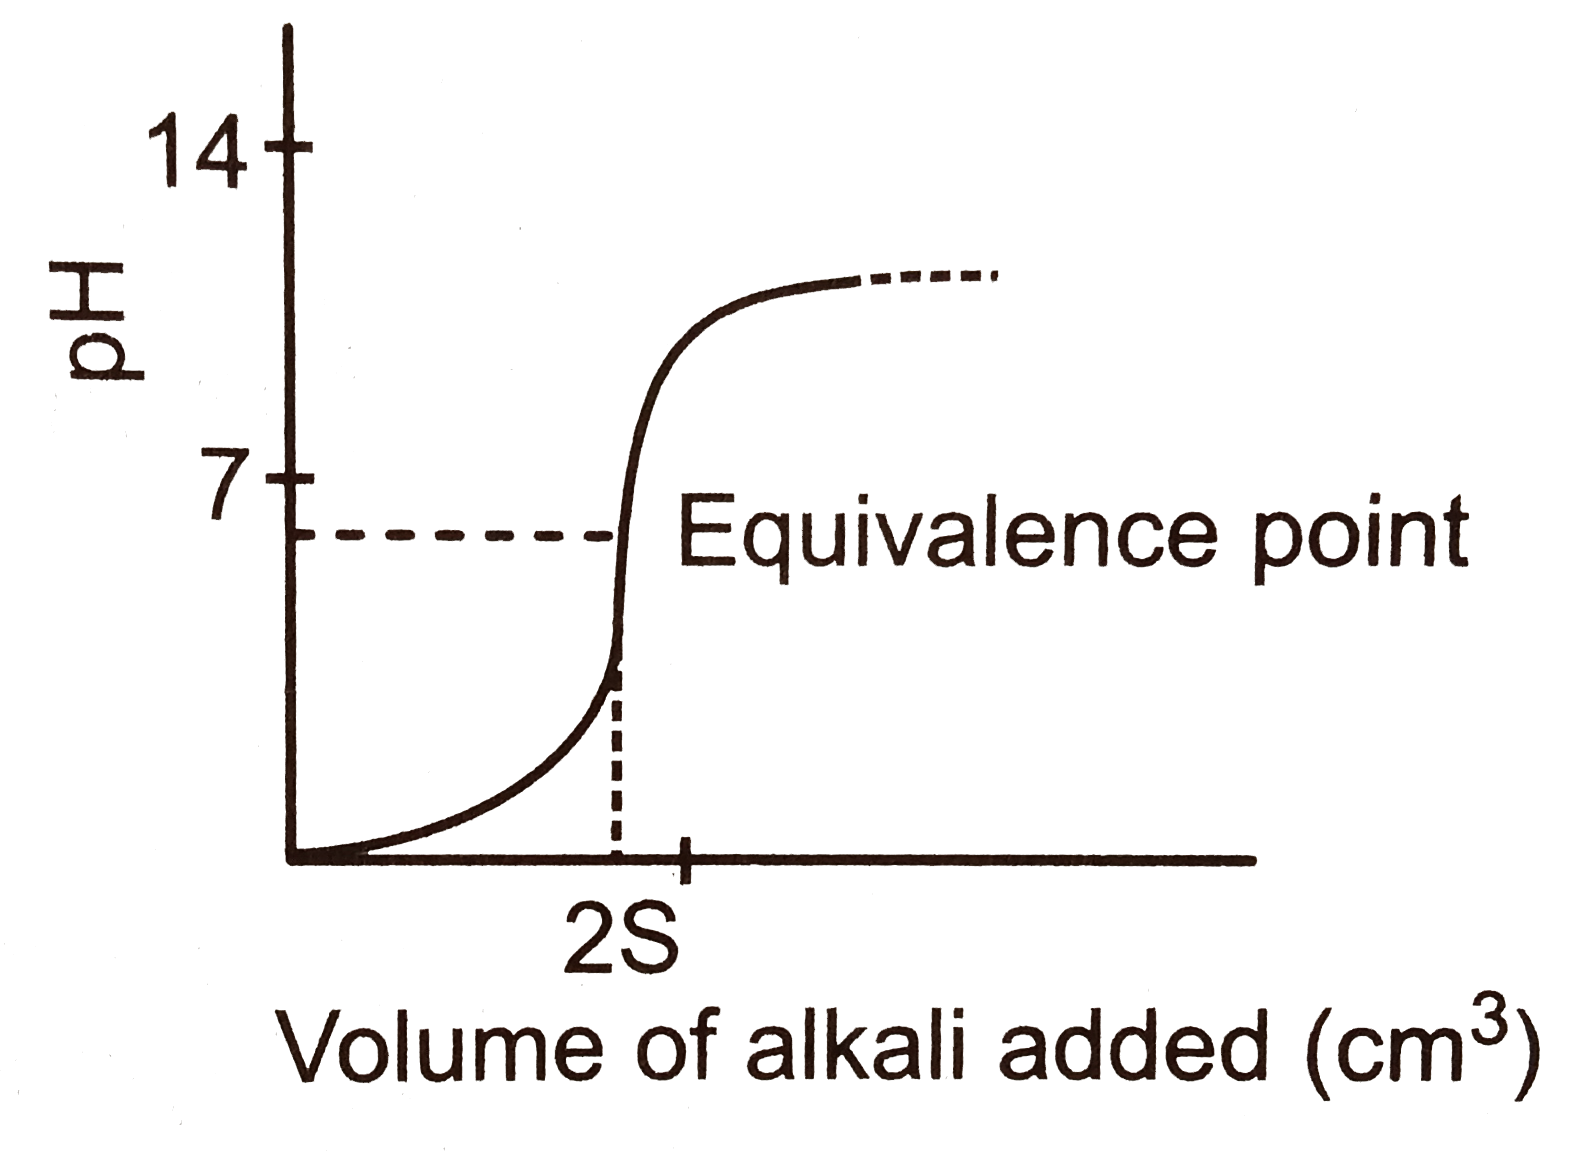
The graph represents the titration curve for :Astrong acid and strong baseBstrong acid and weak baseCweak acid and stong baseDweak acid and weak baseWhich graph represents the uniform acceleration
A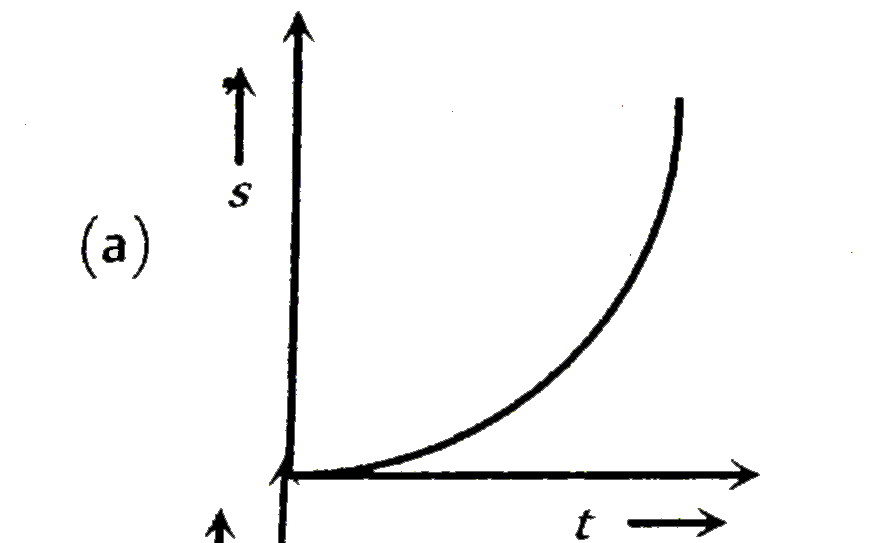 B
B C
C D
D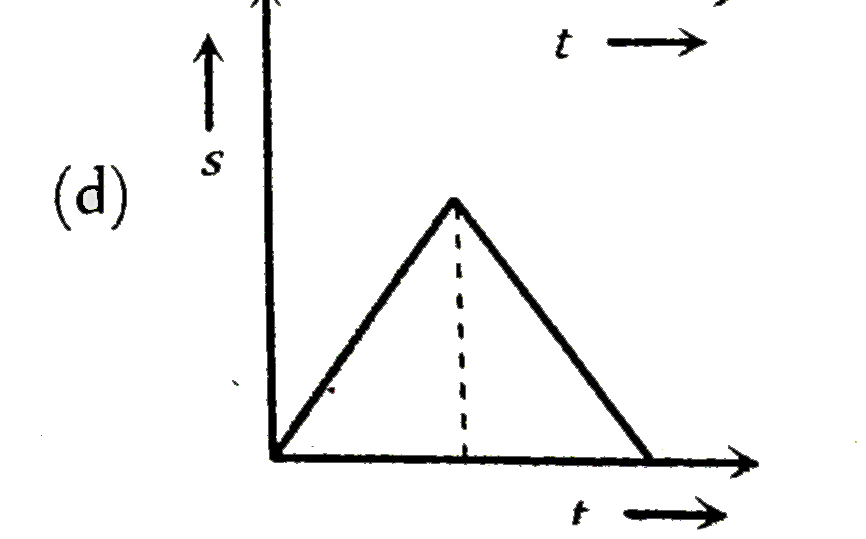
Draw the graph of |y|=[x], where [.] represents the greatest integer function.
View SolutionWhich graph represents positive acceleration ?
View SolutionWhat type of graph would you use to represent the following data?

View SolutionWhich graph represents an objects at rest ?
View SolutionThe graph representing Boyle's law is (are):
View Solution

