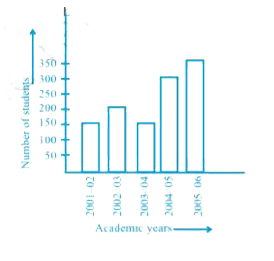
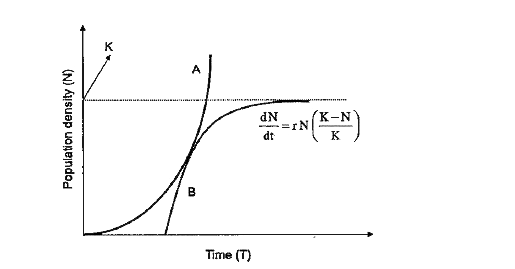
Analyse the graph given below and answer the questions based on it?
In the whole equation and related graph, K is quoted. What is K?
Video Solution
Text Solution
K is the value of carrying capacity. It is the upper limit of environment to bear the growth of population.
|
Similar Questions
Knowledge Check
Study the given bar graph carefully and answer the questions based on it.
Production (in lakh tonne) of wheat from 2005-10
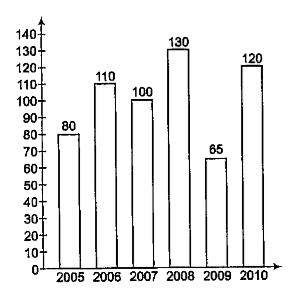
What is the mean production for all the years?A100.83 lakh tonneB110.5 lakh tonneC98.72 lakh tonneDNone of the aboveStudy the double bar graph given below and answer the question.
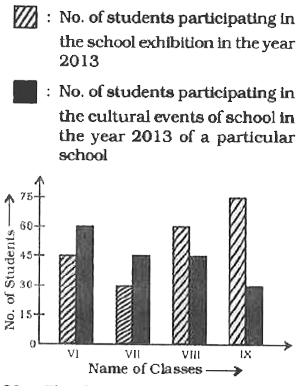
The class having maximum number of participants in exhibition isAClass IXBClass VIIICClass VIIDClass VIStudy the double bar graph given below and answer the questions.
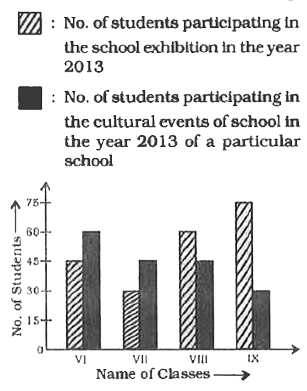
The average of the number of students participating in exhibition isA48.75B52.5C45D50
Read the bar graph given below and answer the following questions.
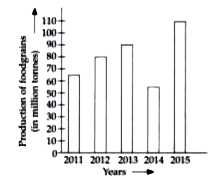
What is the ratio of the production of foodgrains in 2011 to that in 2014?
View SolutionRead the bar graph given below and answer the following questions:
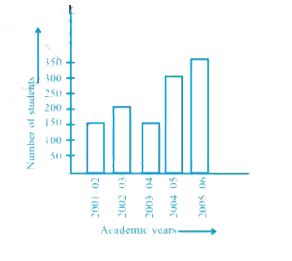
In which year is the number of students maximum?
View SolutionRead the bar graph given below and answer the following questions:
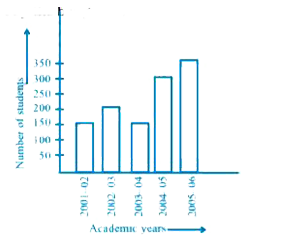
In which year is the number of students twice as that of 2001-02?
View Solutionquestion based on graphs OF quadratic polynomials
View SolutionSundy the four graphs given below. Answer the follwing questions on the basis of these graphs.
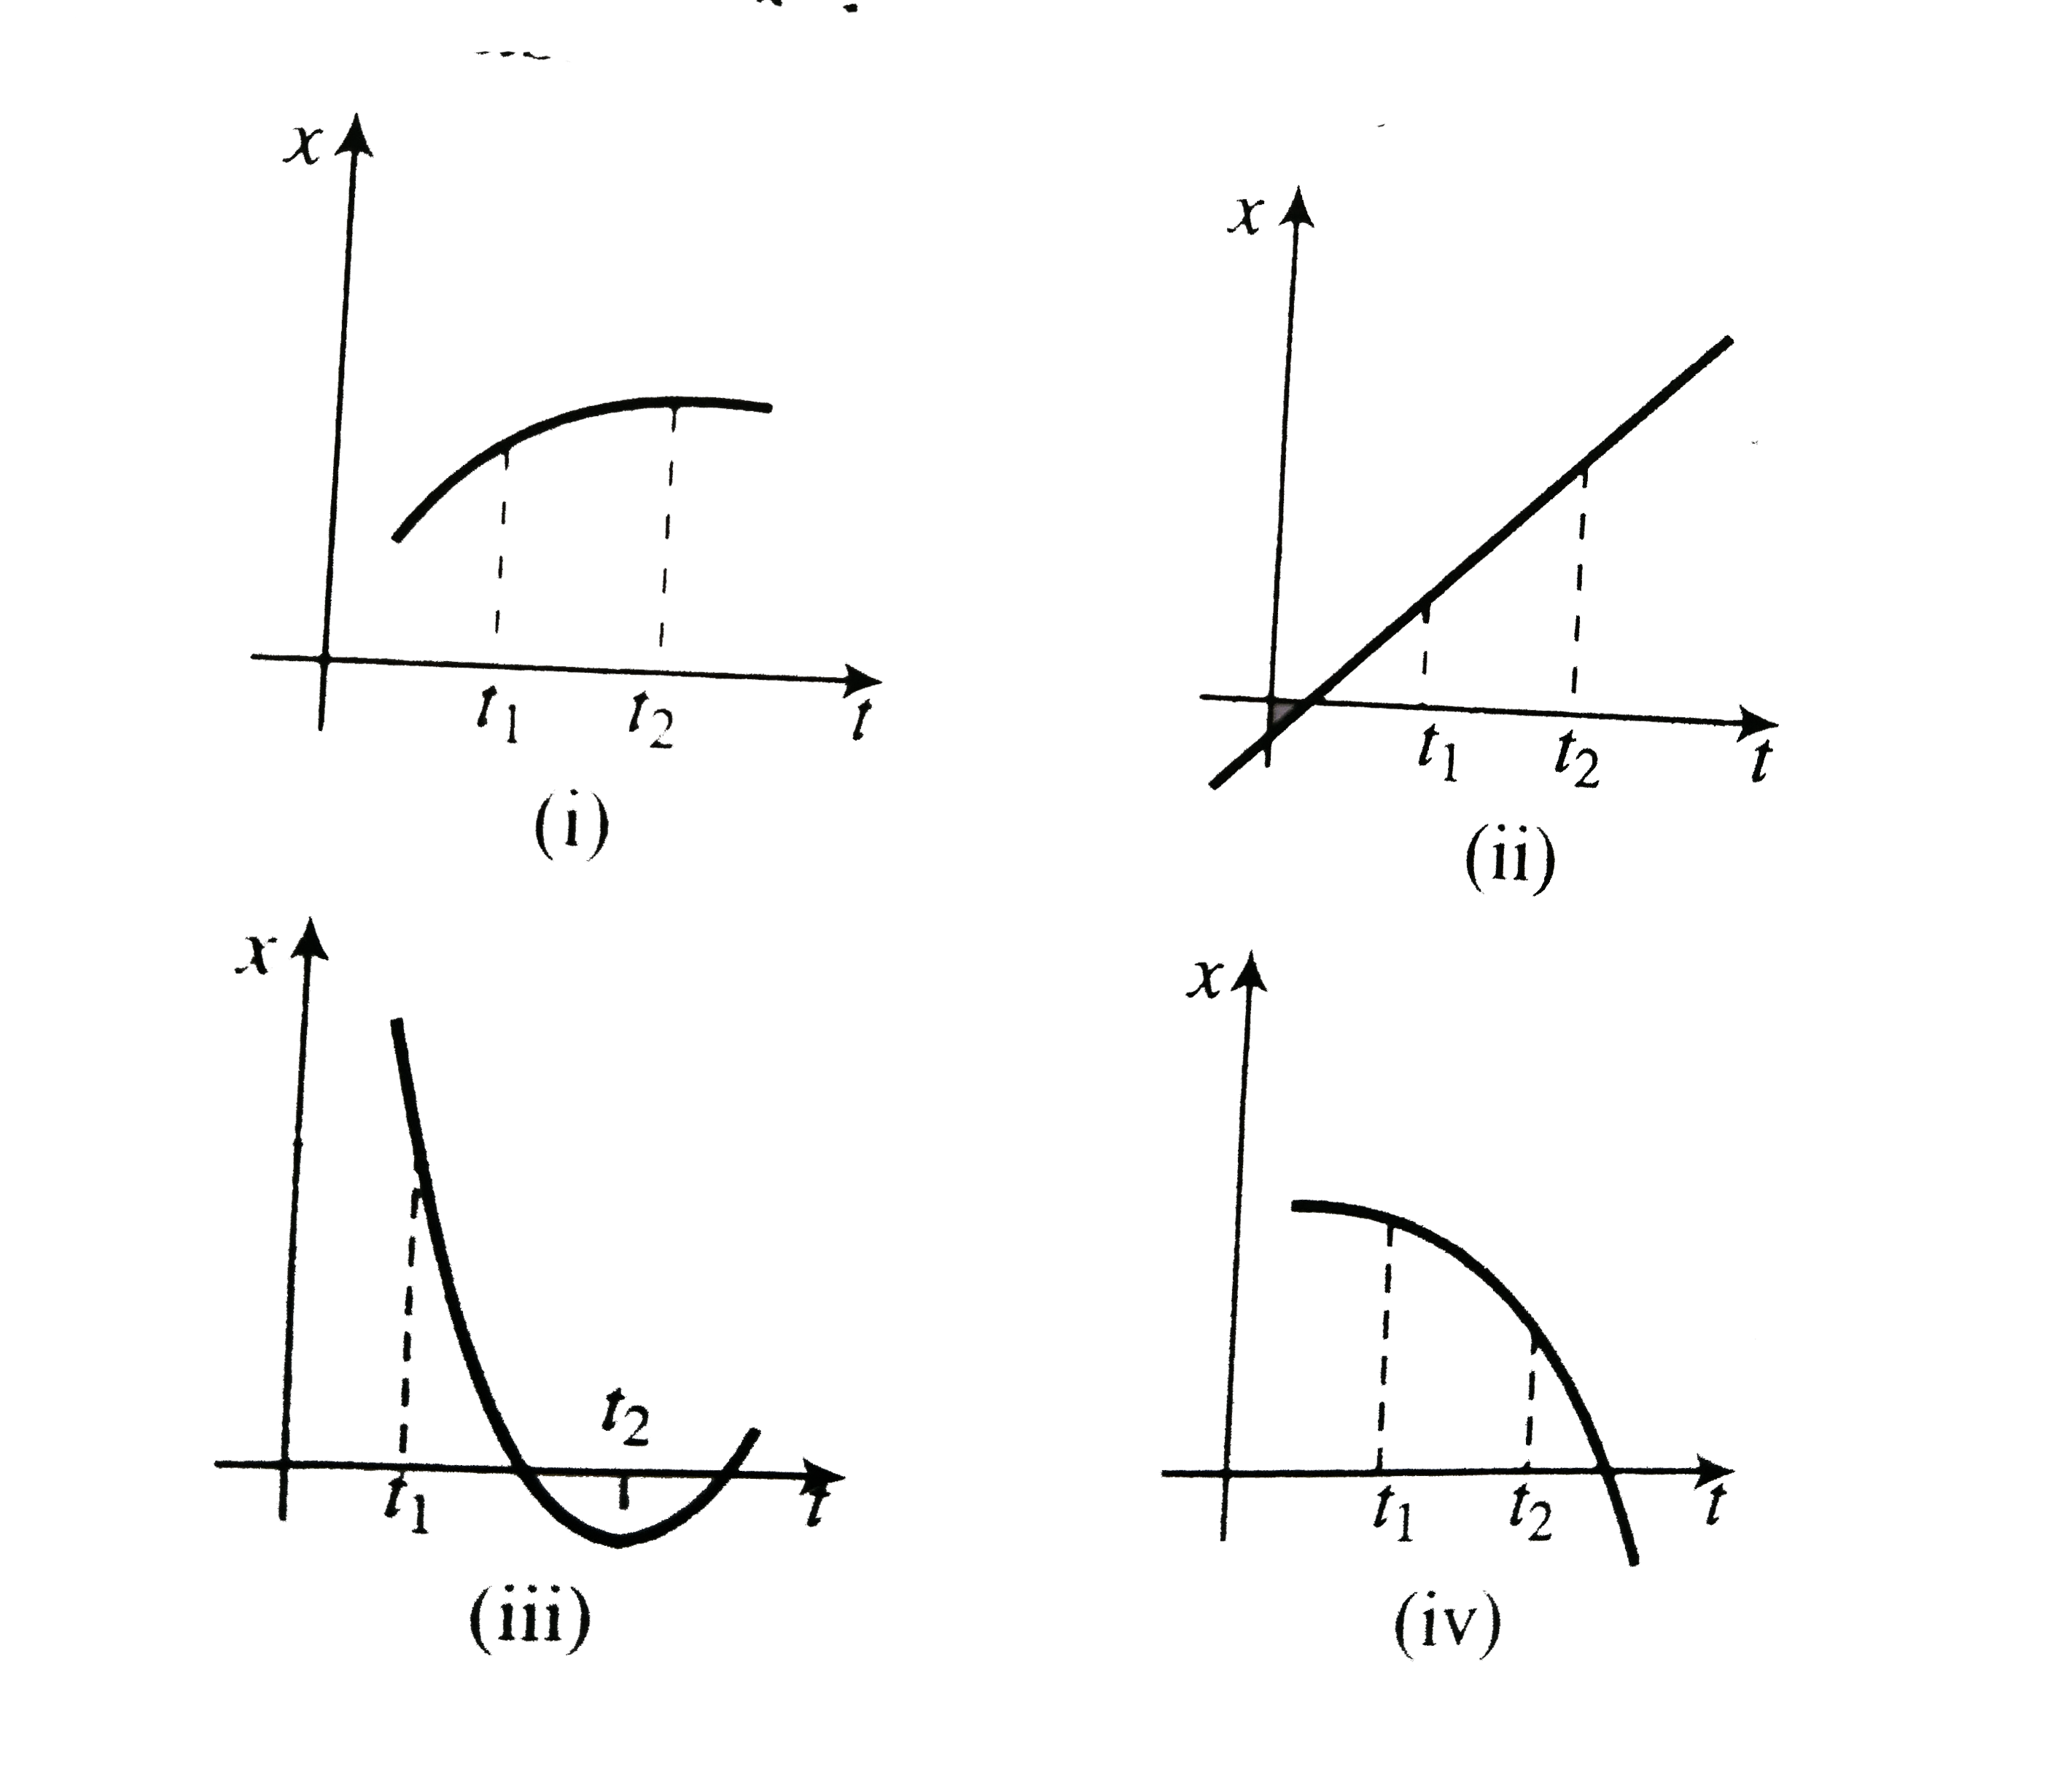
Acceleration of the particle is positive.
View Solution

