The following Bar Diagram depicts figures for some agricultural imports from January-May, 2008. Answer (as closely as possible) the questions using the date provided here

What is the average cost of potato import in February and March?
3960
5960
1280
4440
The correct Answer is:A
Step by step video, text & image solution for The following Bar Diagram depicts figures for some agricultural imports from January-May, 2008. Answer (as closely as possible) the questions using the date provided here What is the average cost of potato import in February and March? by Maths experts to help you in doubts & scoring excellent marks in Class 14 exams.
Updated on:21/07/2023Similar Questions
The following diagram depicts various views of a cube. Each faces has some number, where as in cube 4, one face is blank. From the answer choices select the number that should come in the blank space.
Question Figures

View SolutionRead the following bar graph and answer the questions for (Q.No−30→32)What is the income of the company between January and March? What is the profit percentage in the month of April?What is the ratio of the income to expenditure from January to June?
View Solution
Knowledge Check
The following Bar Diagram dpeicts figures for some agricultural imports from January-May, 2008. Answer (as closely as possible) the questions using the date provided here
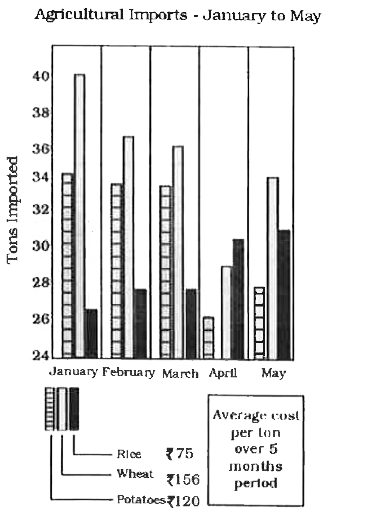
What was the total cost (in Rs) of wheat import in March?ARs 3,212BRs 5,616CRs 7,042DRs 2,224The following bar diagram, represents the use of different modes of travel to school by students in a certain locality of the town. Study the graph and answer the questions.
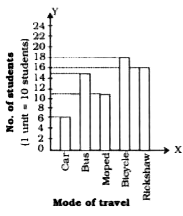
What is the percentage of students using Bus from that locality ?A221433%B1823%C22811%D0.22The bar graph shows the production of the different departments of a company. Study the diagram and answer the following questions.
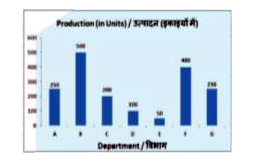
If the average cost a unit produced by department C is Rs 250 then what is the cost of the production (in Rs) of all units produced by department C?A50000B5000C250000D25000
The following bar-diagram shows total number of males and females in five different organisations. Study it carefully to answer the questions.
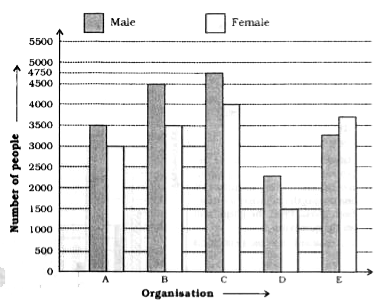
What is the ratio of average number of females from the organisations A, B and C to the average number of males from the organisations C, D and E?
View SolutionStudy the following bar graph showing the percentage of children who can read at first grade level, grouped by their grade level in an Indian state.
For example, in 2008, 82% of the children from Standard 3 could read a text from Standard 1. Now answer the following question based on this graph.
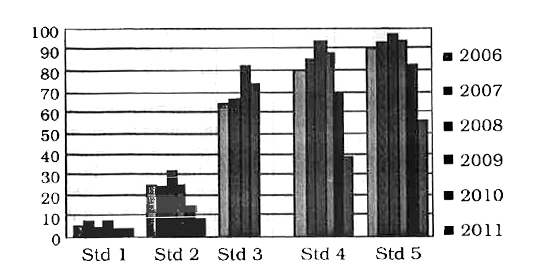
In the year 2010, what is the approximate value of average of all Std 1, 2, 3, 4, 5 children who could read the Std 1 text?
View SolutionDirections : Read the following passage carefully, and answer the questions given below it. Certain words are printed in bold to help you to locate them while answering some of the questions.
The income disparity in the new India is massive 36 billionaires in India and 800 million people living on less than $2 a day. The challenge for achieving inclusive growth relates to the revival of agriculture. Farming is becoming a non-viable activity. A confluence of factors, from poor rainfall to the new availability of consumer goods which consume much of Indians families' incomes, has driven many farmers into crushing debt. The agriculture sector has many problems with a growth rate of less than 2% in the last decade. Further scope for increase in net sown area is limited. Disparity in productivity across regions and crops has persisted. Far from benefiting from the economic boom many complain that banks don't offer the rural poor credit, forcing them to turn to greedy money-lenders, who typically charge up to 20% interest on a four-month loan Health care and education costs have risen dramatically, while the global price of cotton has become depressed, largely due to the billions of dollars in subsidies Washington hands out to U.S. farmers.
The approach to the revival of Indian agriculture seems to be incremental, rather than a holistic strategy. It is important to stress that growth and equity should be pursued simultaneously rather than following 'growth first and equity next' approach. What are the challenges for achieving 4% growth and equity in agriculture? Policy makes like the National commission on Farmers mention cost reduction in agriculture important to compete in a globalized world.
The most important problem for the farmers is output, price fluctuations. There is a big gap between producer prices and consumers prices. In order to protect, farmers from national and international price volatility, a price stabilization fund is needed. The supply and demand side constraints have to be removed to raise growth. The support systems have to be tuned to improve productivity and incomes of farmers with emphasis on small and marginal farmers and dry land areas.
One of the differences between the green revolution in the 1960s\70s and the present second green revolution is that risk is higher in the latter approach as it has to concentrate more on dry-land areas Trade liberalization has also raised the risk and uncertainty Thus, policies have to keep in mind the increasing risk in agriculture policies have to be gender sensitive too since the share of women is increasing The Government is aware that the crop sector may not be able to grow at 4% per annum but horticulture and allied activities like dairying, poultry and fisheries have to grow at the rate 6% to 7% to achieve 4% growth in agriculture. Investment in irrigation and rural infrastructure is important for agricultural growth. It is known that the requirements needed for achieving 4% minimum growth Bharat Programme is in the right direction but the progress has to be much faster.
How does the government plan to ensure 4% growth rate in agriculture?
View SolutionDirections : Read the following passage carefully, and answer the questions given below it. Certain words are printed in bold to help you to locate them while answering some of the questions.
The income disparity in the new India is massive 36 billionaires in India and 800 million people living on less than $2 a day. The challenge for achieving inclusive growth relates to the revival of agriculture. Farming is becoming a non-viable activity. A confluence of factors, from poor rainfall to the new availability of consumer goods which consume much of Indians families' incomes, has driven many farmers into crushing debt. The agriculture sector has many problems with a growth rate of less than 2% in the last decade. Further scope for increase in net sown area is limited. Disparity in productivity across regions and crops has persisted. Far from benefiting from the economic boom many complain that banks don't offer the rural poor credit, forcing them to turn to greedy money-lenders, who typically charge up to 20% interest on a four-month loan Health care and education costs have risen dramatically, while the global price of cotton has become depressed, largely due to the billions of dollars in subsidies Washington hands out to U.S. farmers.
The approach to the revival of Indian agriculture seems to be incremental, rather than a holistic strategy. It is important to stress that growth and equity should be pursued simultaneously rather than following 'growth first and equity next' approach. What are the challenges for achieving 4% growth and equity in agriculture? Policy makes like the National commission on Farmers mention cost reduction in agriculture important to compete in a globalized world.
The most important problem for the farmers is output, price fluctuations. There is a big gap between producer prices and consumers prices. In order to protect, farmers from national and international price volatility, a price stabilization fund is needed. The supply and demand side constraints have to be removed to raise growth. The support systems have to be tuned to improve productivity and incomes of farmers with emphasis on small and marginal farmers and dry land areas.
One of the differences between the green revolution in the 1960s\70s and the present second green revolution is that risk is higher in the latter approach as it has to concentrate more on dry-land areas Trade liberalization has also raised the risk and uncertainty Thus, policies have to keep in mind the increasing risk in agriculture policies have to be gender sensitive too since the share of women is increasing The Government is aware that the crop sector may not be able to grow at 4% per annum but horticulture and allied activities like dairying, poultry and fisheries have to grow at the rate 6% to 7% to achieve 4% growth in agriculture. Investment in irrigation and rural infrastructure is important for agricultural growth. It is known that the requirements needed for achieving 4% minimum growth Bharat Programme is in the right direction but the progress has to be much faster.
Which is the following is not a means to achieve 4% agriculture growth rate?
View SolutionDirections : Read the following passage carefully, and answer the questions given below it. Certain words are printed in bold to help you to locate them while answering some of the questions.
The income disparity in the new India is massive 36 billionaires in India and 800 million people living on less than $2 a day. The challenge for achieving inclusive growth relates to the revival of agriculture. Farming is becoming a non-viable activity. A confluence of factors, from poor rainfall to the new availability of consumer goods which consume much of Indians families' incomes, has driven many farmers into crushing debt. The agriculture sector has many problems with a growth rate of less than 2% in the last decade. Further scope for increase in net sown area is limited. Disparity in productivity across regions and crops has persisted. Far from benefiting from the economic boom many complain that banks don't offer the rural poor credit, forcing them to turn to greedy money-lenders, who typically charge up to 20% interest on a four-month loan Health care and education costs have risen dramatically, while the global price of cotton has become depressed, largely due to the billions of dollars in subsidies Washington hands out to U.S. farmers.
The approach to the revival of Indian agriculture seems to be incremental, rather than a holistic strategy. It is important to stress that growth and equity should be pursued simultaneously rather than following 'growth first and equity next' approach. What are the challenges for achieving 4% growth and equity in agriculture? Policy makes like the National commission on Farmers mention cost reduction in agriculture important to compete in a globalized world.
The most important problem for the farmers is output, price fluctuations. There is a big gap between producer prices and consumers prices. In order to protect, farmers from national and international price volatility, a price stabilization fund is needed. The supply and demand side constraints have to be removed to raise growth. The support systems have to be tuned to improve productivity and incomes of farmers with emphasis on small and marginal farmers and dry land areas.
One of the differences between the green revolution in the 1960s\70s and the present second green revolution is that risk is higher in the latter approach as it has to concentrate more on dry-land areas Trade liberalization has also raised the risk and uncertainty Thus, policies have to keep in mind the increasing risk in agriculture policies have to be gender sensitive too since the share of women is increasing The Government is aware that the crop sector may not be able to grow at 4% per annum but horticulture and allied activities like dairying, poultry and fisheries have to grow at the rate 6% to 7% to achieve 4% growth in agriculture. Investment in irrigation and rural infrastructure is important for agricultural growth. It is known that the requirements needed for achieving 4% minimum growth Bharat Programme is in the right direction but the progress has to be much faster.
Which of the following is not true in the context of the passage?
View Solution
