The given double column graph compares the average number of hours for which an electrical appliance is used on weekdays and weekends .Study the graph carefully and answer the questions that follows .
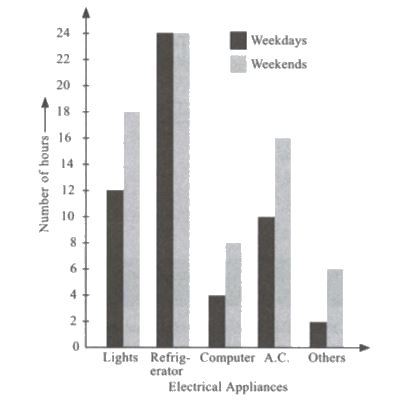
Which appliance is used half as many hours on the weekdays as it used on the weekends?
Lights
Refrigerator
Computer
A.C
The correct Answer is:C
Step by step video, text & image solution for The given double column graph compares the average number of hours for which an electrical appliance is used on weekdays and weekends .Study the graph carefully and answer the questions that follows . Which appliance is used half as many hours on the weekdays as it used on the weekends? by Maths experts to help you in doubts & scoring excellent marks in Class 8 exams.
Updated on:21/07/2023Topper's Solved these Questions
- IMO QUESTION PAPER 2017-18 SET-BBOOK - SCIENCE OLYMPIAD FOUNDATION CHAPTER - IMO QUESTION PAPER 2017-18 SET-BEXERCISE - ACHIEVERS SECTION
5 Videos
- IMO QUESTION PAPER 2017-18 SET ABOOK - SCIENCE OLYMPIAD FOUNDATION CHAPTER - IMO QUESTION PAPER 2017-18 SET AEXERCISE - ACHIEVERS SECTION
5 Videos
- IMO QUESTION PAPER 2018-19 SET -B BOOK - SCIENCE OLYMPIAD FOUNDATION CHAPTER - IMO QUESTION PAPER 2018-19 SET -B EXERCISE - ACHIEVERS SECTION
5 Videos
Similar Questions
Study the following graph carefully and answer the given questions.
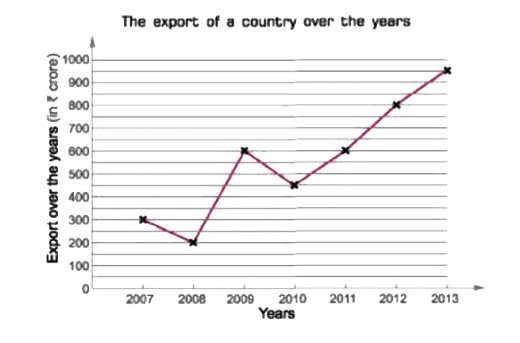
What is the total exports ( in ? Crore) for the given years ?
View SolutionStudy the following graph carefully and answer the questions that follow
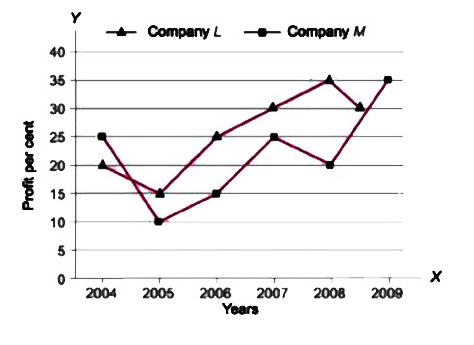
Which of the following statements is true with respect to the above graph ?
View Solution
Knowledge Check
Study the graph carefully and answer the following questions.
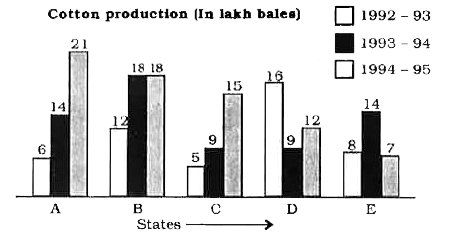
Which of the following statement is false ?AState A and E showed the same production in 1993-94.BThere was no improvement in the production of cotton in state B during 1994-95.CState A has produced maximum cotton during the given period.DProduction of state C and D together is equal to that of state B dring 1993-94.Study the following graph carefully and answer the questions that
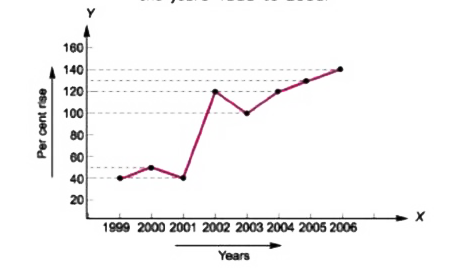
For how many years , the percent rise was more than 100 % ?AOneBTwoCThreeDNone of these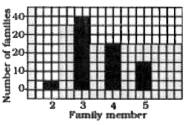
Study the bar graph carefully and answer the following question.
Which type if family is the most common ?A2 membersB3 membersC4 membersD5 members
Study the following graph carefully and answer the questions that
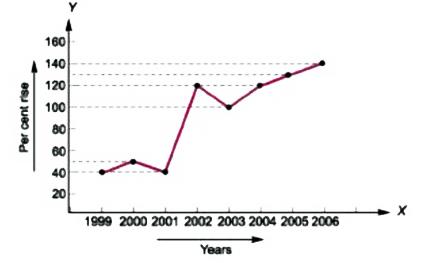
What was the average of percent rise over the given years ?
View SolutionStudy the following graph carefully and answer the questions that follow
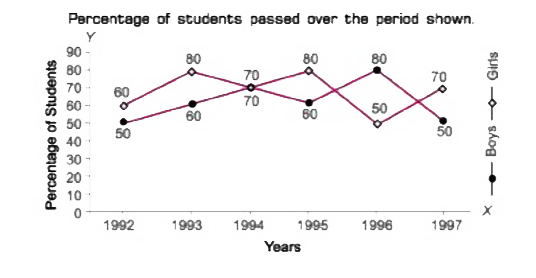
What is the ratio of the average of failed girls and that of failed boys ?
View SolutionStudy the following graph carefully and answer the questions that follow
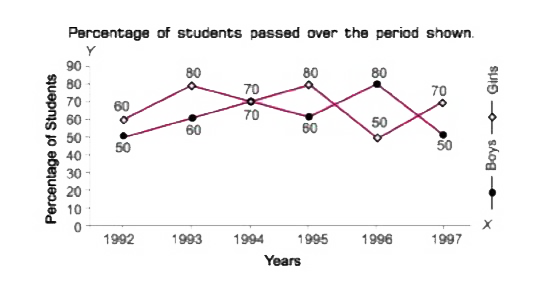
For how many times was the gap constant for the percentage of successful boys and girls ?
View SolutionStudy the following graph carefully and answer the questions that follow
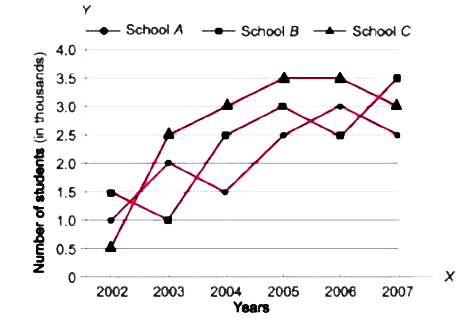
What was the average number of students in all schools together in the year 2006 ?
View SolutionStudy the following graph carefully to answer the questions that follow-----
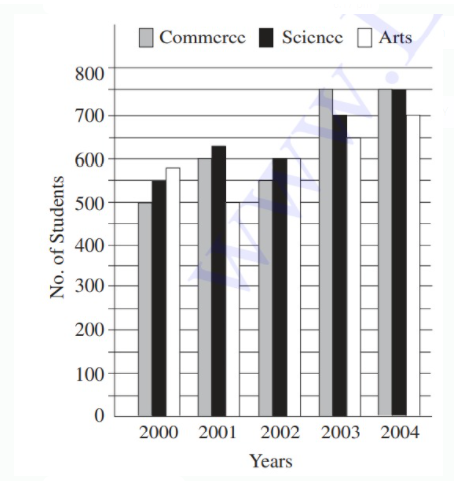
What is the total number of students studying Arts in all the years together ?
View Solution
