Study the given double bar graph which shows the number of copies of newspapers sold by The Hindu and Economic Times from 2015 to 2018 and answer the following questions.
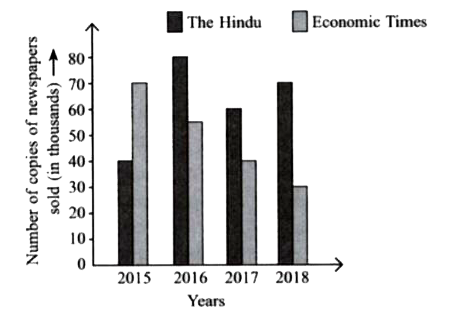
What is the ratio of newspapers sold in year 2016 and 2017 together to the total number of newspapers sold in 2018?
47:20
35:19
17:24
20:37
The correct Answer is:A
Step by step video, text & image solution for Study the given double bar graph which shows the number of copies of newspapers sold by The Hindu and Economic Times from 2015 to 2018 and answer the following questions. What is the ratio of newspapers sold in year 2016 and 2017 together to the total number of newspapers sold in 2018? by Maths experts to help you in doubts & scoring excellent marks in Class 7 exams.
Updated on:21/07/2023Topper's Solved these Questions
- IMO QUESTION PAPER 2018-19 SET - BBOOK - SCIENCE OLYMPIAD FOUNDATION CHAPTER - IMO QUESTION PAPER 2018-19 SET - BEXERCISE - EVERYDAY MATHEMATICS
10 Videos
- IMO QUESTION PAPER 2018-19 SET - BBOOK - SCIENCE OLYMPIAD FOUNDATION CHAPTER - IMO QUESTION PAPER 2018-19 SET - BEXERCISE - ACHIEVERS SECTION
5 Videos
- IMO QUESTION PAPER 2017-18 SET ABOOK - SCIENCE OLYMPIAD FOUNDATION CHAPTER - IMO QUESTION PAPER 2017-18 SET AEXERCISE - ACHIEVERS SECTION
5 Videos
- IMO QUESTION PAPER 2018-19 SET ABOOK - SCIENCE OLYMPIAD FOUNDATION CHAPTER - IMO QUESTION PAPER 2018-19 SET AEXERCISE - Logical Reasoning
20 Videos
Similar Questions
The bar graph shows the number of cars of different brands sold by a dealer in a month. Study the diagram and answer the following question.
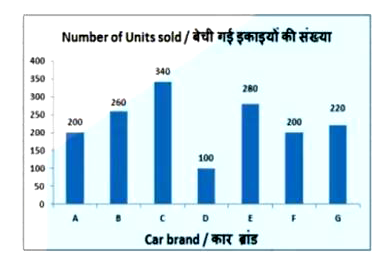
What is the ratio of units sold of brand G to that of brand E?
View SolutionThe bar graph shows the number of motorcycles of different brands sold by a dealer in a month . Study the diagram and answer the following questions .
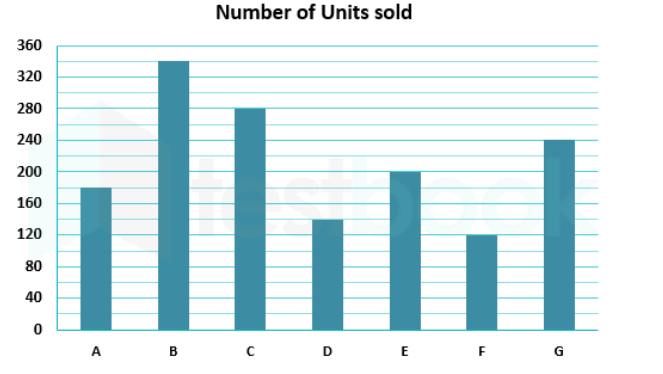
What is the ratio of units sold of brand A to that of brand C?
View Solution
Knowledge Check
Study the graph carefully and answer the following questions.
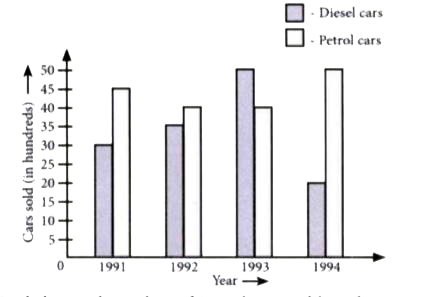
Find the total number of Diesel cars sold in the year 1992 and 1994 together.A2500B5500C1500D4500Study the given graph and answer the question that follows.
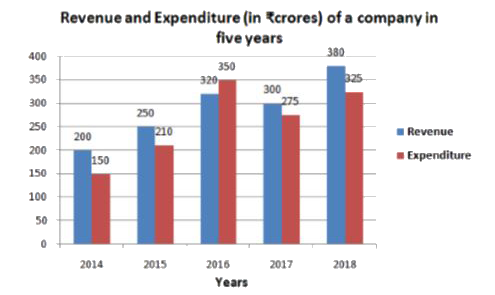
What is the ratio of the total expenditure in 2015 and 2016 to the total revenue of the company in 2016 and 2018?Aa) 4 : 5Bb) 19 : 20Cc) 6 : 7Dd)0.47222222222222
Direction: The given bar graph shows the number of pens sold by two shops A & B in four consecutive months. Study the following data and answer the following questions:
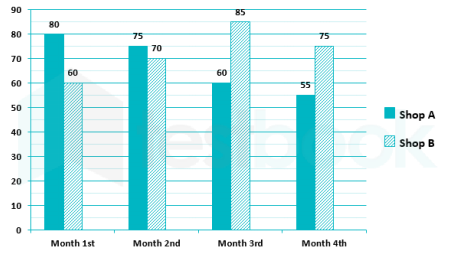
Find the ratio of the number of pens sold by shop A in months 1st and 3rd together to the number of pens sold by shop B in months 2nd and 4th together.
View SolutionDirection: The given bar graph shows the number of pens sold by two shops A & B in four consecutive months. Study the following data and answer the following questions:
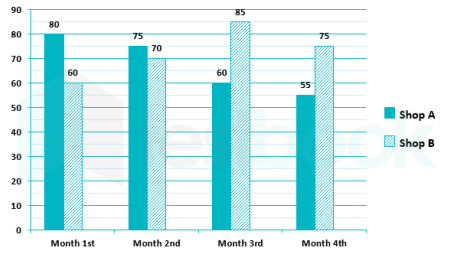
Find the ratio of the number of pens sold by shop A in 1st month to the number of pens sold by B in 3rd month.
View SolutionRead the bar graph which shows the number of books sold by a bookstore during five consecutive years and answer the following questions
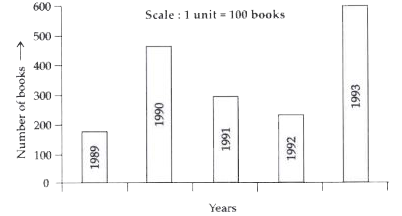
In which years were fewer than 200 books sold ?
View SolutionThe bar graph shows the number of cars of different brands sold by a dealer in a month. Study the diagram and answer the following question.
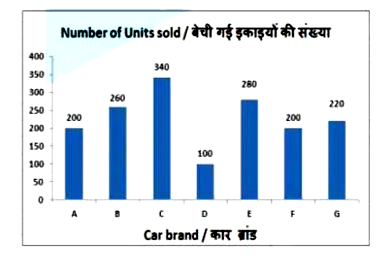
Units sold of which car brand were the second highest?
View SolutionStudy the given graph and answer the question that follows
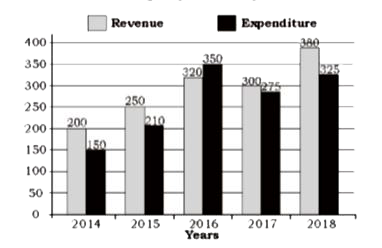
What is the ratio of the total expenditure in 2015 and 2016 to the total revenue of the company in 2016 and 2018?
View SolutionThe bar graph given below represents the circulation of newspapers in different languages in a town. Study the bar graph and answer the following questions:
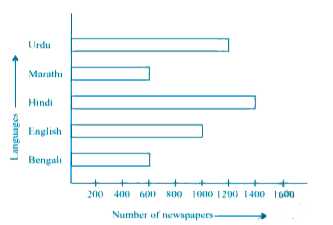
What is the circulation of English newspaper?
View Solution
