The given graph shows the changes in the volume of the lungs of a person at rest over a period of 20 seconds.
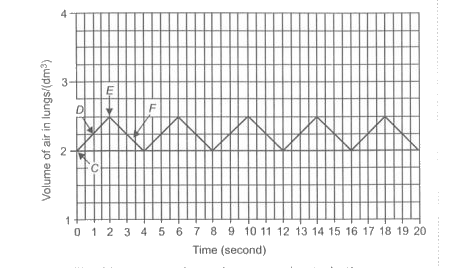
(i) How many breaths per minute is the person taking when at rest?
(ii) Which labels (C, D, E or F) in the given graph show inspiration and expiration respectively?
(i)(ii)5D,E
(i)(ii)15D,F
(i)(ii)15C,D
(i)(ii)20E,F
The correct Answer is:B
(i) It is clear from the given graph that the person is taking 5 breaths per 20 sec.
So in 1 minute (60 sec) the person will take
=(520×60) breaths = 15 breaths.
(ii) Line .D. shows gradual increase in the volume of lungs, thus it indicates inspiration while line .F. shows gradual decrease in the volume of lungs, thus it indicates expiration.
Topper's Solved these Questions
- LIFE PROCESSESBook:SCIENCE OLYMPIAD FOUNDATION Chapter:LIFE PROCESSESExercise:ACHIEVERS SECTION (HOTS)
Explore 5 Videos
- HEREDITY AND EVOLUTIONBook:SCIENCE OLYMPIAD FOUNDATION Chapter:HEREDITY AND EVOLUTIONExercise:ACHIEVERS SECTION (HOTS)
Explore 5 Videos
- NSO QUESTION PAPER 2016 SET ABook:SCIENCE OLYMPIAD FOUNDATION Chapter:NSO QUESTION PAPER 2016 SET AExercise:Achievers Section
Explore 2 Videos
Similar Questions
The following line graph shows the change in temperature of a block of ice when heated.
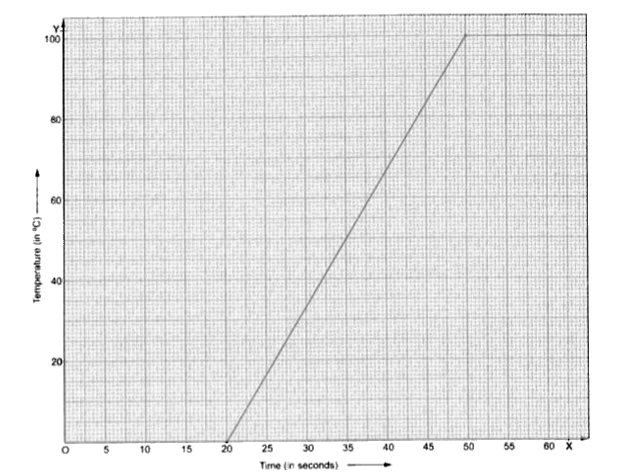
Study the above graph carefully and answer the questions given below :
(i) For how many seconds did the ice block have no change in temperature?
(ii) For how long was there a change in temperature?
(iii) After how many seconds of heating did the temperature become constant at 100∘C ?
(iv) What was the temperature after 25 seconds?
(v) What will be the temperature after 1.5 minutes ? Justify your answer.
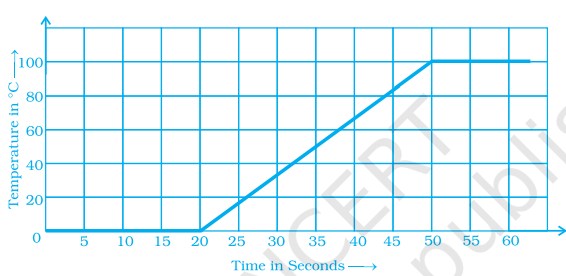
View SolutionThe following graph shows the change in temperature of a block of ice when heated. Use the graph to answer the following questions:
(a) For how many seconds did the ice block have no change in temperature?
(b) For how long was there a change in temperature?
(c) After how many seconds of heating did the temperature become constant at 0∘C?
(d) What was the temperature after 25 seconds?
(e) What will be the temperature after 1.5 minutes? Justify your answer.
View Solution
Knowledge Check
The Bar Graph shows the production and sales of Mobile handsets of various campanies A,B,C,D,E & F in a month.
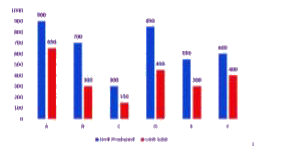
Which Company had the highest percentage of sale with respect to its production?AABDCEDBStudy the following graph which shows income and expenditure of a company over the years 2005 - 2009 and answer the questions.
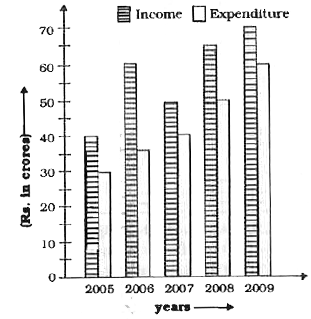
In how many years was the income of the company less than the average income of the given years ?A4B3C2D1The following bar graph shows infomiation on the sales of the personal computers by the company "XYZ" for the last 10 year?
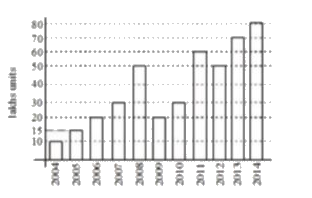
How many units of personal computers were sold by the company XYZ in 2011?
(a)60
(b)50
(c)80
(d)70A60B50C80D70
The bar-graph given below shows the runs scored in six overs by a batsman.
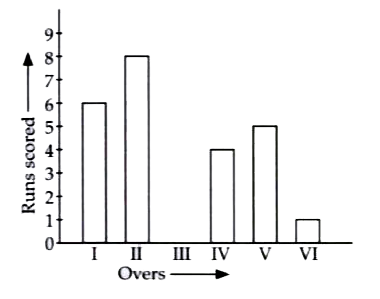
How many more runs were scored in the second over than in fourth over?
View SolutionDirection: Study the following information carefully and answer the given questions. The table shows the total number of invited person and the percentage of person who attended the events (A, B, C, D, E) respectively.
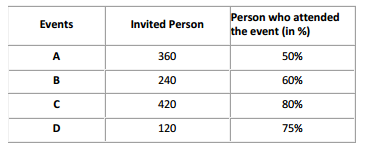
Find the percentage of persons who attended the event A is how much more than the number of persons who attended the event D.
View SolutionA courter-person cycles from a town to a neighbouring suburban area to deliver a parcel to a merchant. His distances from the twon at different times are shown by the given graph.
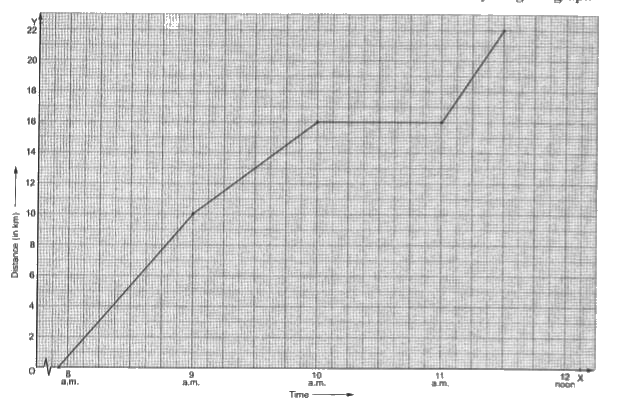
Study the above graph carefully and answer the questions given below:
(i) What is the scale taken for the time-axis?
(ii) How much time did the person take for the travel ?
(iii) How far is the place of the merchant from the town ?
(iv) Did the person stop on his way ? Explain.
(v) During which period did he ride fastest ?
View SolutionThe bar-graph given below shows the runs scored in six overs by a batsman.
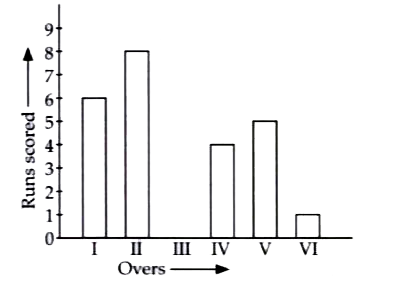
How many overs were there in which less than 3 runs were scored?
View SolutionThe graph given alongside shows how the speed of a car changes with time :
(i) What is the initial speed of the car ? ltBrgt (ii) What is the maximum speed attained by the car ? ltBrgt (iii) Which part of the graph shows zero acceleration ? ltBrgt (iv) Which part of the graph shows varying retardation ?
(v) Find the distance travelled in first 8 hours.
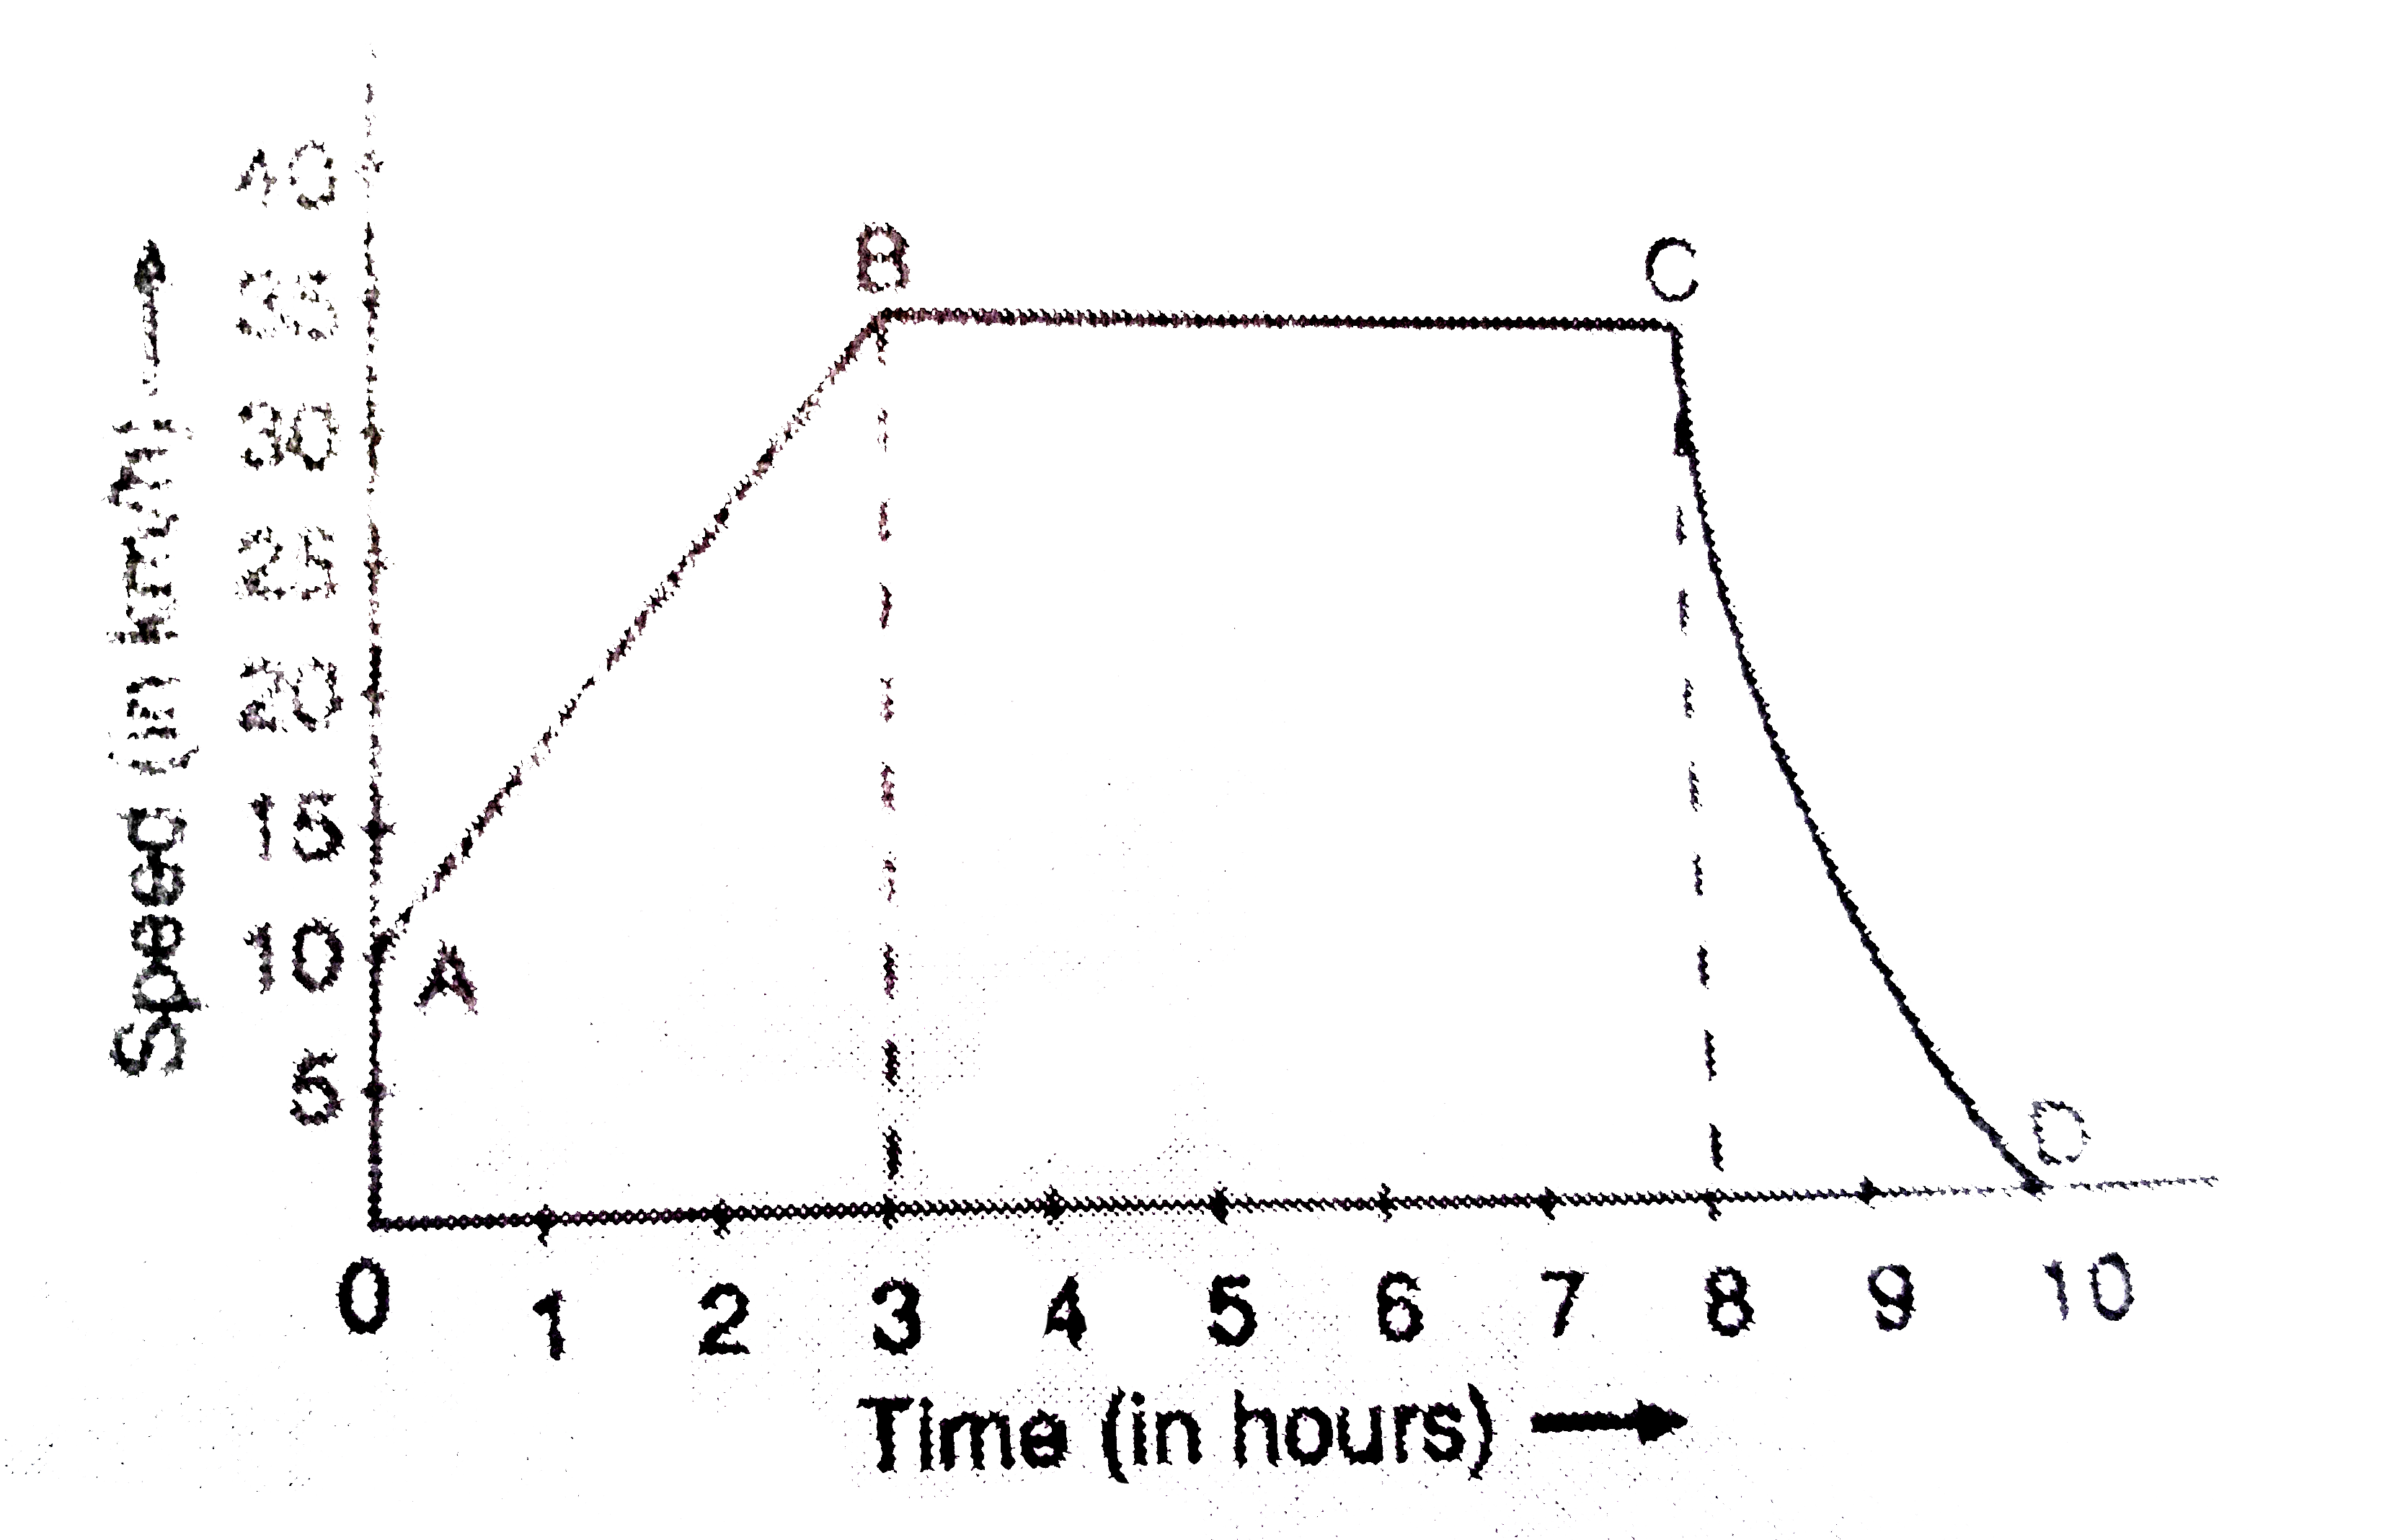
View Solution

