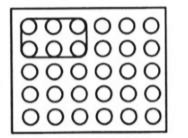
The diagram here shows a nail board.
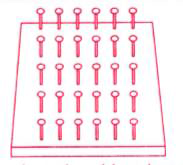
Using the board, rubber bands were stretched over the nails to form different shapes as shown here. Which of the figure shown in options requires the most force to create ?
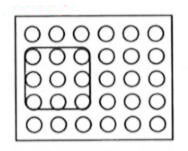
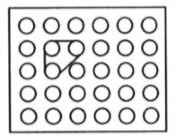
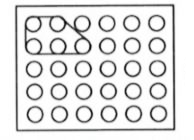
The correct Answer is:A
Figure in option (A) has the biggest area, so needs maximum force for stretching.
Topper's Solved these Questions
Similar Questions
As shown in the schematic below, a rod of uniform cross-sectional area A and length l is carrying a constant current I through it and voltage across the rod is measured using an ideal voltmeter. The rod is stretched by the appliction of a force F. Which of the following graphs would show tha variation in the voltage across the rod as Junction of the strain,ε, when the strain is small. Neglect Joule heating.

View Solution_S01_066_Q01.png)
The diagram shows a force extension graph for a rubber band, consider the following statements
(I). It will be easier to compress this rubber than expand it.
(II). Rubber does not return to its original length after it is stretched.
(III). The rubber band will get heated if it is stretched and released.
Which of these can deduced from the graph-
(a). III only
(b). II and III
(c). I and III
(d). I only
View Solution
Knowledge Check
An ideal gas is undergoing a cyclic thermodynamic process in different ways as shown in the corresponding P-V diagrams in column 3 of the table. Consider only the path from state 1 to state 2. W denotes the corresponding work done on the system. The equations and plots in the table have standard notations as used in thermodynamic process. Here is the ratio of heat capacities at constant pressure and constant volume. The number of moles in the gas in n.
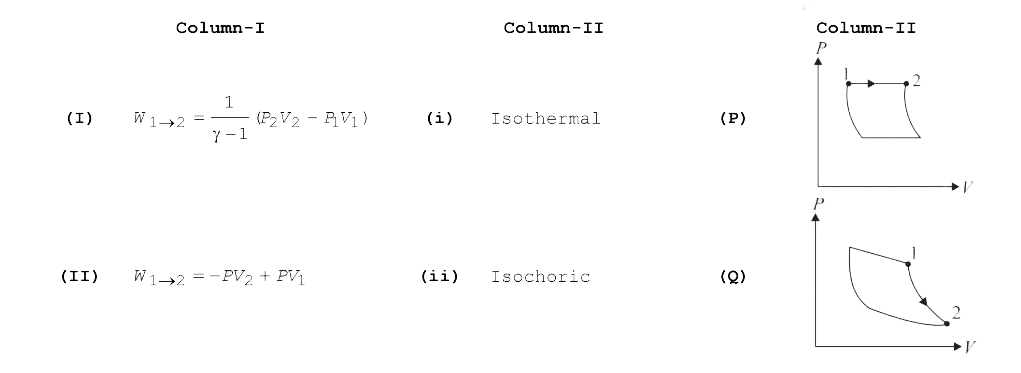

Which of the following options is the only correct representation of a process in which ΔU=ΔQ−PΔV?A(II) (iv) (R)B(III) (iii) (P)C(II) (iii) (P)D(II) (iii) (S)An ideal gas is undergoing a cyclic thermodynamic process in different ways as shown in the corresponding P-V diagrams in column 3 of the table. Consider only the path from state 1 to state 2. W denotes the corresponding work done on the system. The equations and plots in the table have standard notations as used in thermodynamic process. Here is the ratio of heat capacities at constant pressure and constant volume. The number of moles in the gas in n.


Which of the following options is the only correct representation of a process in which ΔU=ΔQ−PΔV?A(IV) (ii) (S)B(III) (ii) (S)C(II) (iv) (R)D(II) (iv) (P)Two strings, A and B, of lengths 4L and L respectively and same mass M each, are tied together to form a knot 'O' and stretched under the same tension. A transverse wave puise is sent along the composite string from the side A, as shown to the right. Which of the following diagrams correctly shows the reflected and transmitted waves pulses near the knot 'O' ?
_S01_011_Q01.png) A
A_S01_011_O01.png) B
B_S01_011_O02.png) C
C_S01_011_O03.png) D
D_S01_011_O04.png)
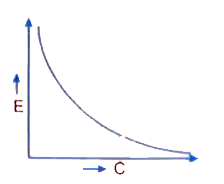
The graph shown here figure, shows the variation of the total energy (E) stored in a capacitor against the value of the capacitance (C) itself. Which of the two - the charge on the capacitor or the potential used to 4 charge it is kept constant for this graph ?
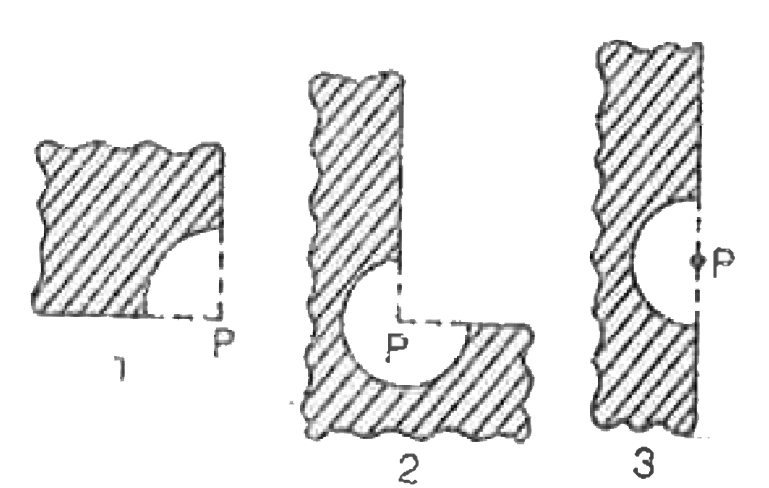
View SolutionA plane monochromatic light wave of intensity I0 falls normally on the surfaces of the opaque screens which are shaped as shown in the figure here. The shaped as shown in the gigure here. The rounded-off edge coinicides with the boundary of the first Fresnel zone. Find the intensity of the screens at a point located behind the point P.
View SolutionIna recent report, the gross enrolment ratios at the primary level, that is the number of children enrolled in classes one to five as a proportion of all children aged 6 to 10, were shown to be very high for most stages, in many cased they were may above 100 percent. These figures are not worth anything, since they are based on the official enrolment data compiled from school records. They might as well stand for 'gross exaggeration ratios'.
Which one of the following options best supports the claim that the ratios are exaggerated ?
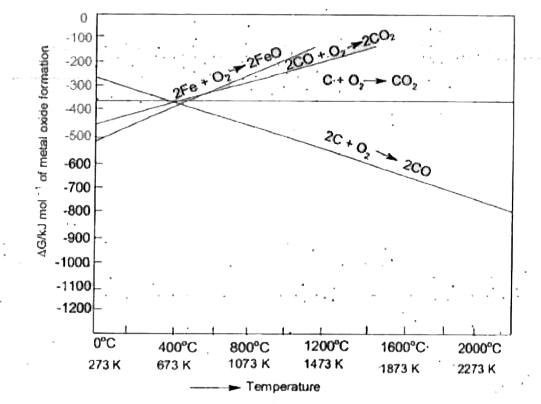
View SolutionMetals are extracted from their ores by a wide variety of techniques. The most common ores are oxides. Most metals are obtained by direct treatment of theirs ores with chemical agents, but the extraction of certain others require electrolysis. An example of the former type of process is the extraction of iron from its oxide, described by the following equation :
Fe2O3+3C→2Fe+3CO
The relative ease of extraction of a metal from its oxide can be estimated using the Ellingham diagram, as shown in the figure.
The diagram plots the free energies of formation of various oxides per mole of consumed oxygen as a function of absolute temperature.
All of the following reagents could be used to extract lead from its oxide except
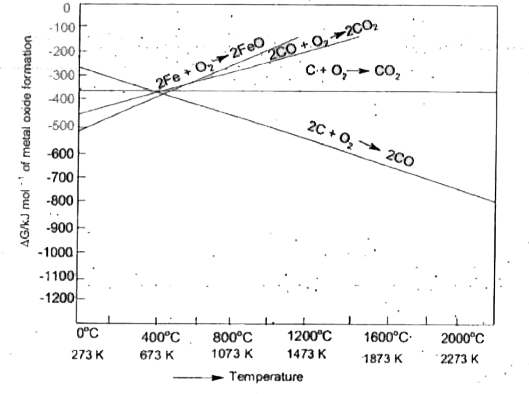
View SolutionMetals are extracted from their ores by a wide variety of techniques. The most common ores are oxides. Most metals are obtained by direct treatment of theirs ores with chemical agents, but the extraction of certain others require electrolysis. An example of the former type of process is the extraction of iron from its oxide, described by the following equation :
Fe2O3+3C→2Fe+3CO
The relative ease of extraction of a metal from its oxide can be estimated using the Ellingham diagram, as shown in the figure.
The diagram plots the free energies of formation of various oxides per mole of consumed oxygen as a function of absolute temperature.
Which of the following best explains why the free energy of formation of Fe2O3 becomes less negative as the temperature is increased.
View Solution