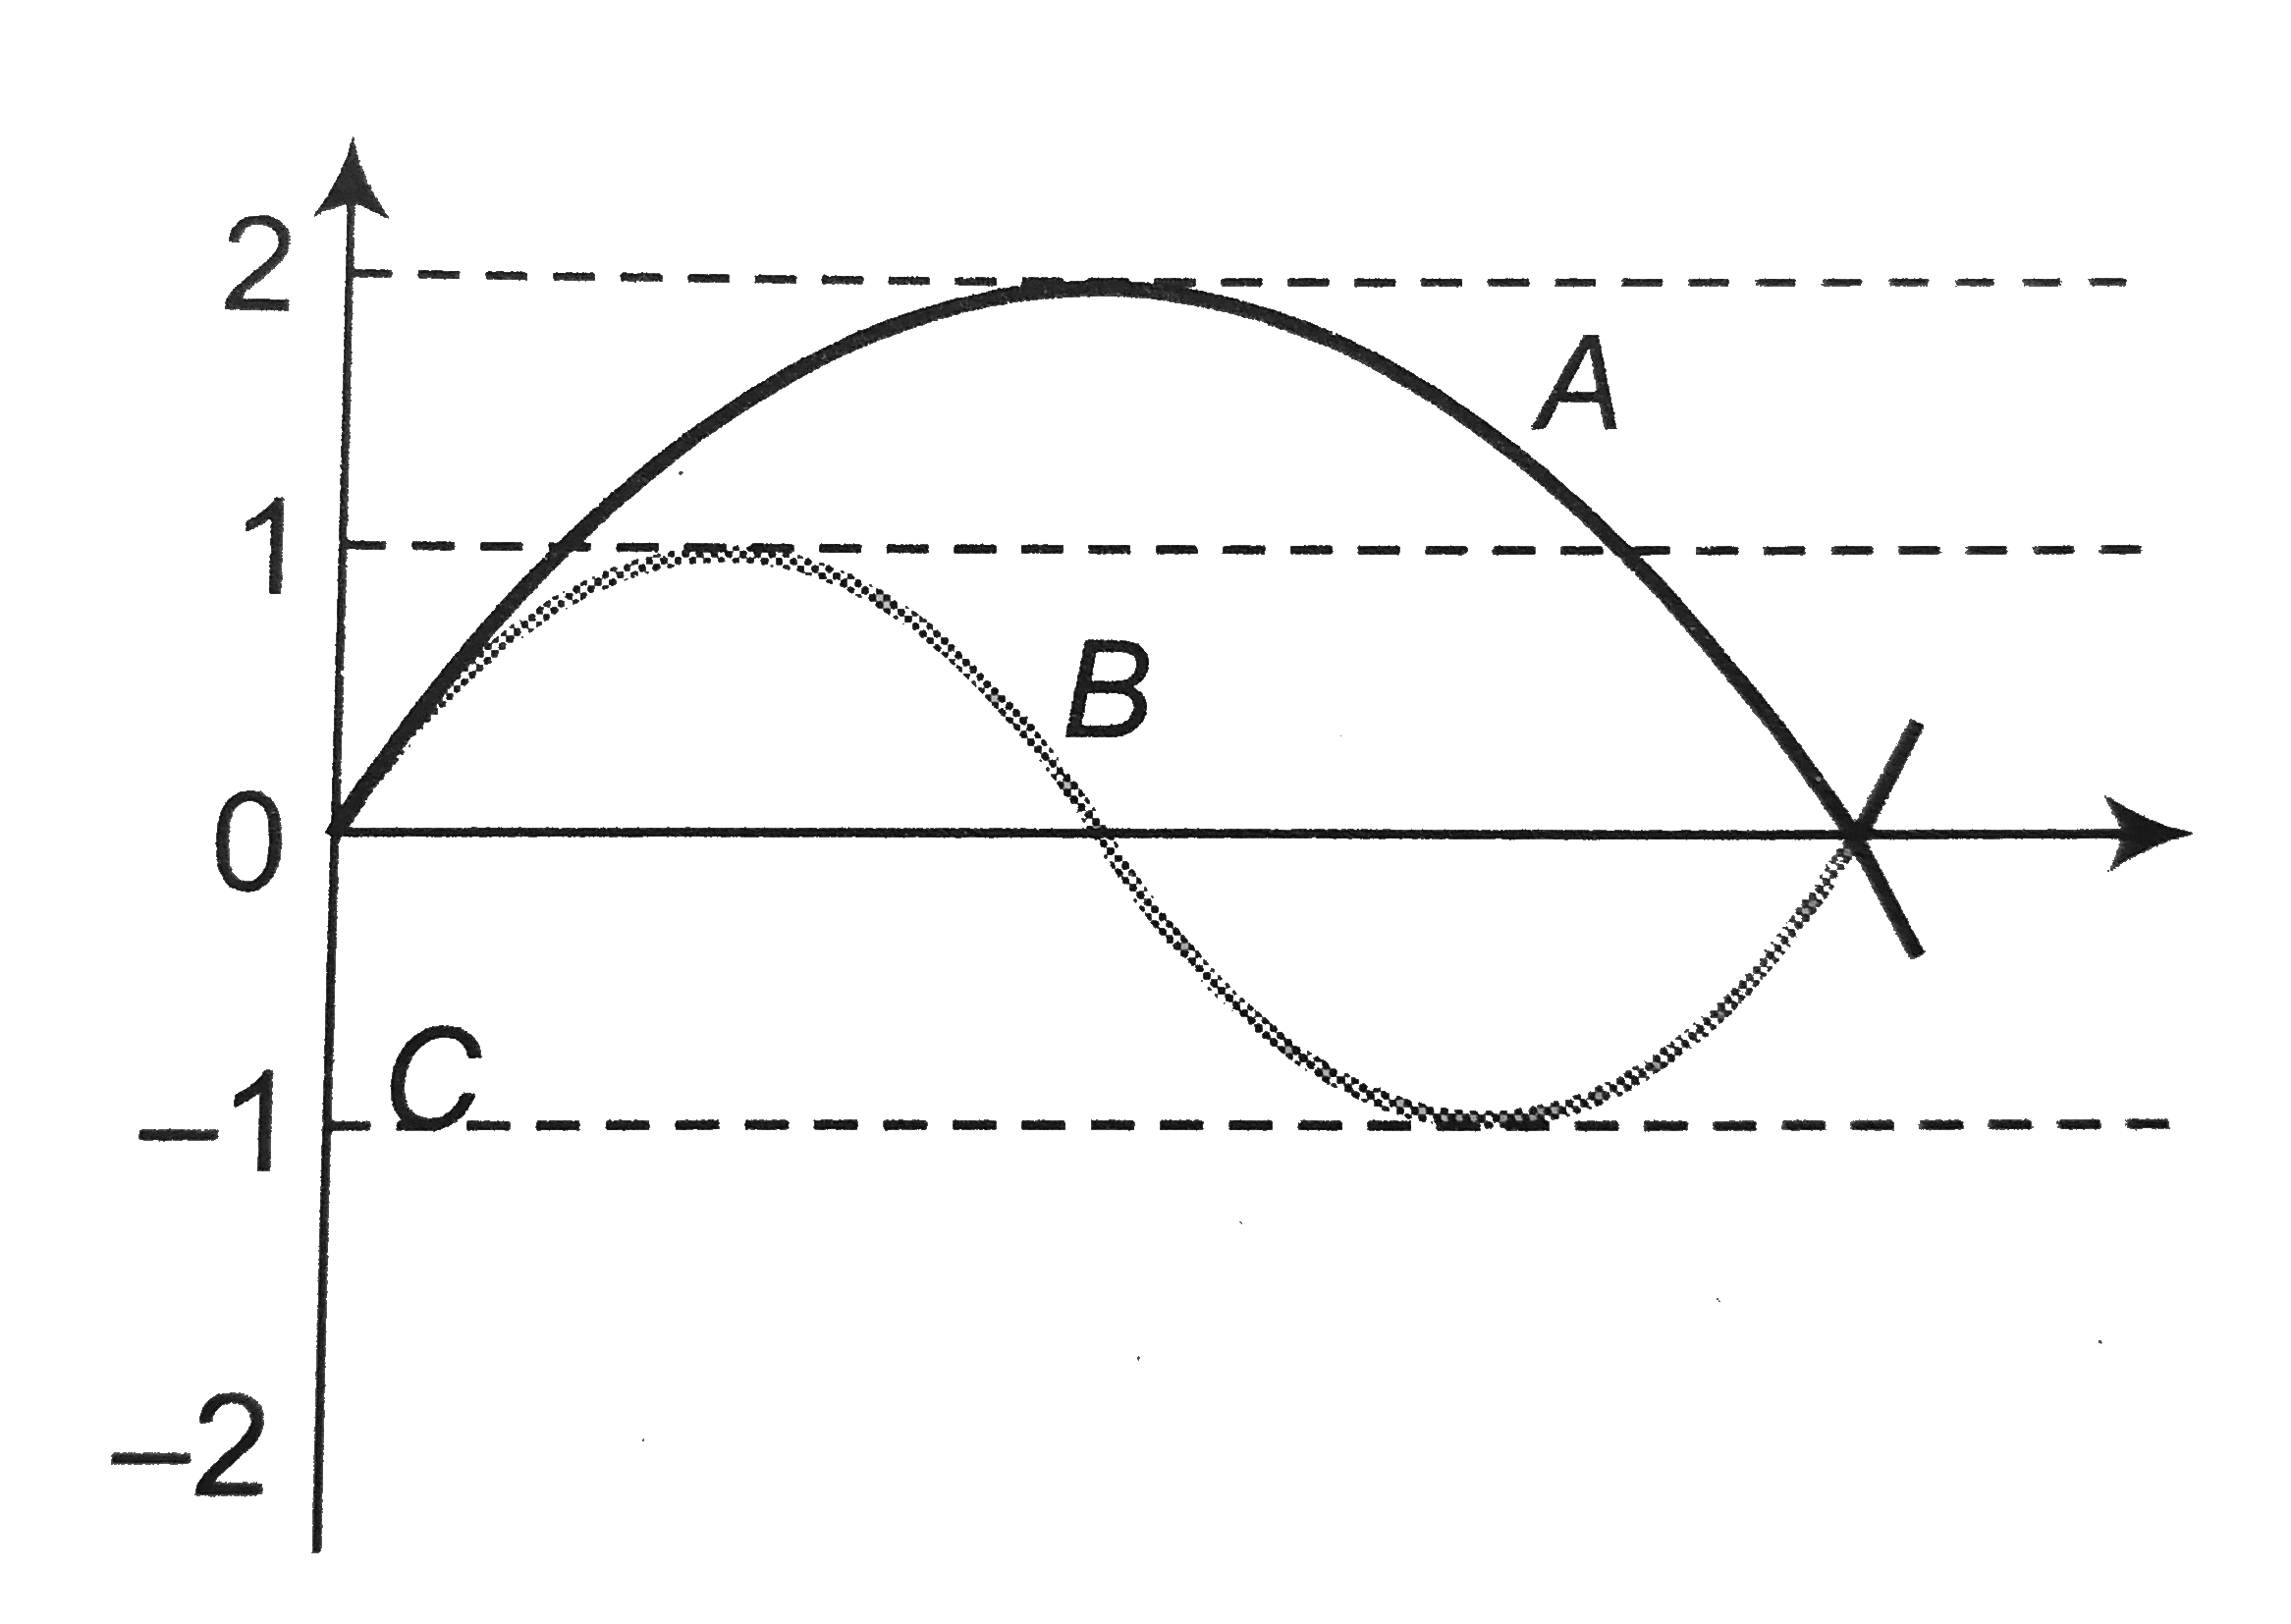
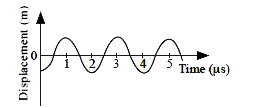
The following figure shows the displacement time graph for a sound wave produced by an instrument. 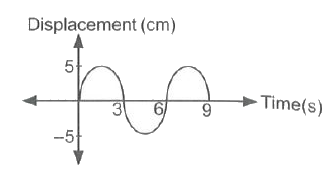
Which graph can be obtained when another muscial instrument produces a note of the same pitch but of a different quality ?
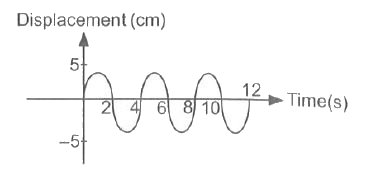
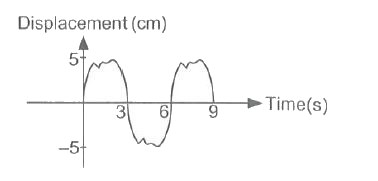
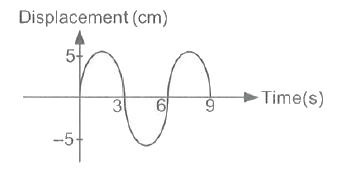

The correct Answer is:B
Step by step video & image solution for The following figure shows the displacement time graph for a sound wave produced by an instrument. Which graph can be obtained when another muscial instrument produces a note of the same pitch but of a different quality ? by Physics experts to help you in doubts & scoring excellent marks in Class 9 exams.
Related Playlists
- BOOK - SCIENCE OLYMPIAD FOUNDATION CHAPTER - SOUND EXERCISE - ACHIEVERS SECTION (HOTS)5videos
SOUND
- BOOK - SCIENCE OLYMPIAD FOUNDATION CHAPTER - NSO QUESTION PAPER 2020 SET 1EXERCISE - ACHIEVERS SECTION2videos
NSO QUESTION PAPER 2020 SET 1
- BOOK - SCIENCE OLYMPIAD FOUNDATION CHAPTER - WORK AND ENERGYEXERCISE - ACHIEVERS SECTION (HOTS)5videos
WORK AND ENERGY
Knowledge Check
- Question 1 - Select One
The figure shows displacement time graph of a wave. The frequency of this wave is displacement (mm)
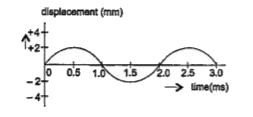 A4×10−3HzB4 HzC500 HzD1000 Hz
 - Question 1 - Select One
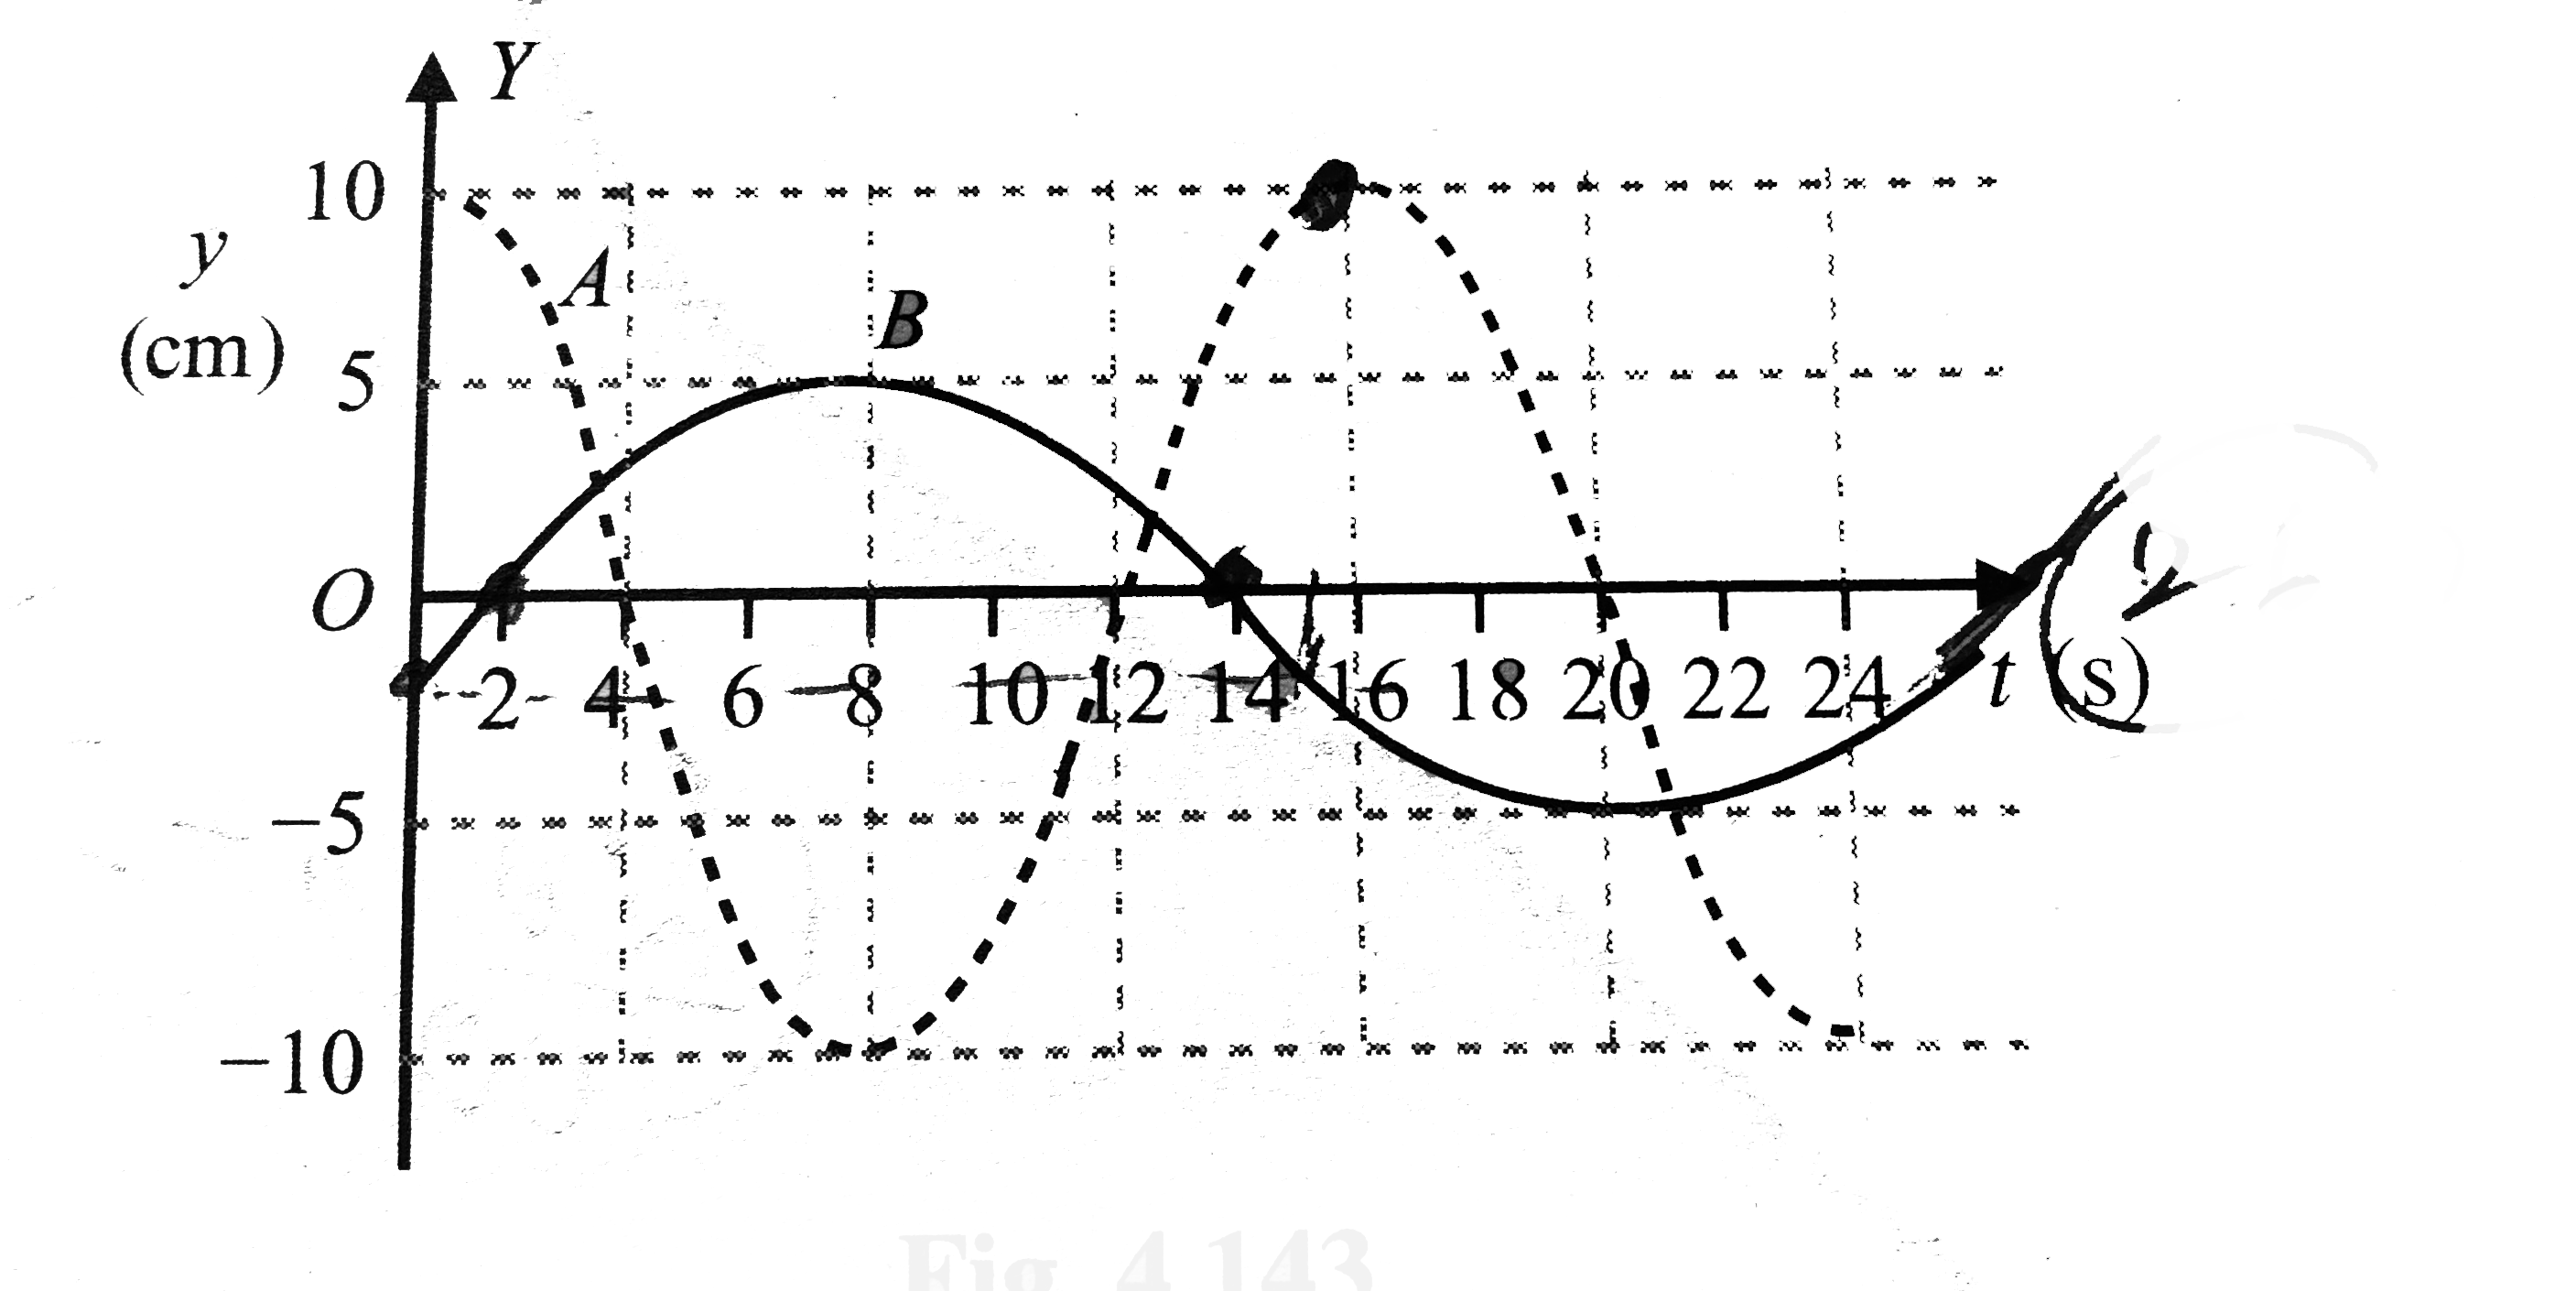
The following figure shows the displacement versus time graph for two particles A and B executing simple harmonic motions. The ratio of their maximum velocities isA3:1B1:3C1:9D9:1 - Question 1 - Select One
Figure (i) and (i) show the displacement-time graphs of two particles moving along the x-axis. We can say that
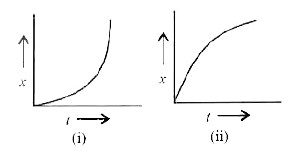 Aboth the particles are having a uniformly retarded motionBboth the particles are having a uniformly acceleraled motionCParticle (1) is having a uniformly accelerated motion while particle (i) is having a uniformly retarded motionDParticle (i) is having a uniformly retarded motion while particle (ii) is having a uniformly accelerated motion
 - Question 1 - Select One

Figure shows the displacement tiime (x-t) graph of a body moving in a straight line which one of the graph shown in figure represents the velocity- time (v-t) graph of the motion of the body.A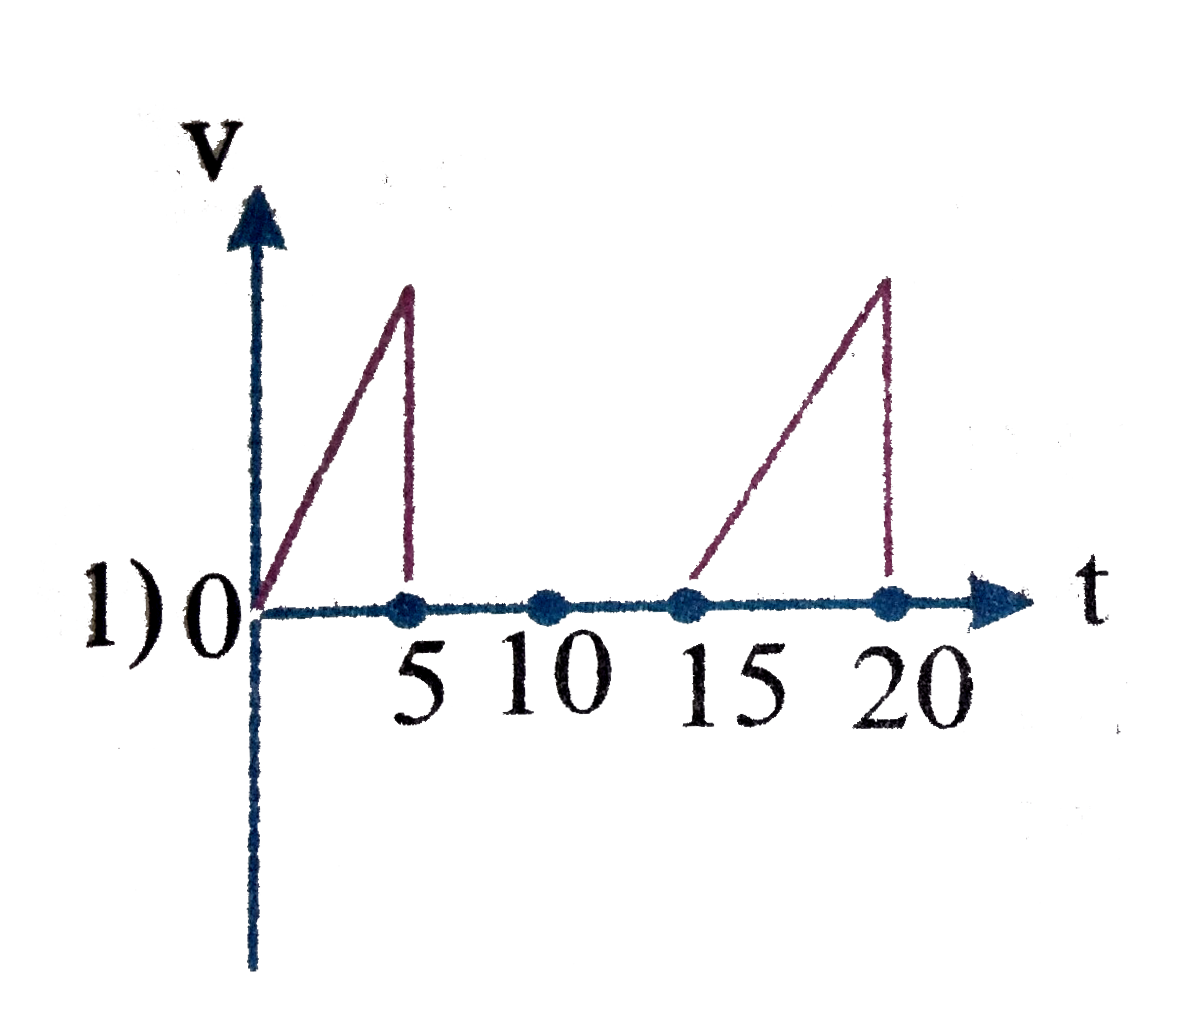 B
B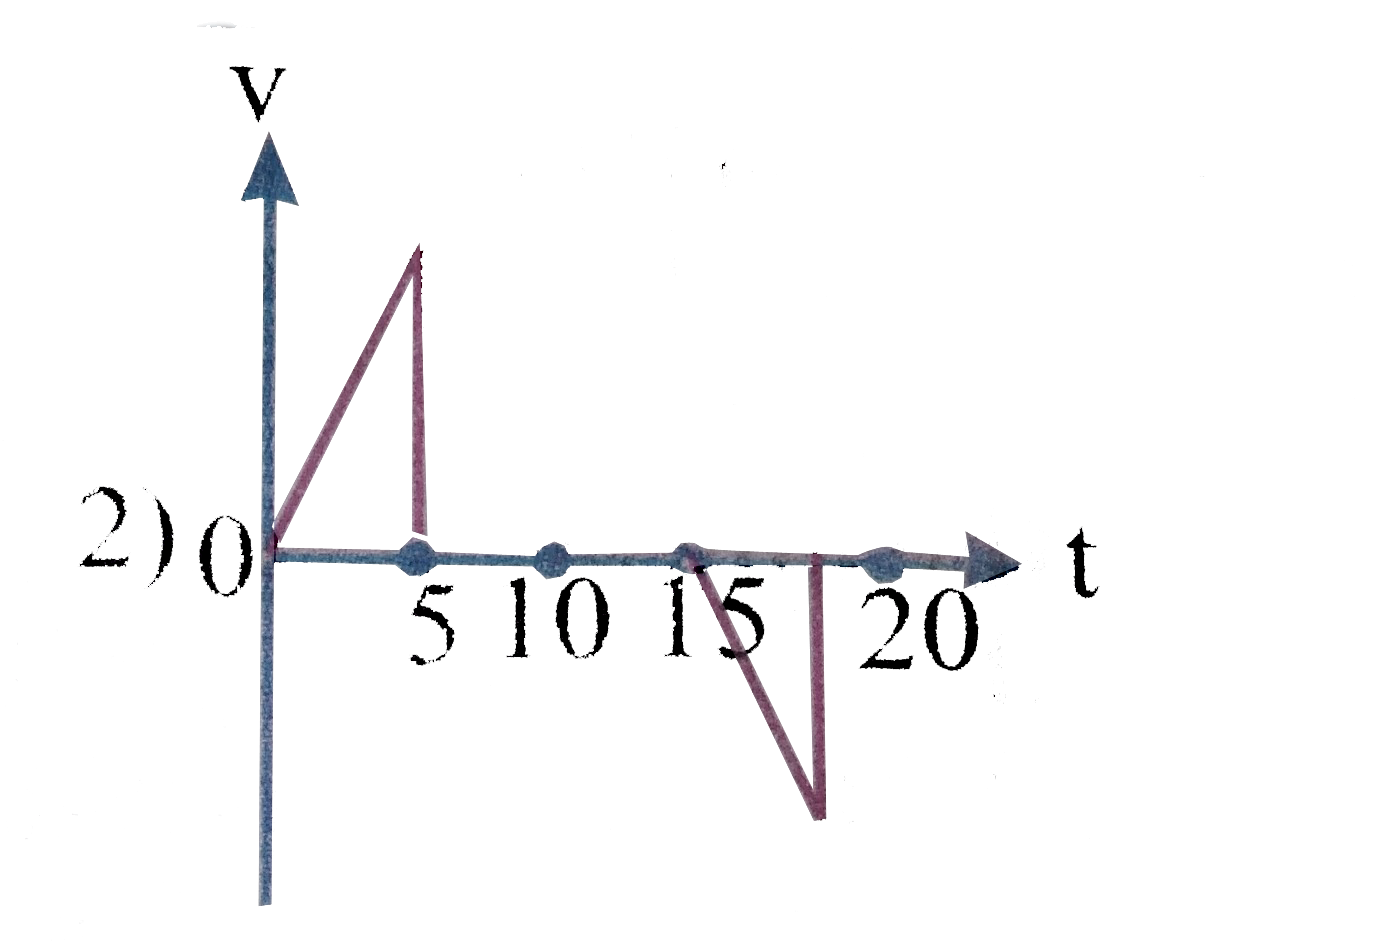 C
C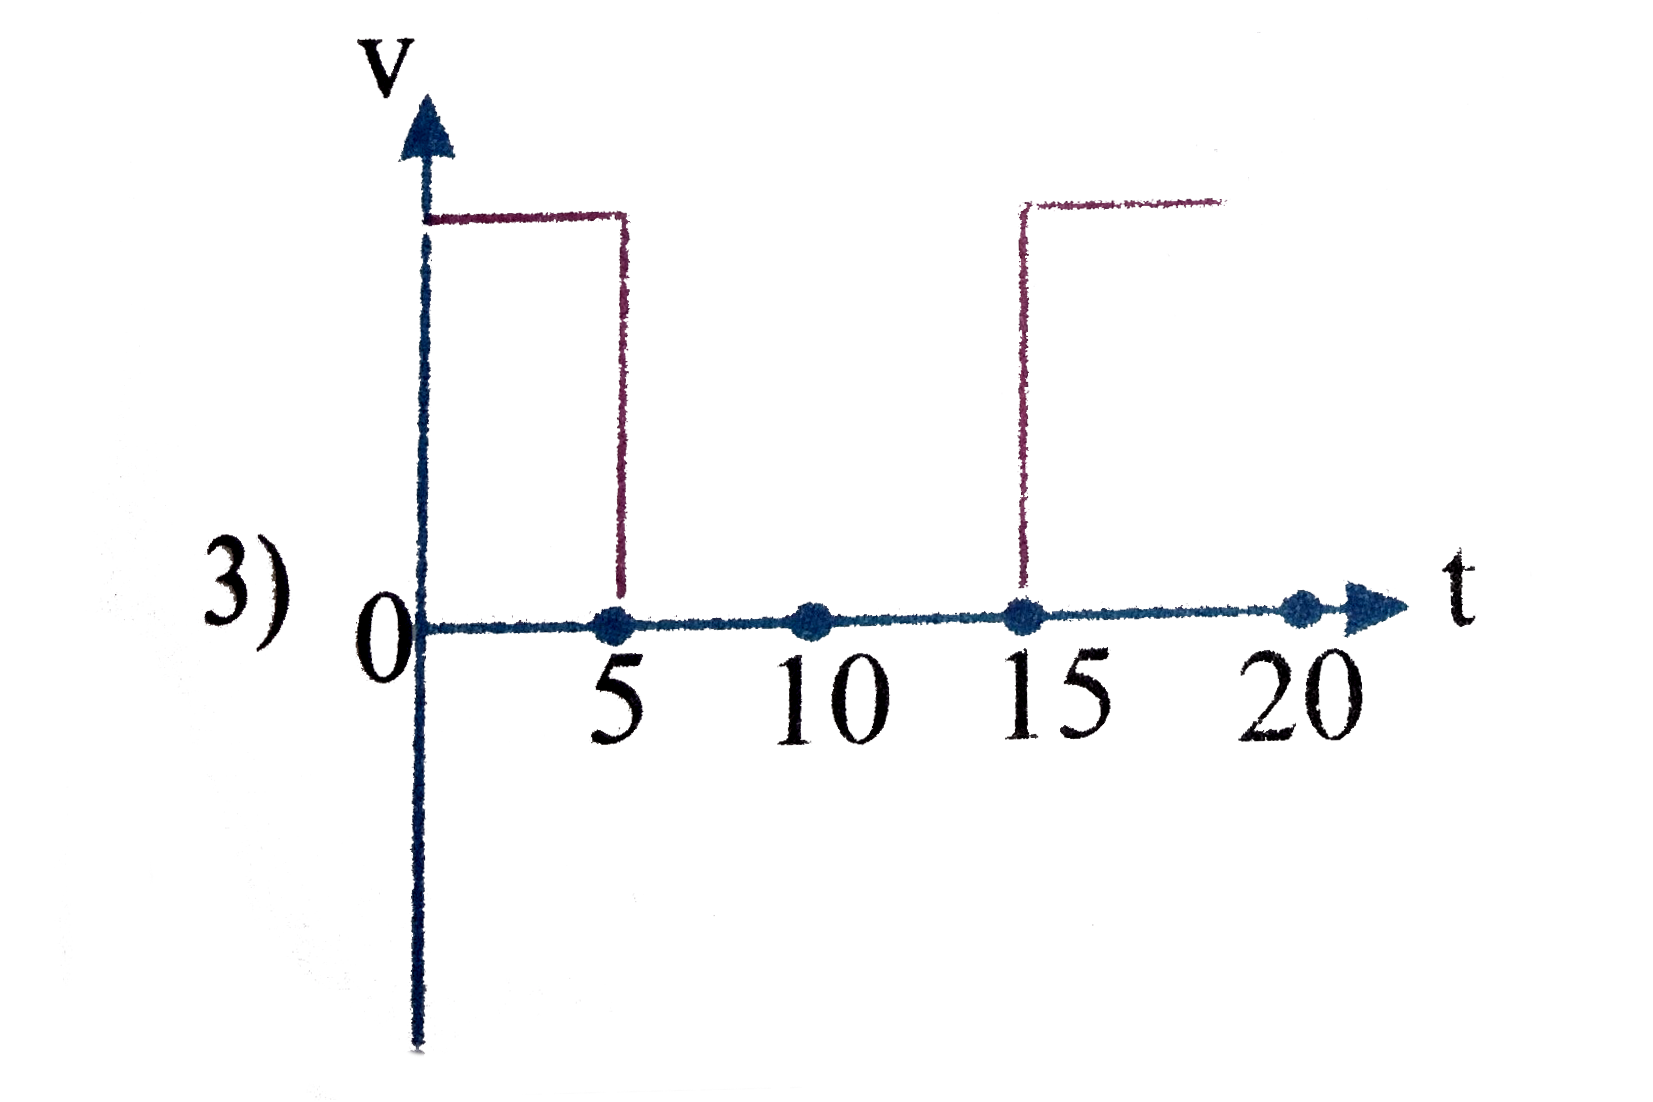 D
D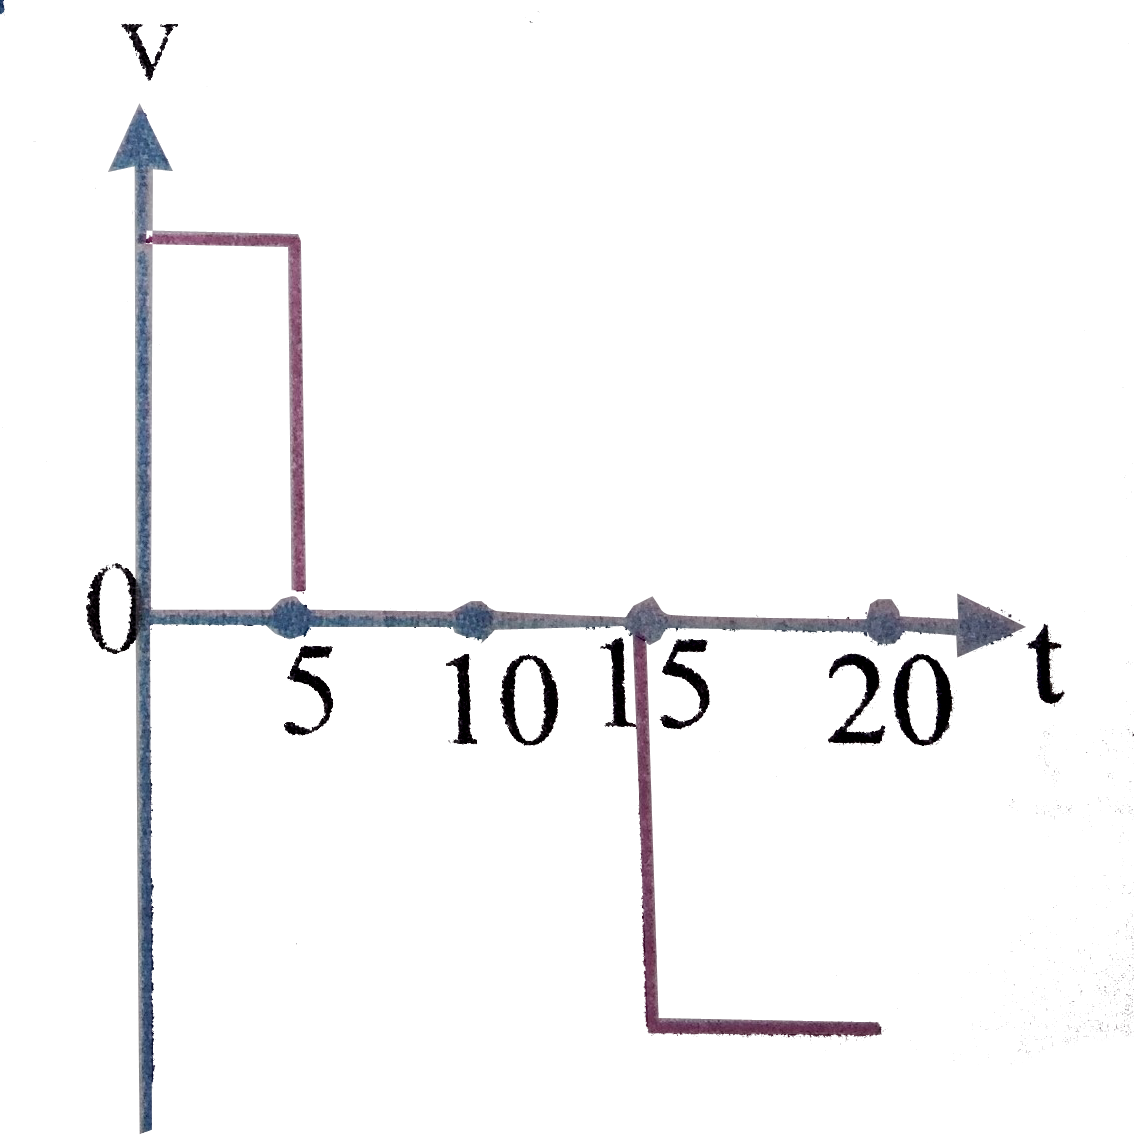
- Question 1 - Select One
The following figure-1.114 shows the linear motion velocity-time graph of a body.The body will be displaced in 5 seconds by:
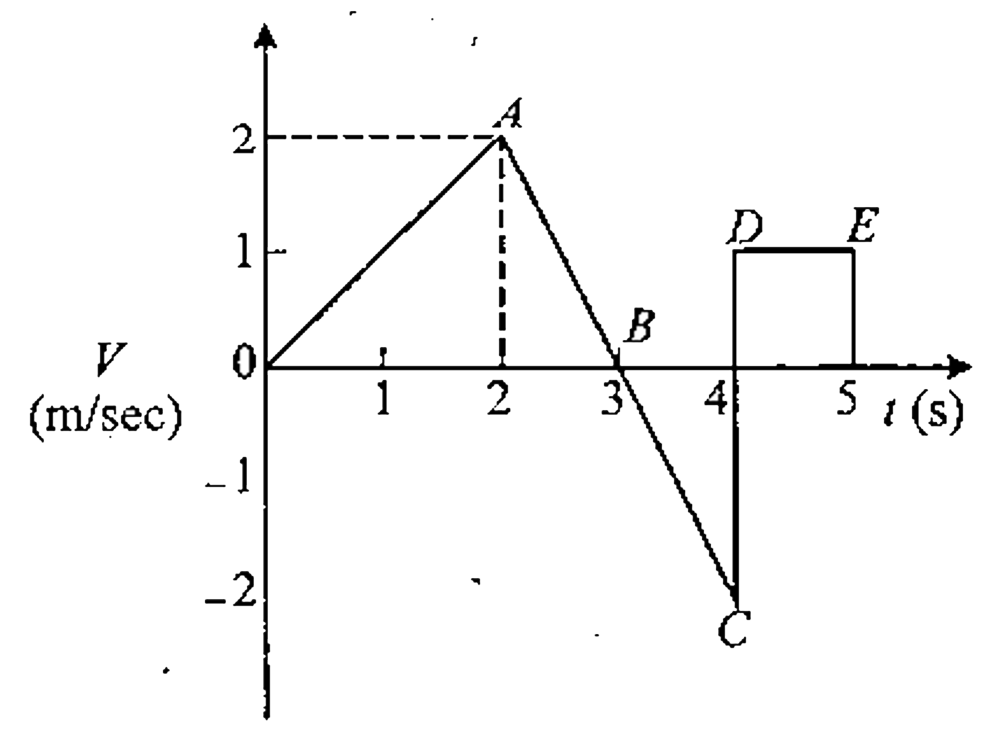 A2 mB3 mC4 mD5 m
 - Question 1 - Select One
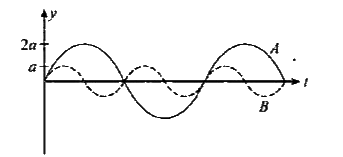
The displacement time graph for two sound waves A and B are shown in the figure. Then the ratio of their intensities IA/IB is equal toA1:4B1:16C1:2D1:1 - Question 1 - Select One
The displacement-time graphs for two sound waves A and 5 are shown in the figure-6.98, then the ratio oftheir intensities IA/IB is equal to:
 A1:4B1:16C1:2D1:1
Similar Questions
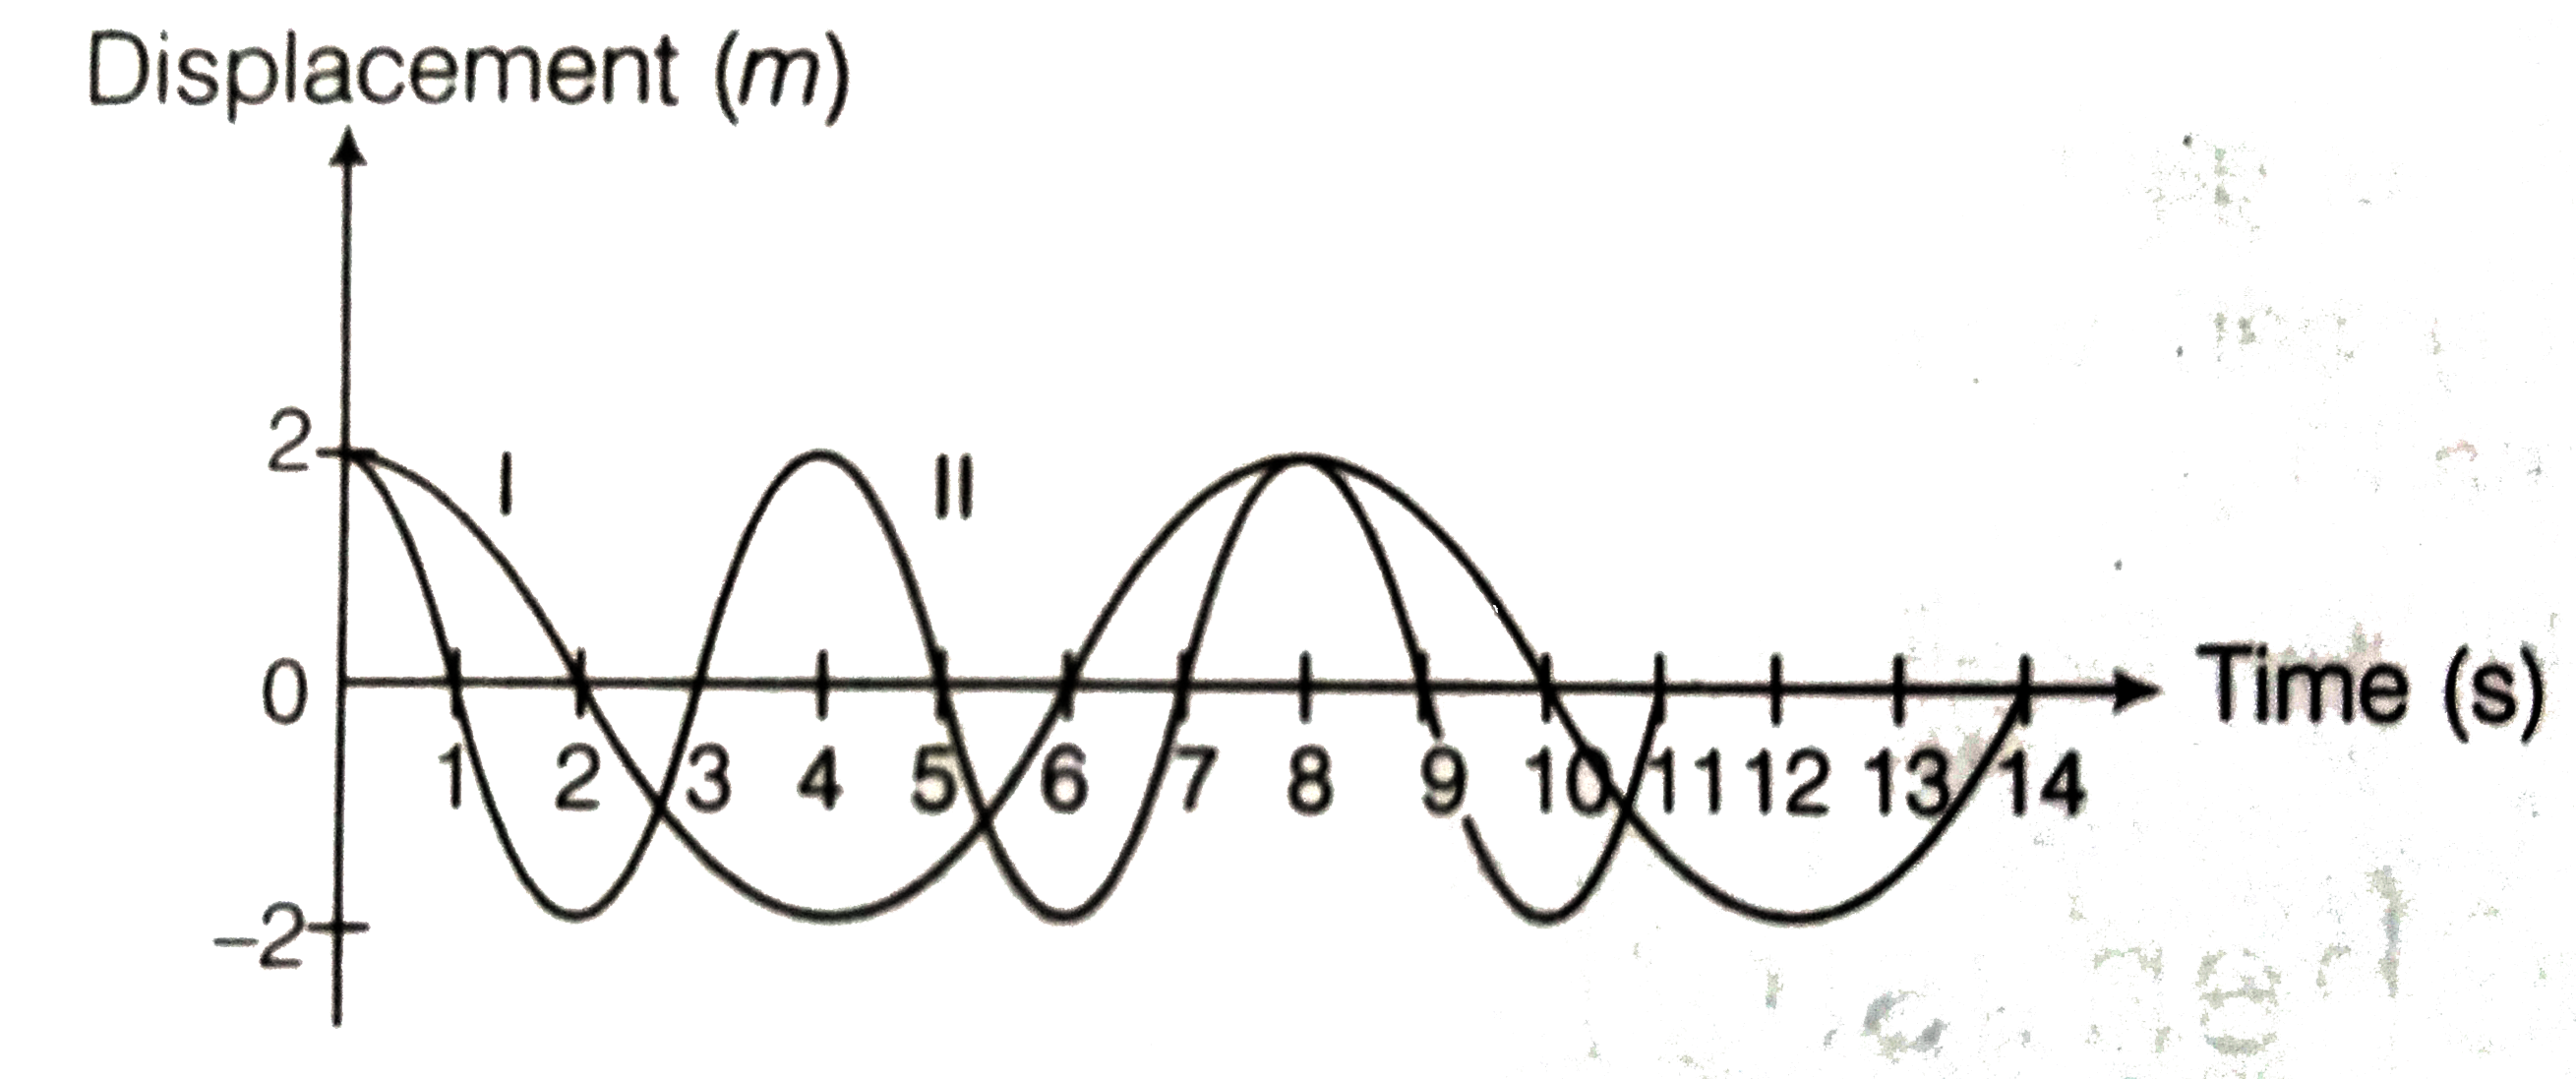
Figure shows the displacement time graphs of two simple harmonic motions I and II. From the graph it follows that
 View Solution
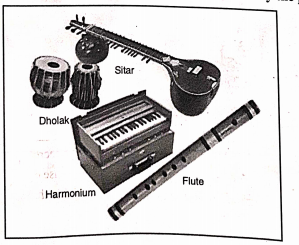
The following diagram shows some instruments. Identify the part which vibrates to produce sound.
 View Solution
The given graph shows the displacement versus time relation for a sound wave travelling with velocity of 1500 m s−1. Find the wavelength of the sound wave.
 View Solution

