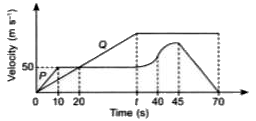
The diagram shows the velocity-time graph of two moving cars P and Q. The graph indicates that
A
The velocity of car P is increasing at a decreasing rate from 40 s to 45 s in same direction.
B
Car Q is moving with a constant acceleration from 0 to 40 seconds
C
Acceration of the car Q is not zero at any point during whole journey .
D
After 20 s, P is bihind Q.
Video Solution
Text Solution
The correct Answer is:A
From 40 s to 45 s direction of car P is same but velocity is increasing at a decreasing rate of accleration .
(ii) Acceleration of car Q from 0 to t seconds is
50−020−0=2.5ms−2 i.e., constant and after t is becomes zero.
(iii) Acceleration of the car Q is zero from t to 70 s , so velocity is constant.
(iv) Distance travelled by P at the end of first 20 s =12×50×(10+20)=750m
Distance travelled by Q at the end of first 20 s =12×50×20=250m
After 20 s , Q is behind P by 250 m
|
Updated on:21/07/2023
Related Playlists
- BOOK - SCIENCE OLYMPIAD FOUNDATION CHAPTER - MOTION EXERCISE - ACHIEVERS SECTION (HOTS)5videos
MOTION
- BOOK - SCIENCE OLYMPIAD FOUNDATION CHAPTER - GRAVITATION EXERCISE - ACHIEVERS SECTION (HOTS)5videos
GRAVITATION
- BOOK - SCIENCE OLYMPIAD FOUNDATION CHAPTER - NSO QUESTION PAPER 2016 SET A EXERCISE - ACHIEVERS SECTION2videos
NSO QUESTION PAPER 2016 SET A
Knowledge Check
- Question 1 - Select One
The diagram shows the velocity-time graph for a particle moving in a straight line. The sum of the two shaded areas represents :
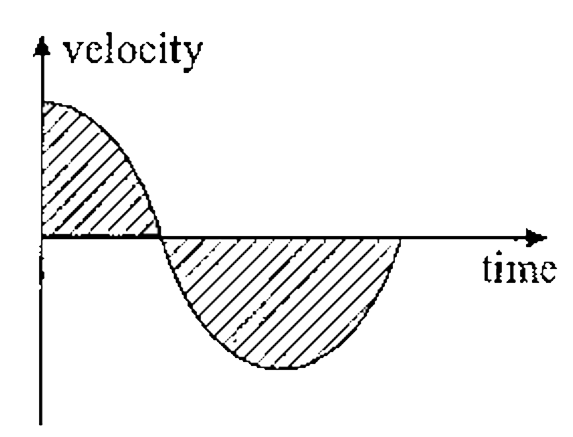 AThe increase in displacement of the particleBThe average velocity of the particleCThe average acceleration ofthe particleDThe distance moved by the particle
 - Question 1 - Select One or More
The velocity time graph of the motion of a car is given here.
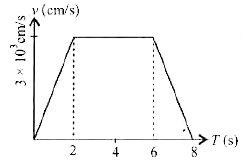 AThe distance travelled by the car in the first six seconds is 150 m.BThe deceleration of the car during the last two seconds are −15ms2.CThe distance travelled by the car in the first six second is 220 m.DThe deceleration of the car during the last two second is −20ms2
 - Question 1 - Select One
Figure shows position-time graph of two cars A and B.
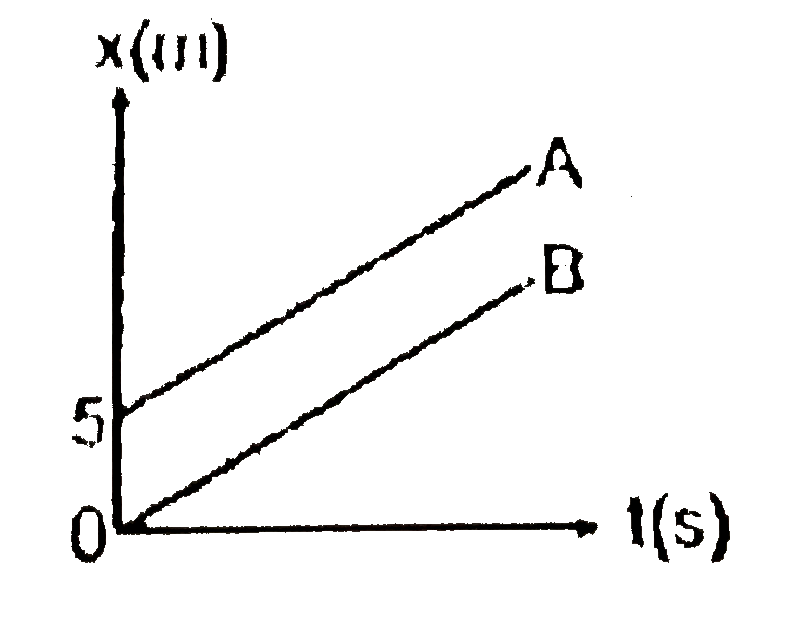 ACar A is faster than car B.BCar B is faster than car A.CBoth cars are moving with same velocity.DBoth cars have positive acceleration.
 - Question 1 - Select One
The diagram shows a velocity-time graph for a car moving in a straight line. At point Q the car must be
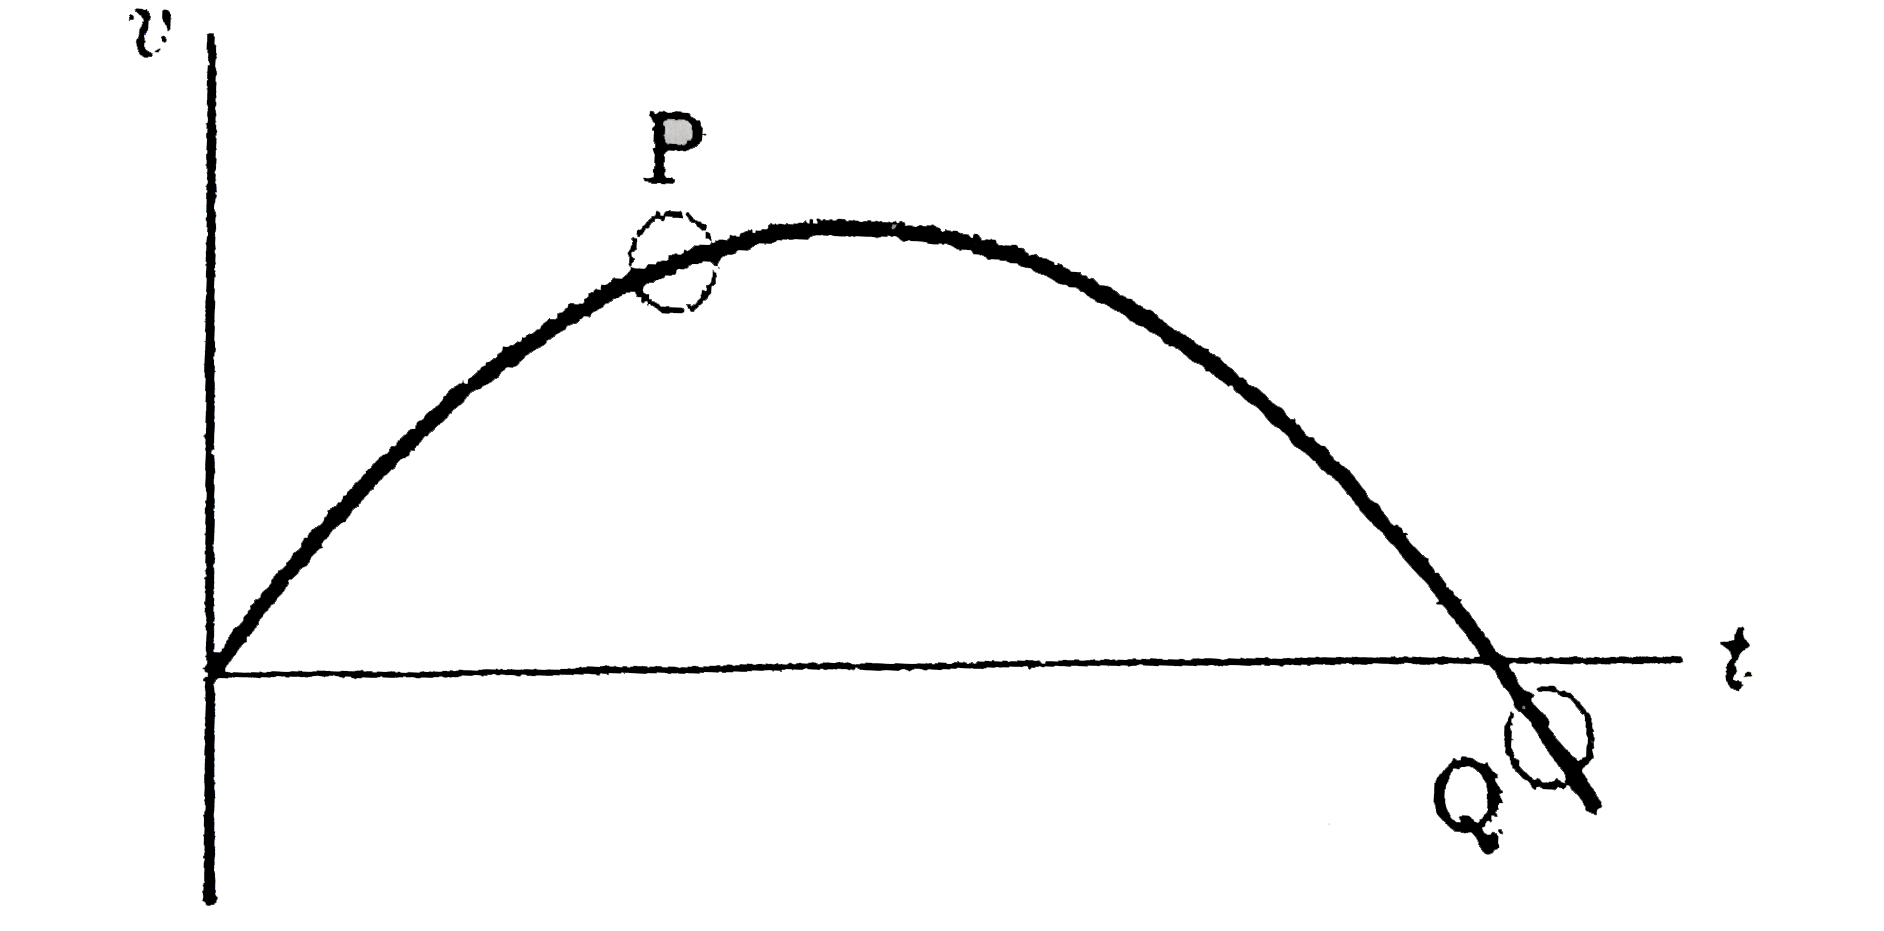 Amoving the with zero accelerationBtravelling in the reverse direction to that at point PCtraveling below ground -levelDmoving with decreasing speed.
 - Question 1 - Select One
The figure shows a velocity-time graph of a particle moving along a straight line
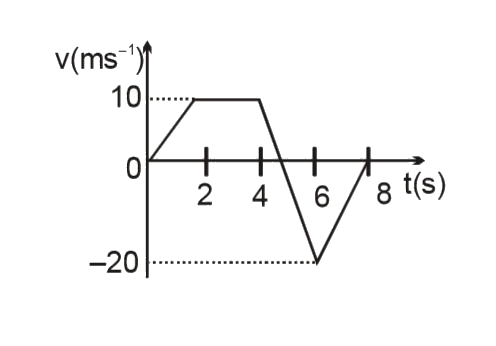
Q. The correct displacement-time graph of the particle is shown asA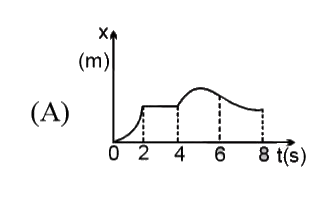 B
B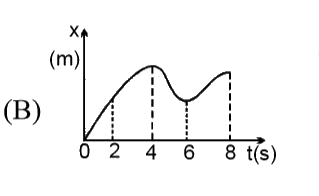 C
C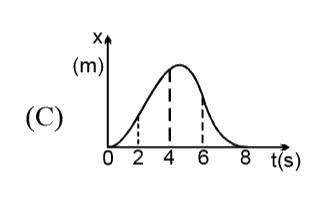 D
D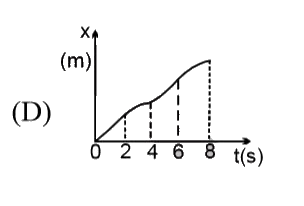
- Question 1 - Select One
The figure shows a velocity-time graph of a particle moving along a straight line
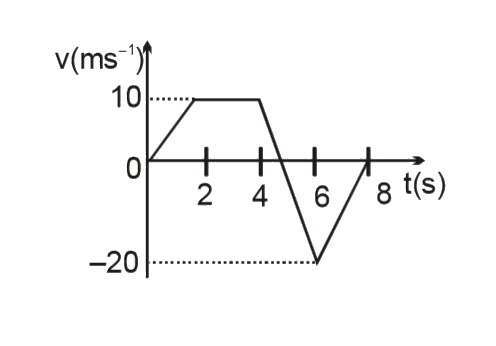
Q. The total distance travelled by the particle isA66.6 mB51.6 mCzeroD36.6m - Question 1 - Select One
The figure shows a velocity-time graph of a particle moving along a straight line
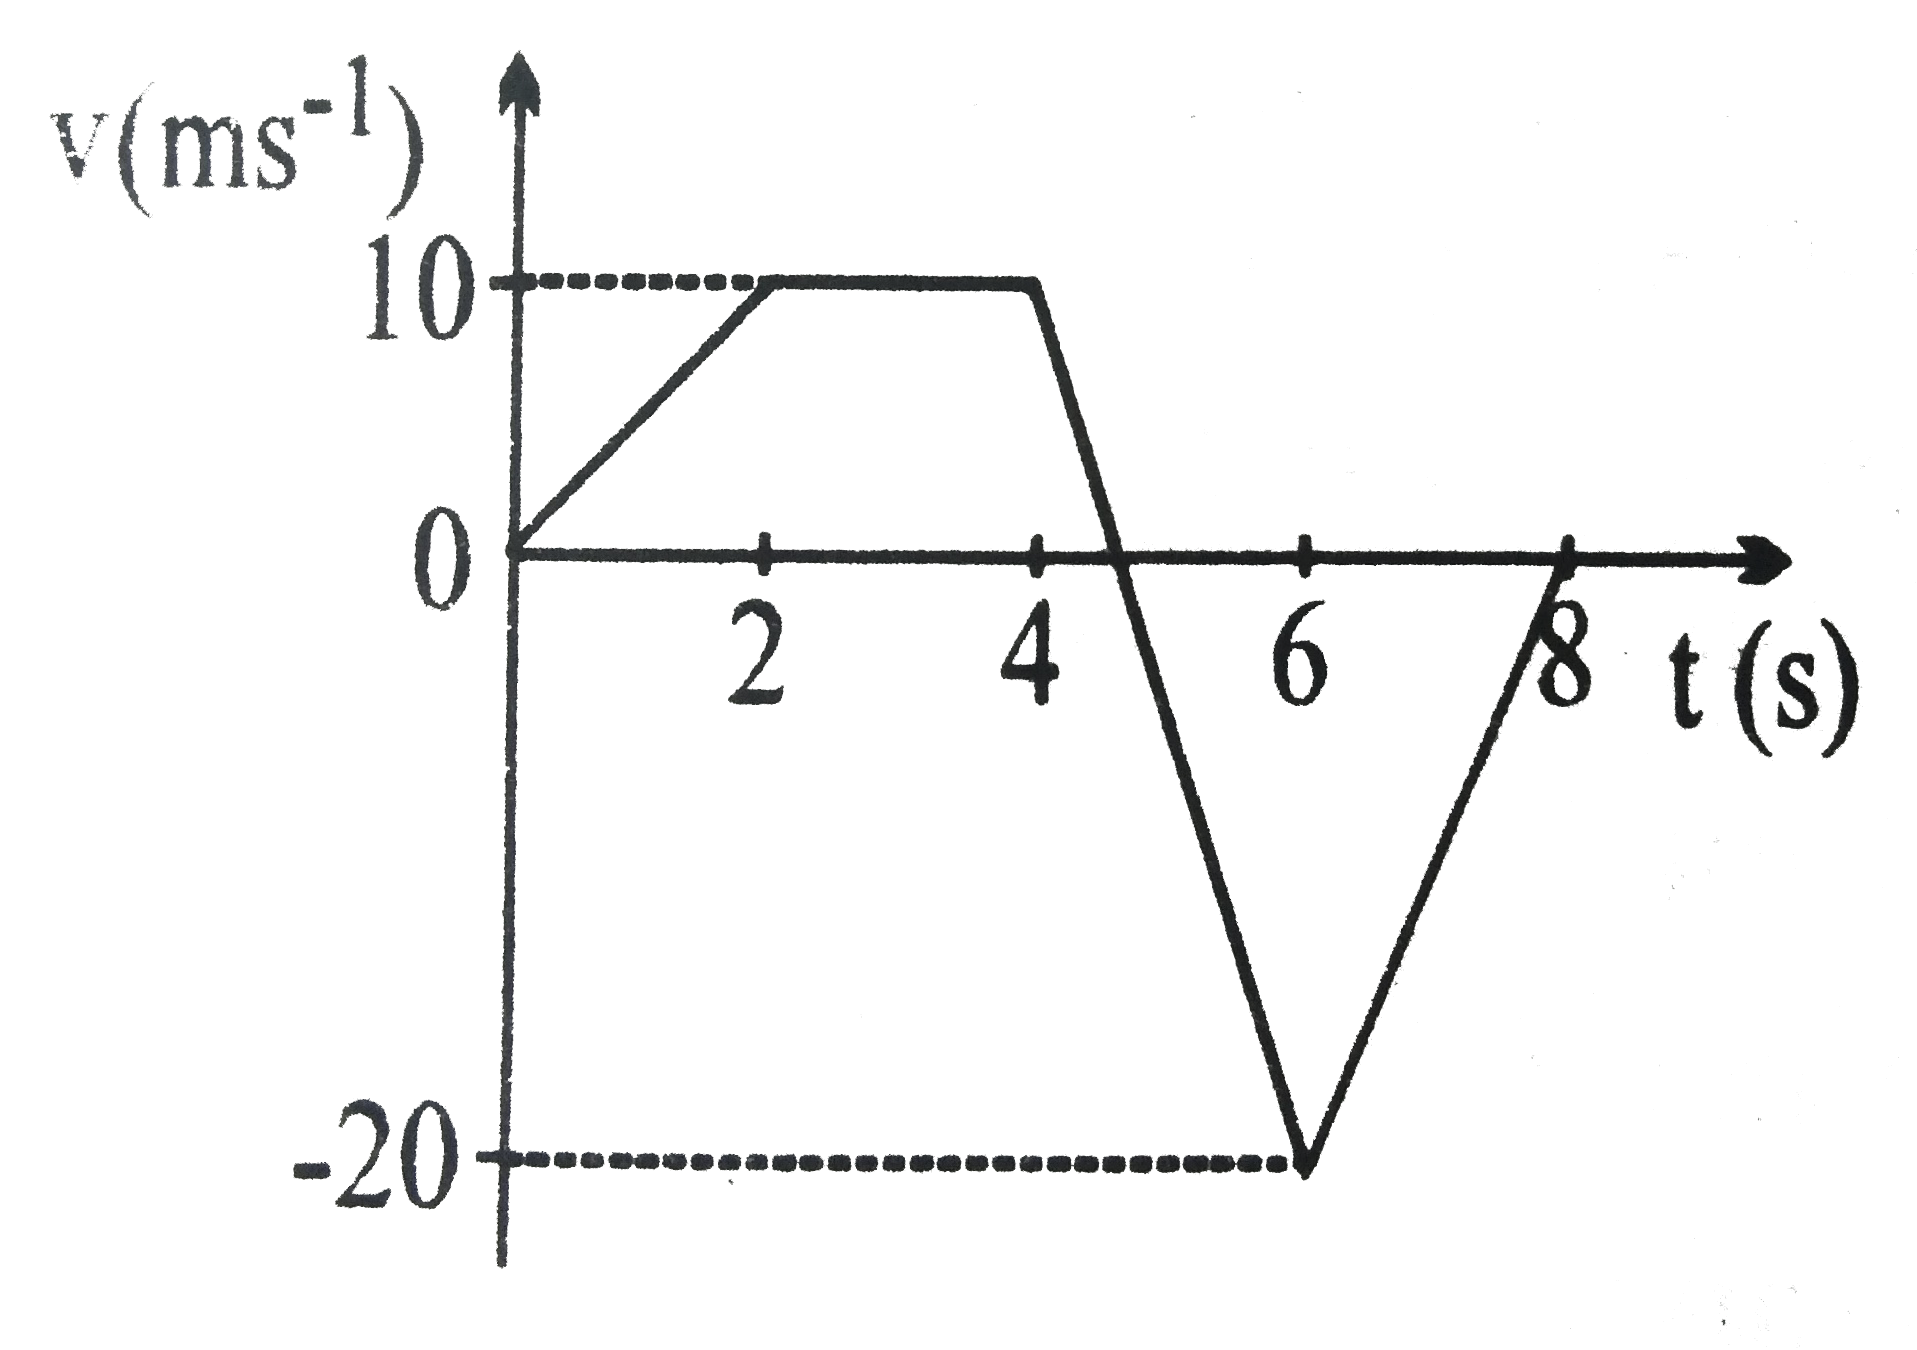
The total distance4 travelled by the particel isA66.6mB51.6mCzeroD36.6m - Question 1 - Select One
The figure shows a velocity-time graph of a particle moving along a straight line
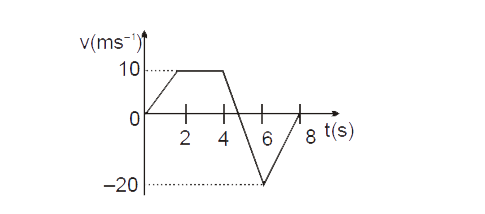
The total distance travelled by the particle isA66.6 mB51.6 mCzeroD36.6m - Question 1 - Select One
The figure shows a velocity-time graph of a particle moving along a straight line
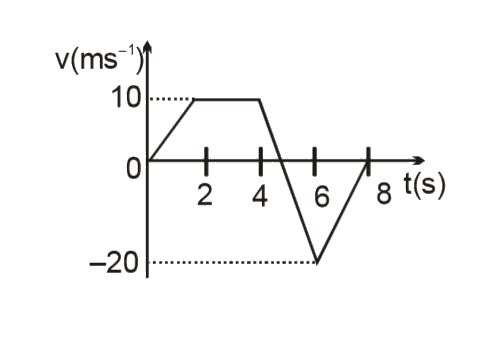
Q. The maximum of displacement of the particle isA33.3 mB23.3 mC18.3Dzero - Question 1 - Select One
Figure shows a velocity-time graph. This shows that.
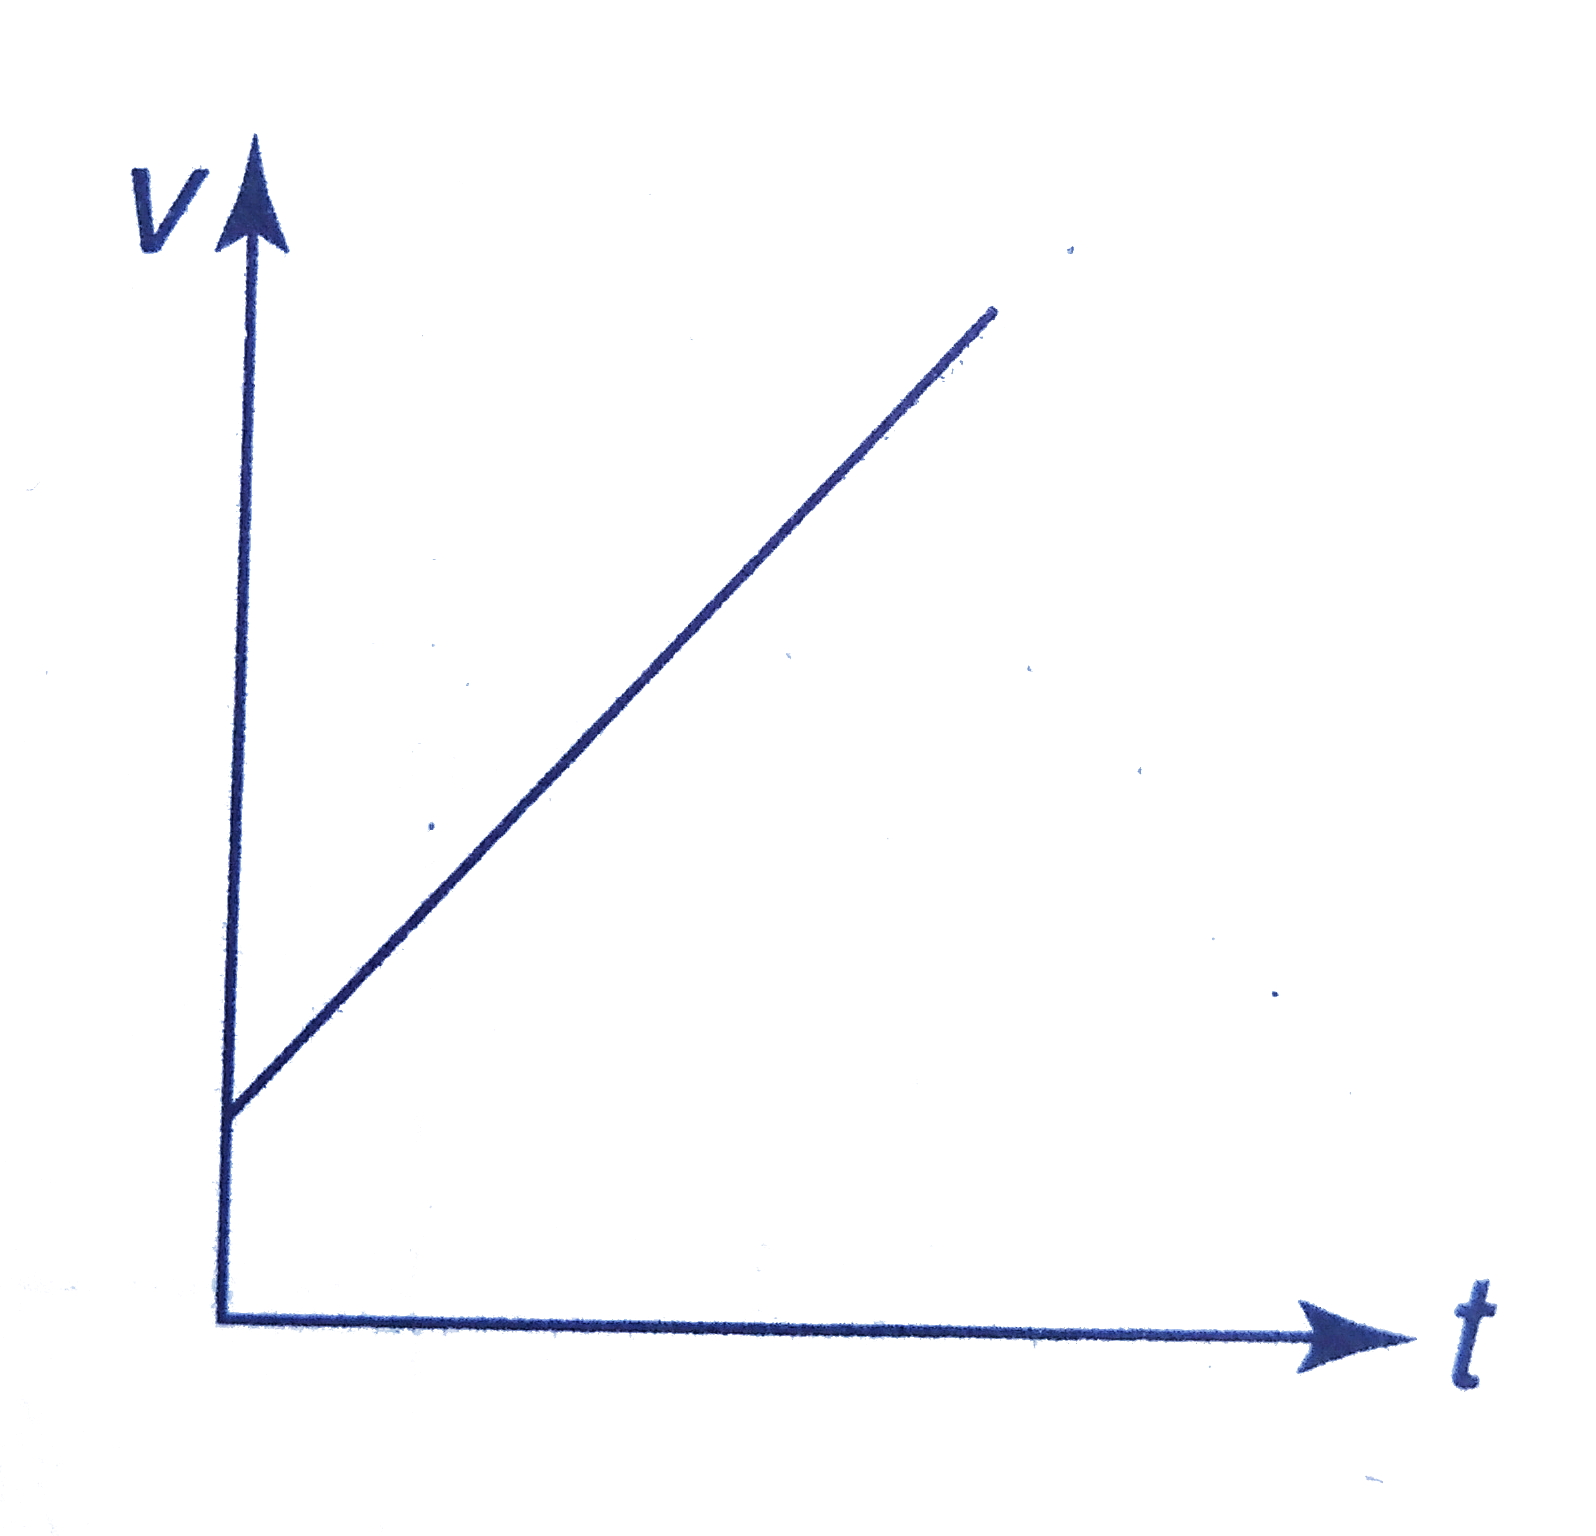 Athe body is at restBthe body starts from rest and moves with uniform velocityCthe body has some initial velocity and moves with uniform accelerationDthe motion is retarded

