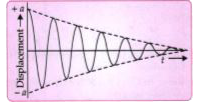
The diagram in Fig. shows the displacement time graph of a vibrating body.
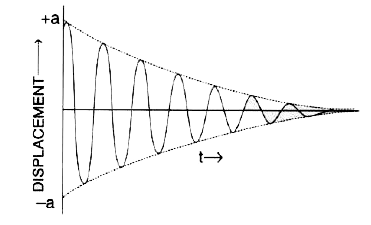
Why is the amplitude of vibrations gradually decreasing ?
The amplitude of the wave gradually decreases due to friction as energy is continuously losing.
Topper's Solved these Questions
Similar Questions
The diagram in Fig. shows the displacement time graph of a vibrating body.
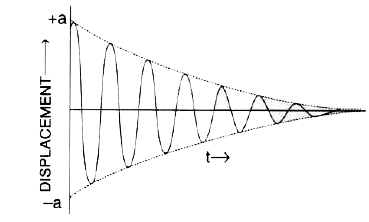
Give one example of such vibrations.
View SolutionThe diagram in Fig. shows the displacement time graph of a vibrating body.

Why is the amplitude of vibrations gradually decreasing ?
View SolutionThe diagram in Fig. shows the displacement time graph of a vibrating body.
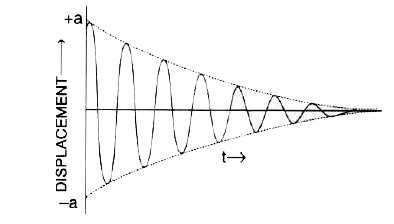
Name the kind of vibrations.
View SolutionThe diagram in Fig. shows the displacement time graph of a vibrating body.
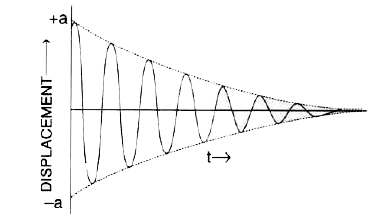
What happens to the vibrations of the body after some time?
View SolutionFigure shows the displacement time graph of a particle moving on the X-axis

View SolutionThe diagram below shows the displacement-time graph for a vibrating body.
Name the type of vibrations produced by the vibrating body.
View SolutionFigure shows the displacement-time graph of a particle moving on the X-axis

View SolutionThe diagram in Fig. shows the displacement time graph of a vibrating body.

What happens to the vibrations of the body after some time?
View SolutionThe diagram in Fig. shows the displacement time graph of a vibrating body.

Give one example of such vibrations.
View SolutionDefine amplitude of a vibrating body. What is its SI unit?
View Solution
