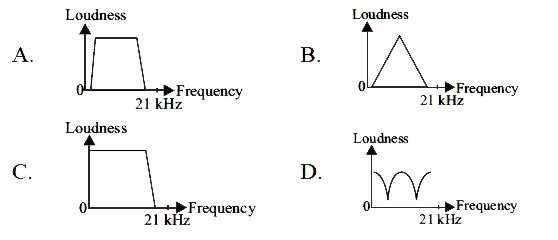
A signal generator is connected to a loud speaker. Keeping the amplitude of the wave constant, the frequency of the sound is increased from 0 Hz to 21 kHz. Which of the following graphs shows the variation of the loudness of the sound with the frequency as heard by a normal healthy man?

The correct Answer is:A
Step by step video, text & image solution for A signal generator is connected to a loud speaker. Keeping the amplitude of the wave constant, the frequency of the sound is increased from 0 Hz to 21 kHz. Which of the following graphs shows the variation of the loudness of the sound with the frequency as heard by a normal healthy man? by Physics experts to help you in doubts & scoring excellent marks in Class 9 exams.
Updated on:21/07/2023Topper's Solved these Questions
- NSO QUESTION PAPER 2016 SET BBOOK - SCIENCE OLYMPIAD FOUNDATION CHAPTER - NSO QUESTION PAPER 2016 SET BEXERCISE - ACHIEVERS SECTION
2 Videos
- NSO QUESTION PAPER 2016 SET A BOOK - SCIENCE OLYMPIAD FOUNDATION CHAPTER - NSO QUESTION PAPER 2016 SET A EXERCISE - ACHIEVERS SECTION
2 Videos
- NSO QUESTION PAPER 2017 SET A BOOK - SCIENCE OLYMPIAD FOUNDATION CHAPTER - NSO QUESTION PAPER 2017 SET A EXERCISE - ACHIEVERS SECTION
1 Video
Similar Questions
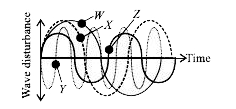
Refer to the graph given here.

Which of the following sound waves is low-pitched but loud?
View SolutionTwo loud speakers are located 3.35 m apart on an outdoor stage. A listener is 175 m from one and 19.5 m from the other. During the sound check, a signal generator drives the two speakers in phase with the same amplitude and frequency. The transmitted frequency is swept through the audible range (20 Hz to 20 kHz). (a) What is the lowest frequency fmin.1 that gives minimum signal (destructive interference) at the listener's location? By what number must fmin.1be multiplied to get (b) the second lowest frequency fmin.2 that gives minimum signal and (c) the third lowest frequency fmin.3 that gives minimum signal? (d) What is the lowest frequency fmax.1 that gives maximum signal (constructive interference) at the listener's location? By what number must fmax.1 be multiplied to get (e ) the second lowest frequency fmax.2 that gives maximum signal and (f) the third lowest frequency fmax.3 that gives maximum signal?
View Solution
Knowledge Check
A variable frequency alternating voltage of constant magnitude is applied across a capacitor. Which of the following graph shows the variation of current set up in the circuit with frequency v?
A B
B C
C D
D
in which of the following case frequency of sound heard by the observer increases?
Awhen source are moving away from the stationary observerBwhen observer are moving away from the stationary sourceCwhen both observer and source are moving away from each otherDwhen both observer and source are moving towards each otherIf the frequency of sound produced by a siren increases from 400 Hz to 1200 Hz while the wave amplitude remains constant, the ratio of the intensity of the 1200 Hz to that of the 400 Hz wave will
A1:1B1:3C3:1D9:1
A person has a hearing range from 20Hz to 20kHz. What are the typical wavelength of sound waves in sir corresponding to these two frequencies ? Take the speed of sound in air as 344m/s.
View SolutionAudio sine waves of 3 kHz frequency are used to amplitude modulate a carrier signal of 1.5 MHz. Which of the following statements are true?
View SolutionWhich of the following graphs represents correctly the variations of 0.5mv2max with the intensity of incident radiations of a constant frequency ?
View SolutionStatement I : The pitch of the sound wave depends upon its frequency.
Statement II: The loudness of the sound wave depends upon its amplitude.
View SolutionTwo loudspeakers are located 3 m apart on the stage of an auditorium. A listener at point P is seated 29.0 m from one speaker and 25.0 m from the other. A signal generator drives the speakers in phase with the same amplitude and frequency. The wave amplitude at P due to each speaker alone is A. The frequency is then varied between 20 Hz and 300 Hz. The speed of sound is 343 m/s.
At what frequency or frequencies will the listener at P hear a maximum intensity?
View Solution
