The given bar graph shows the area under the rice crop during different years in India. Study the graph carefully and answer the following questions.
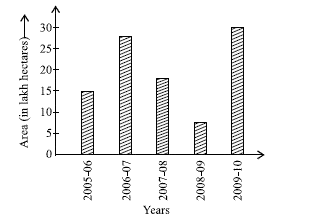
Find the difference between the area under the rice crop during 2006-2008 and 2008-2010.
375000
450000
750000
75000
The correct Answer is:C
Step by step video, text & image solution for The given bar graph shows the area under the rice crop during different years in India. Study the graph carefully and answer the following questions. Find the difference between the area under the rice crop during 2006-2008 and 2008-2010. by Maths experts to help you in doubts & scoring excellent marks in Class 10 exams.
Updated on:21/07/2023Topper's Solved these Questions
- IMO QUESTION PAPER 2018 SET ABOOK - SCIENCE OLYMPIAD FOUNDATION CHAPTER - IMO QUESTION PAPER 2018 SET AEXERCISE - Everyday Mathematics
10 Videos
- IMO QUESTION PAPER 2018 SET ABOOK - SCIENCE OLYMPIAD FOUNDATION CHAPTER - IMO QUESTION PAPER 2018 SET AEXERCISE - Achievers section
5 Videos
- IMO QUESTION PAPER 2017 SET-BBOOK - SCIENCE OLYMPIAD FOUNDATION CHAPTER - IMO QUESTION PAPER 2017 SET-BEXERCISE - Achievers Section
5 Videos
- IMO QUESTION PAPER 2018 SET BBOOK - SCIENCE OLYMPIAD FOUNDATION CHAPTER - IMO QUESTION PAPER 2018 SET BEXERCISE - ACHIEVERS SECTION
5 Videos
Similar Questions
Study the following graph carefully and answer the given questions.
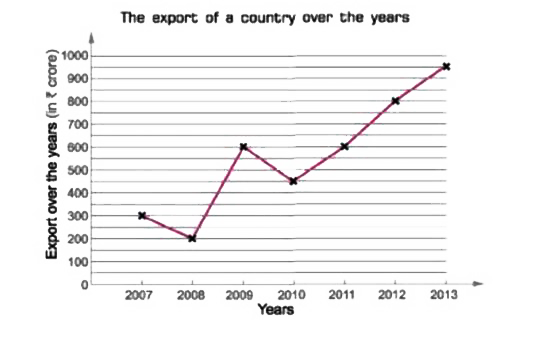
What is the difference in exports in the years 2009 and 2010 ?
View SolutionRead the following graph carefully and answer the questions given below:
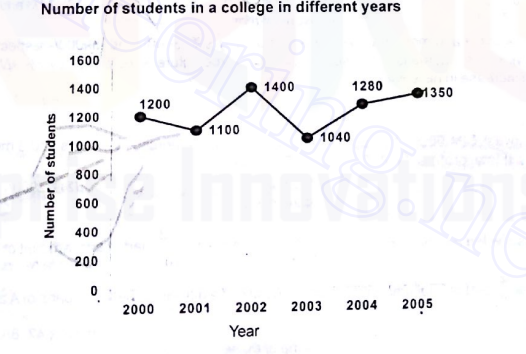
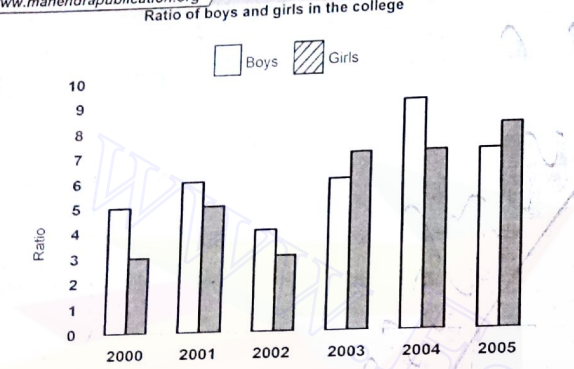
What is the difference between the number of boys and girls in the year 2004 ?
View Solution
Knowledge Check
Study the graph carefully and answer the following questions.
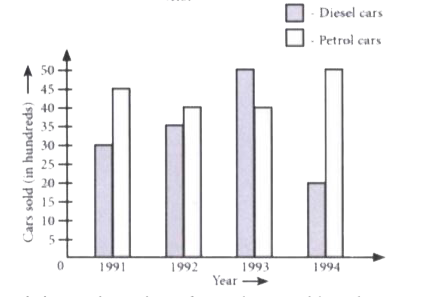
How many cars were sold during the year 1991?A9000B6500C7500D7000Study the following graph carefully and answer the questions given below
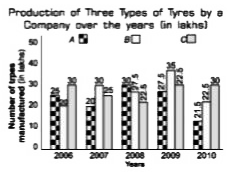
What was the difference between the number of B type tyres manufactured in 2008 and 2009?A100000B2000000C1000000Dnone to theseThe given bar graph shows the biscuit exports of India over a period of five years. Study the graph and answer the questions that follows
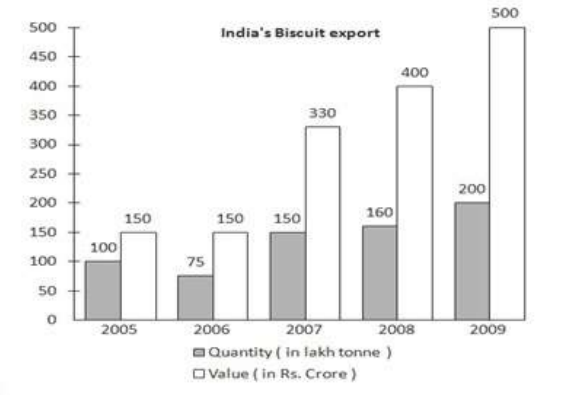
In which two year was the value per tonne equal?A2006 and 2007B2008 and 2009C2007 and 2008D2005 and 2006
Following graph shows the income of a company in six different years. Study the graph , carefully and answer the questions that follow.
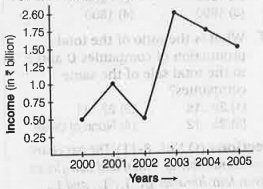
In which year income of the company is the highest?
View SolutionStudy the graph and answer the following questions-
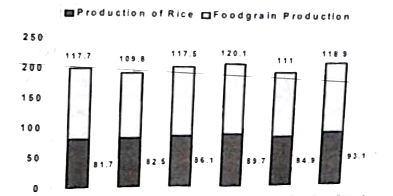
Over the given years what is average production of rice?
View SolutionThe graph shows the production of food grains of a country in different years. Study the graph and answer the questions.
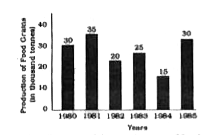
The difference between the production of food grains in the years 1981 and 1985 is
View SolutionStudy the following graph carefully and answer the question given below-----
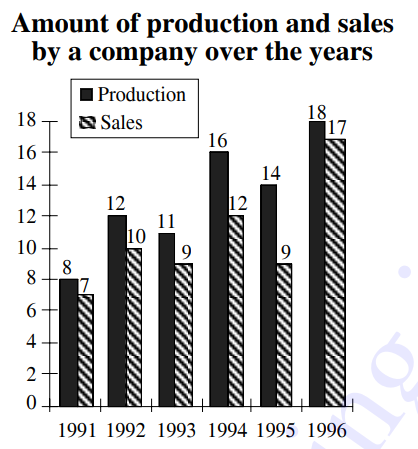
What was the difference between the sales of 1992 and 1995 ?
View SolutionA graph showing the price of rice in India during the year 2000 to 2003 is given below. Study the graph carefully and answer the questions.
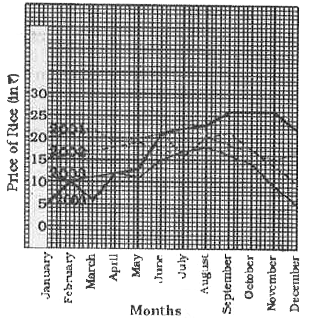
The maximum difference in price between any two years was in the month of
View Solution
