The given table shows the temperature of a city for seven days .

On which day does the temperature increase the most from the previous day ?
Sunday
Thursday
Wednesday
Tuesday
The correct Answer is:D
Step by step video, text & image solution for The given table shows the temperature of a city for seven days . On which day does the temperature increase the most from the previous day ? by Maths experts to help you in doubts & scoring excellent marks in Class 6 exams.
Updated on:21/07/2023Topper's Solved these Questions
- IMO QUESTION PAPER 2019-20 SET ABOOK - SCIENCE OLYMPIAD FOUNDATION CHAPTER - IMO QUESTION PAPER 2019-20 SET AEXERCISE - EVERYDAY MATHEMATICS
10 Videos
- IMO QUESTION PAPER 2019-20 SET ABOOK - SCIENCE OLYMPIAD FOUNDATION CHAPTER - IMO QUESTION PAPER 2019-20 SET AEXERCISE - ACHIEVERS SECTION
7 Videos
- IMO QUESTION PAPER 2018-19 SET BBOOK - SCIENCE OLYMPIAD FOUNDATION CHAPTER - IMO QUESTION PAPER 2018-19 SET BEXERCISE - Everyday Mathematics
15 Videos
- IMO QUESTION PAPER 2019-20 SET B BOOK - SCIENCE OLYMPIAD FOUNDATION CHAPTER - IMO QUESTION PAPER 2019-20 SET B EXERCISE - ACHIEVERS SECTION
5 Videos
Similar Questions
The graph given below compares the sales of ice creams of two vendors for a week.
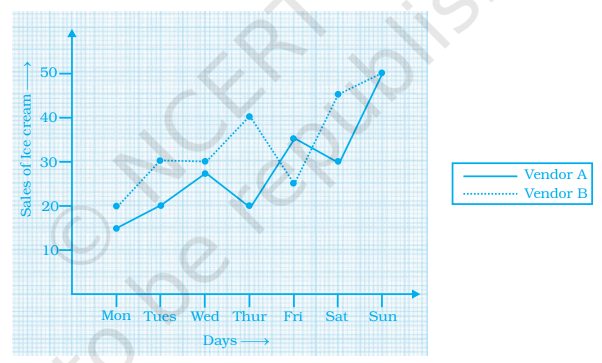
Observe the graph and answer the following questions.
(a) Which vendor has sold more icecreams on Friday?
(b) For which day was the sales same for both the vendors?
(c) On which day did the sale of vendor A increase the most as compared to the previous day?
(d) On which day was the difference in sales the maximum?
(e) On which two days was the sales same for vendor B?
View SolutionThe following graph shows the temperature forecast and the actual temperature for each day of a week.(a) On which days was the forecast temperature the same as the actual temperature? (b) What was the maximum forecast temperature during the week?(c) What was the minimum actual temperature during the week?(d) On which day did the actual temperature differ the most from the forecast temperature?
View Solution
Knowledge Check
Day time temperature of moon is
A60∘CB70∘CC90∘CD110∘CDay time temperature of moon is
A60∘CB70∘CC90∘CD110∘COn which day is Earth Day celebrated?
A17 AprilB23 MarchC22 MayD22 April
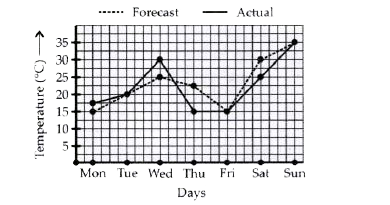
The following graph shows the temperature forecast and the actual temperature for each day of a week.
(a) On which days was the forecast temperature the same as the actual temperature?
(b) What was the maximum forecast temperature during the week?
(c) What was the minimum actual temperature during the week?
(d) On which day did the actual temperature differ the most from the forecast temperature?
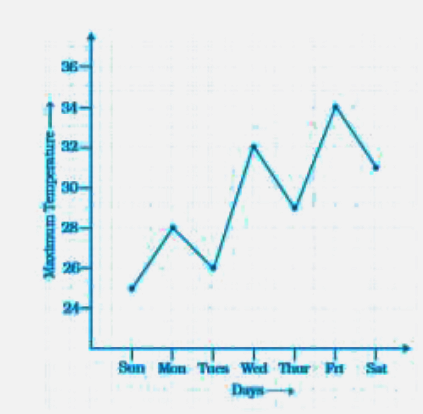
View SolutionStudy the graph and answer the questions that follow.
(a) What information does the graph give?
(b) On which day was the temperature the least?
(c) On which day was the temperature 31∘C?
(d) Which was the hottest day?
View SolutionThe following line graph shows the temperature forecast and the actual temperature for each day of a week.
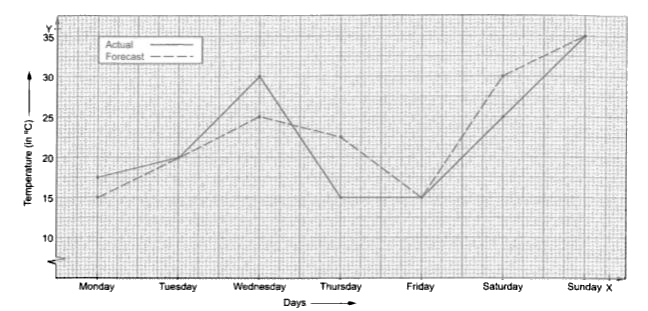
Study the above double line graph carefully and answer the questions given below:
(i) On which days was the forecast temperature the same as the actual temperature?
(ii) What was the maximum forecast temperature during the week ?
(iv) On which day did the actual temperature differ the most from the forecast temperature?
View SolutionThe graph shows the maximum temperatures recorded for two consecutive weeks of a town. Study the graph and answer the questions that follow.
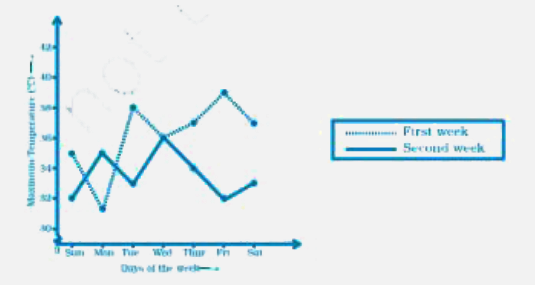
(a) What information is given by the two axes?
(b) In which week was the temperature higher on most of the days?
(c) On which day was the temperature same in both the weeks?
(d) On which day was the difference in temperatures the maximum for both the weeks?
(e) What were the temperatures for both the weeks on Thursday?
(f) On which day was the temperature 35°C for the first week?
(g) On which day was the temperature highest for the second week?
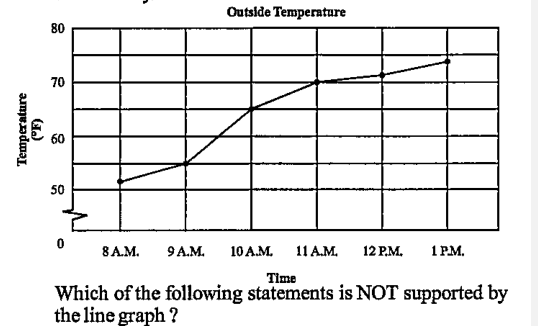
View SolutionThe graph below shows the outside temperature at various times of day.
View Solution
