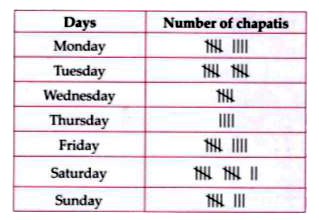
The given table shows the number of sweaters knitted by Mrs Kapoor in seven months .
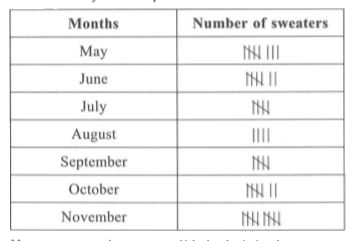
How many total sweaters did she knit in these seven months ?
42
46
54
47
The correct Answer is:B
Step by step video, text & image solution for The given table shows the number of sweaters knitted by Mrs Kapoor in seven months . How many total sweaters did she knit in these seven months ? by Maths experts to help you in doubts & scoring excellent marks in Class 6 exams.
Updated on:21/07/2023Topper's Solved these Questions
- IMO QUESTION PAPER 2019-20 SET ABOOK - SCIENCE OLYMPIAD FOUNDATION CHAPTER - IMO QUESTION PAPER 2019-20 SET AEXERCISE - EVERYDAY MATHEMATICS
10 Videos
- IMO QUESTION PAPER 2019-20 SET ABOOK - SCIENCE OLYMPIAD FOUNDATION CHAPTER - IMO QUESTION PAPER 2019-20 SET AEXERCISE - ACHIEVERS SECTION
7 Videos
- IMO QUESTION PAPER 2018-19 SET BBOOK - SCIENCE OLYMPIAD FOUNDATION CHAPTER - IMO QUESTION PAPER 2018-19 SET BEXERCISE - Everyday Mathematics
15 Videos
- IMO QUESTION PAPER 2019-20 SET B BOOK - SCIENCE OLYMPIAD FOUNDATION CHAPTER - IMO QUESTION PAPER 2019-20 SET B EXERCISE - ACHIEVERS SECTION
5 Videos
Similar Questions
Knowledge Check
The line chart given blow shows the number of cars manufactured (in 000') by company X in year 2015 from the month of July to December.
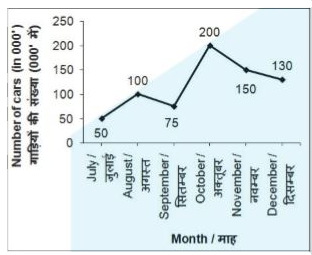
In how many months was the number of cars manufactured a multiple of 10,000?A6B5C4D7
The given table shows the number of tourists who visited Taj Mahal during different months. Month

Draw a bar graph to represent the above information by using appropriate scale.
View SolutionThe given bar graph shows the sale of different brands of shirts in a shop in one month.
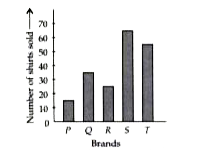
(i) How many total shirts are sold in the month ?
View SolutionHow many times did you fall sick in the last 12 months?
View SolutionThe given pictograph shows the sale of houses by a property dealer in different months.
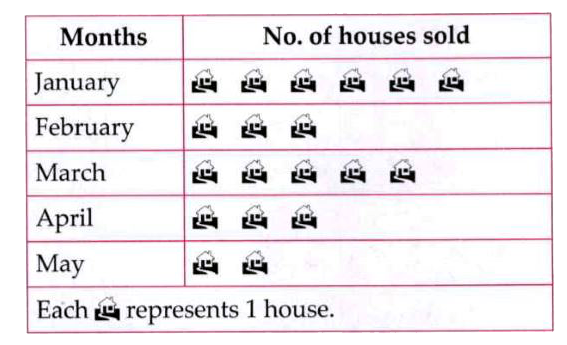
How many houses did the dealer sold in February and March altogether ?
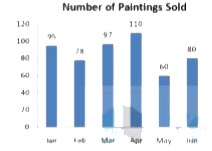
View SolutionThe bar graph shows the number of paintings sold by an art gallery in each month from January to June. How many paintings does it need to sell in July for the 7 month average to be 90?
View SolutionDirection: The given bar graph shows the number of pens sold by two shops A & B in four consecutive months. Study the following data and answer the following questions:
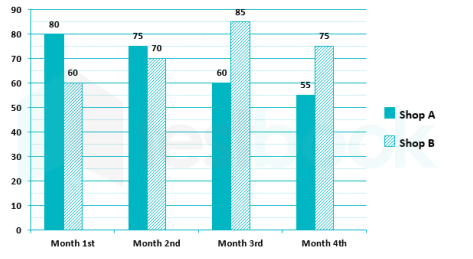
Find that the number of pens sold by shop A in 1st month is how much percent more than the number of pens sold by shop A in 3rd month.
View SolutionDirection: The given bar graph shows the number of pens sold by two shops A & B in four consecutive months. Study the following data and answer the following questions:
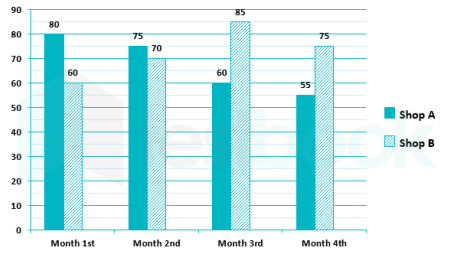
Find the ratio of the number of pens sold by shop A in 1st month to the number of pens sold by B in 3rd month.
View Solution

