The given double bar graph show the buyers DVDs and CDs. Study the graph and answer the following questions .
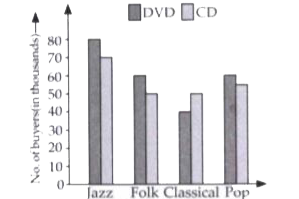
What is the ratio of Pop music DVD buyers to the Jazz music DVD buyers ?
6:7
11:16
11:14
3:4
The correct Answer is:B
Step by step video, text & image solution for The given double bar graph show the buyers DVDs and CDs. Study the graph and answer the following questions . What is the ratio of Pop music DVD buyers to the Jazz music DVD buyers ? by Maths experts to help you in doubts & scoring excellent marks in Class 7 exams.
Updated on:21/07/2023Topper's Solved these Questions
- IMO QUESTION PAPER 2017-18 SET ABOOK - SCIENCE OLYMPIAD FOUNDATION CHAPTER - IMO QUESTION PAPER 2017-18 SET AEXERCISE - EVERYDAY MATHEMATICS
10 Videos
- IMO QUESTION PAPER 2017-18 SET ABOOK - SCIENCE OLYMPIAD FOUNDATION CHAPTER - IMO QUESTION PAPER 2017-18 SET AEXERCISE - ACHIEVERS SECTION
5 Videos
- IMO QOESTION PAPER 2017-18 SET-BBOOK - SCIENCE OLYMPIAD FOUNDATION CHAPTER - IMO QOESTION PAPER 2017-18 SET-BEXERCISE - EVERYDAY MATHEMATICS
10 Videos
- IMO QUESTION PAPER 2018-19 SET - BBOOK - SCIENCE OLYMPIAD FOUNDATION CHAPTER - IMO QUESTION PAPER 2018-19 SET - BEXERCISE - ACHIEVERS SECTION
5 Videos
Similar Questions
The given double bar graph show the buyers DVDs and CDs. Study the graph and answer the following questions .
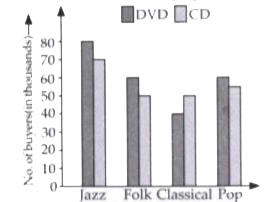
What is the difference between DVD buyers and CD buyers in Jazz music category ?
View SolutionStudy the bar graph and answer the following questions.
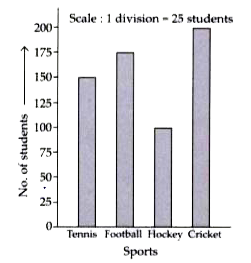
Which is the most popular sport ?
View Solution
Knowledge Check
The bar graph shows the debt of different countries. Study the diagram and answer the following questions.
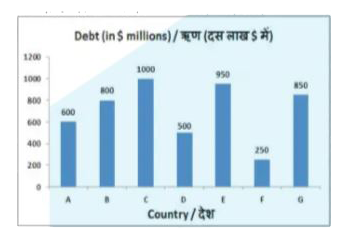
What is the ratio of debt of country A to that of country F?A12:5B5:12C6:5D5:6The bar graph shows the population of different countries. Study the diagram and answer the following questions.
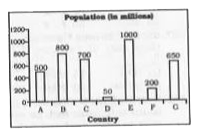
What is the ratio of population of country A to that of country G?A13:10B10:13C5:13D13:5The given bar graph shows the biscuit exports of India over a period of five years. Study the graph and answer the questions that follows
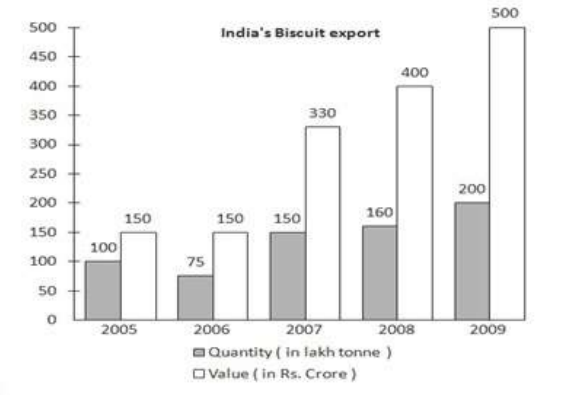
In which two year was the value per tonne equal?A2006 and 2007B2008 and 2009C2007 and 2008D2005 and 2006
Study the bar graph and answer the following questions.
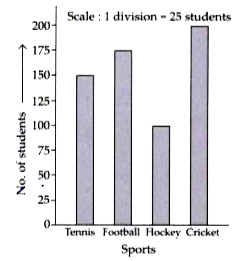
Which sport is preferred least ?
View SolutionRead the graph and answer the following questions
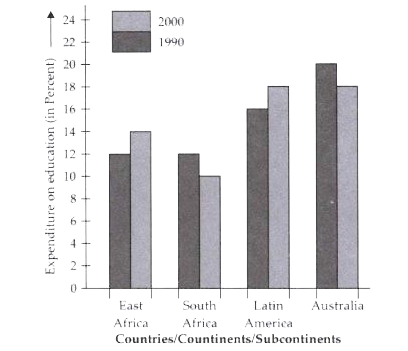
Give a suitable title to bar graph
View SolutionRead the bar graph and answer the following questons.
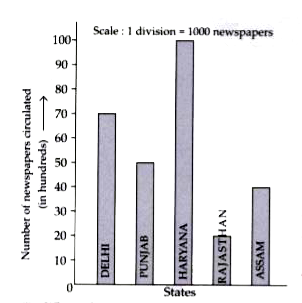
What information is given by graph ?
View SolutionRead the graph and answer the following questions
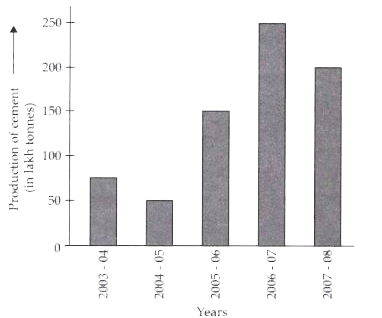
What information is conveyed by the bar graph
View SolutionRead the bar graph shown in figure and answer the following questions.
What is the information given by the bar graph?
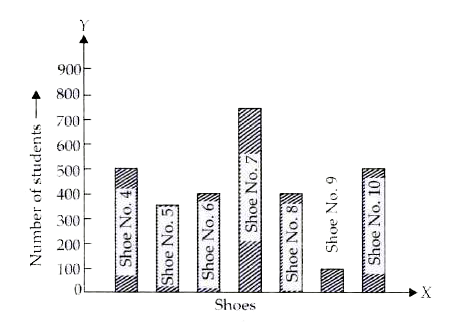
View Solution
