Line graph given below shows distance (in km) covered by Truck A and Truck B on five different days. Study the data carefully and answer the following questions.
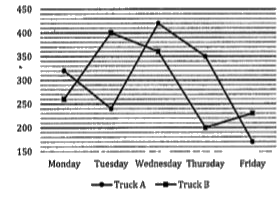
Distance travelled by truck A on Tuesday is how much percent more or less than distance travelled by truck B on Thursday?
15%
20%
30%
25%
The correct Answer is:B
Step by step video, text & image solution for Line graph given below shows distance (in km) covered by Truck A and Truck B on five different days. Study the data carefully and answer the following questions. Distance travelled by truck A on Tuesday is how much percent more or less than distance travelled by truck B on Thursday? by Maths experts to help you in doubts & scoring excellent marks in Class 14 exams.
Updated on:21/07/2023Topper's Solved these Questions
- DATA INTERPRETATIONBOOK - ADDA247CHAPTER - DATA INTERPRETATIONEXERCISE - Prelims Questions (Level-2)
59 Videos
- DATA INTERPRETATIONBOOK - ADDA247CHAPTER - DATA INTERPRETATIONEXERCISE - Mains Questions
33 Videos
- DATA INTERPRETATIONBOOK - ADDA247CHAPTER - DATA INTERPRETATIONEXERCISE - Basic Questions
30 Videos
- BOAT AND STREAM BOOK - ADDA247CHAPTER - BOAT AND STREAM EXERCISE - Previous Year Question
22 Videos
- DATA SUFFICIENCY BOOK - ADDA247CHAPTER - DATA SUFFICIENCY EXERCISE - PREVIOUS YEAR QUESTIONS
25 Videos
Similar Questions
Bar graph given below shows pens sold by a retailor on five different days. Study the data carefully and answer the following questions.
Pen sold on different days
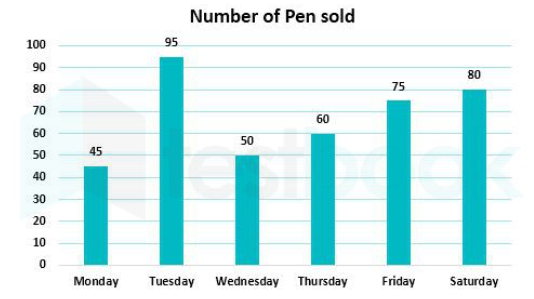
what is the average number of pens sold during a week if total number of pens sold on saturday is 25% more than total number of pens sold on Sunday .
View SolutionBar graph given below shows pens sold by a retailor on five different days. Study the data carefully and answer the following questions.
Pen sold on different days
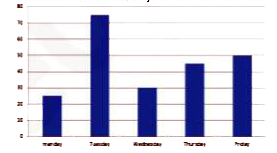
Find the difference between total number of pens sold on Monday and Tuesday together to total number of pens sold on Thursday and Friday together?
View Solution
Knowledge Check
If the distance travelled by Truck C on Wednesday was 986 km what was the time taken by it to travel that distance ?
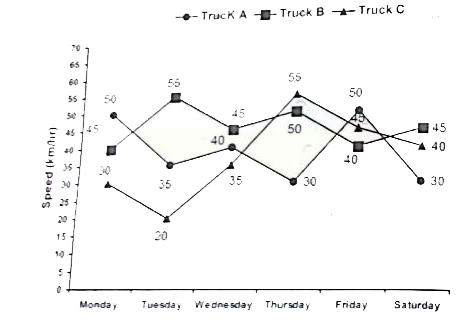 A26635 hrsB25435 hrsC22335 hrsDNone of these
The table below represents the distance (in km) travelled by six trucks on six different days of the week. Read the table and answer the questions based on it.
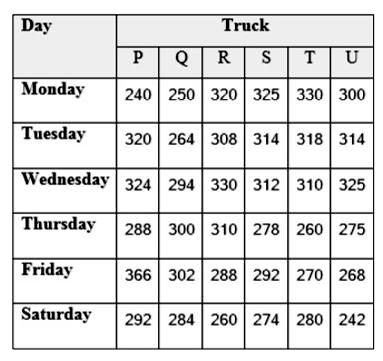
What is the average distance traveled by truck S on all the days together ?
A. 296 km
B. 299 km
C. 198 km
D. 199 kmAa. CBb. BCc. DDd. AThe table below represents the distance (in km) travelled by six trucks on six different days of the week. Read the table and answer the questions based on it.
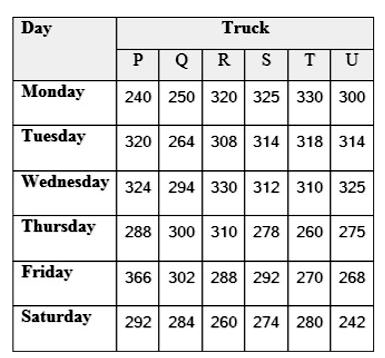
If to travel the given distance, the time taken by Truck Q on Friday was 8 hours, then what was its average speed on that day ?
A. 37.5 km/hr
B. 42.50 km/hr
C. 28.25 km/hr
D. 32.25 km/hrACBBCDDA
Table given below shows marks obtained by four students in four different subjects in an exam. Study the data carefully and answer the following questions.
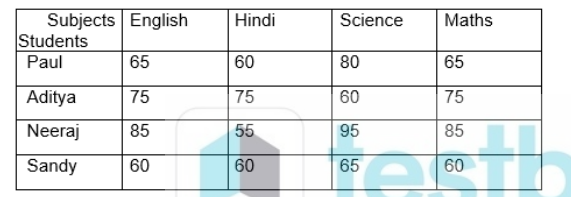
Total marks scored by Paul are how much more/less than total marks scored by Neeraj?
View SolutionDirection: The given bar graph shows the number of pens sold by two shops A & B in four consecutive months. Study the following data and answer the following questions:
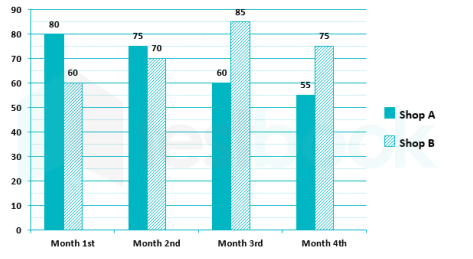
Find that the number of pens sold by shop A in 1st month is how much percent more than the number of pens sold by shop A in 3rd month.
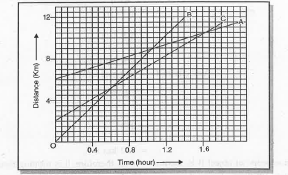
View SolutionFig 1.11 show the distance - time graphs of three A,B and C. Study the graph and answer the following question : Which of the three is travelling the fastest ?
View SolutionThe table below represents the distance (in km) travelled by six trucks on six different days of the week. Read the table and answer the questions based on it.
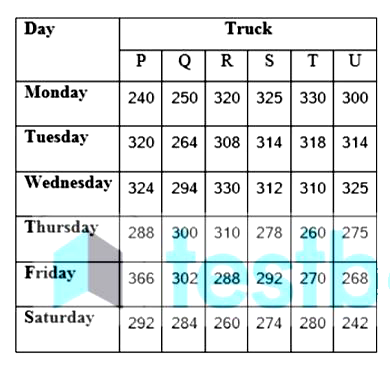
What is the total distacne travelled by all the trucks together on Saturday ?
A. 1623 km
B. 1263 km
C. 1362 km
D. 1632 km
View SolutionThe graph given here shows a car following the linear path with uniform speed. Study the graph and answer the questions.
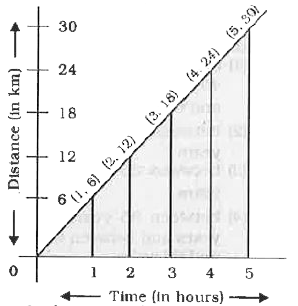
The distance travelled by the car in 4.5 hours is
View Solution
